Injustice - Developers Among Us (SciFiDevCon 2024)
Potential Contribution of Food Choices to Climate Change
1. Potential contributions of food consumption patterns to climate
change1–4
´lez
Annika Carlsson-Kanyama and Alejandro D Gonza
ABSTRACT (6), who studied diets from multiple viewpoints of sustainability,
Anthropogenic warming is caused mainly by emissions of green- showed that a Mediterranean diet, which consists mainly of
house gases (GHGs), such as carbon dioxide, methane, and nitrous plant-origin foods but not excluding a small proportion of meat
oxide, with agriculture as a main contributor for the latter 2 gases. and other animal products, is closer to public health recommen-
Other parts of the food system contribute carbon dioxide emissions dations issued by the World Health Organization (www.who.net)
Downloaded from www.ajcn.org at McGill University Library on November 24, 2009
that emanate from the use of fossil fuels in transportation, processing, and has a lower environmental effect than the current average US
retailing, storage, and preparation. Food items differ substantially diet. Current agricultural policies may be counterproductive for
when GHG emissions are calculated from farm to table. A recent achieving diets that are healthy and environmentally friendly (7).
study of ’20 items sold in Sweden showed a span of 0.4 to 30 kg New agricultural policies are needed that consider a reduction of
CO2 equivalents/kg edible product. For protein-rich food, such as environmental effects as well as a shift toward improved public
legumes, meat, fish, cheese, and eggs, the difference is a factor of 30 health and, in particular, a reduction of noncommunicable chronic
with the lowest emissions per kilogram for legumes, poultry, and diseases.
eggs and the highest for beef, cheese, and pork. Large emissions for This review is organized as follows: first, a short overview of
ruminants are explained mainly by methane emissions from enteric GHGs in food production systems; second, analysis of the total
fermentation. For vegetables and fruits, emissions usually are 2.5 contribution of 22 food items to GHG emissions; and third,
kg CO2 equivalents/kg product, even if there is a high degree of analysis of examples of simple meals to show the effect on GHG
processing and substantial transportation. Products transported by emission that food choices can make. We conclude by empha-
plane are an exception because emissions may be as large as for sizing that research is needed to understand why dietary change is
certain meats. Emissions from foods rich in carbohydrates, such as
not on the climate policy agenda.
potatoes, pasta, and wheat, are ,1.1 kg/kg edible food. We suggest
that changes in the diet toward more plant-based foods, toward meat
from animals with little enteric fermentation, and toward foods GHGs IN FOOD PRODUCTION
processed in an energy-efficient manner offer an interesting and
According to the latest report of Working Group I of the
little explored area for mitigating climate change. Am J Clin
Intergovernmental Panel on Climate Change (IPCC) (8), carbon
Nutr 2009;89(suppl):1704S–9S.
dioxide is the most important anthropogenic GHG. The main
source of human-induced emissions is the use of fossil fuels.
Other gases, however, so-called non–carbon dioxide GHGs, also
INTRODUCTION are important as drivers for climate change. For instance, meth-
ane is second to carbon dioxide when it comes to the overall
Anthropogenic emissions of greenhouse gases (GHGs) arise
contributions of radiative forcing. Radiative forcing is the
from a large variety of activities. Previous studies (1–3) have
change in the net irradiance in the tropopause due to external
shown that choice of food and diet can influence the energy
requirements for the provision of human nutrition and the as-
sociated GHG emissions. Meals similar in caloric content may 1
From the Division of Industrial Ecology, Royal Institute of Technology,
differ by a factor of 2 to 9 in GHG emissions (1, 2). An analysis Stockholm, Sweden (AC-K), and the Research Institute on Biodiversity and
of the energy inputs required to produce a large number of food Environment (Inibioma-Conicet), Bariloche, Argentina (ADG).
items showed that meals with similar nutritional value had 2
Presented at the symposium, ‘‘Fifth International Congress on Vegetar-
a difference in GHG emissions of up to a factor of 4, depending ian Nutrition,’’ held in Loma Linda, CA, March 4–6, 2008.
3
on the items chosen (3). All of these studies identified certain Supported by the Swedish Research Council Formas as part of the in-
foods as more resource demanding/polluting, including animal formation project, ‘‘Urban households and consumption related resource use:
products and certain vegetable products produced in resource- Developing a tool for environmental menu planning.’’ Important contribu-
´
tions also were made by Consejo Nacional de Investigaciones Cientıficas y
intensive ways. ´
Tecnicas (Conicet), Buenos Aires, Argentina.
Current trends in food choices point toward increased envi- 4
Reprints not available. Address correspondence to A Carlsson-Kanyama,
ronmental effects (4, 5). More environmentally friendly diets Division of Industrial Ecology, Royal Institute of Technology, SE 100 44,
need to be identified. When environmental and health aspects of Stockholm, Sweden. E-mail: annika@carlsson-kanyama.se.
diets are considered, there is no apparent contradiction. Duchin First published online April 1, 2009; doi: 10.3945/ajcn.2009.26736AA.
1704S Am J Clin Nutr 2009;89(suppl):1704S–9S. Printed in USA. Ó 2009 American Society of Nutrition
2. FOOD CONSUMPTION PATTERNS AND CLIMATE CHANGE 1705S
drivers such as concentrations of GHGs. Halocarbons are third be differentiated. For example, coal emits 1.6 times more carbon
and nitrous oxide is fourth in contributing to radiative forcing. dioxide per megajoule than natural gas. Emissions of nitrous
Because the radiative properties of GHGs differ substantially, oxide may be calculated if the nitrogen fertilizer or manure use
even small amounts of certain gases may cause significant change during farming is known.
when emitted into the atmosphere. For example, on a molecule- For animal products and rice produced under flooded con-
to-molecule basis, nitrous oxide is ’300 times more efficient than ditions, the calculation of GHG emissions is more complicated.
carbon dioxide. The global increase in methaneand nitrous oxide For animal products, nitrous oxide emissions during manure
in the atmosphere is caused primarily by agriculture (9). Of global storage and emissions of methane must be considered. During
anthropogenic emissions in 2005, agriculture accounted for manure handling, lagoons are the main source of methane,
’60% of nitrous oxide and ’50% of methane (10). The amount whereas in the cultivation of rice, this gas is released when fields
of such emissions from agriculture depends on production tech- are under water. The methane emissions depend on the amounts
niques, natural processes in soils, and animal metabolism. Sub- of organic matter and the length of time anaerobic conditions are
stantial emissions of carbon dioxide also occur during maintained. The decomposition of manure (urine and feces) in
mechanized agriculture because of fossil fuel requirements for liquid form can produce a significant amount of methane. Higher
inputs such as fertilizers and energy requirements during irriga- emissions are shown when animals are kept in large numbers in
tion and other farming practices (11). confined conditions, such as dairy farms, cattle feedlots, and
Regarding non–carbon dioxide GHGs, methane is produced intensive pig farms. Under these conditions, manure usually is
Downloaded from www.ajcn.org at McGill University Library on November 24, 2009
when organic materials decompose in oxygen-deprived con- handled in liquid systems.
ditions, notably from fermentative digestion by ruminant live- Herbivores and most ruminants are another important source
stock, from stored manures, and from rice grown under flooded of methane emissions. In these animals, cellulose and other
conditions (10, 12). Emissions of this gas, therefore, can be tied complex carbohydrates are digested with the aid of micro-
to products such as meat, milk, and rice. Nitrous oxide is gen- organisms. The associated processes are collectively called en-
erated by the microbial transformation of nitrogen in soils and teric fermentation. Methane is produced in this type of microbial
manures and often is enhanced where available nitrogen exceeds digestion. The amount released depends on the type of animal,
plant requirements, especially under wet conditions (10, 12). the quality and quantity of feed, and the characteristics of
Emissions of nitrous oxide, therefore, can be tied to any crop livestock. The main ruminants that produce extensive amounts of
grown under these conditions and to animal products. Emissions methane are cattle, buffalo, sheep, goats, and deer, but, because
of nitrous oxide also occur when synthetic nitrogen fertilizers of their numbers, only animals under domesticated conditions
are produced. These emissions are worth considering when diets contribute significantly to climate change. The more feed intake,
and food products that use different agricultural practices are the higher the methane emissions. When the efficiency of con-
compared. An assessment of non–carbon dioxide GHG emis- verting feed into food is low, emissions per unit of food are high.
sions in agriculture is valuable not only because of their effect Birds and pigs convert feed more efficiently than cattle and sheep.
on climate change but also because emissions are present even if As a result, methane emissions from enteric fermentation counted
a reduction in fossil fuel emissions occurs, eg, through efficiency per unit of beef can be the largest single contribution to total GHG
improvements or from the increased use of renewable energy emissions (discussed below).
sources. Because methaneand nitrous oxideemitted into the atmosphere
The relative importance of different GHGs, when all are added interact with other gases, eg, aerosols and radiation, a decay or
and weighted, depends on a range of factors (Table 1). An enhancement of their concentration and activity is expected.
analysis of any food item must include the degree of processing, Global Warming Potential (GWP) is shown in Table 1 (GWP is
transportation mode and distances, presence of red meat, amount the relative incidence of each gas as a possible contributor to
of nitrogen fertilizer used, manure application, and storage climate change). By definition, the GWP of carbon dioxide is
method. For vegetable products, energy use often is the domi- equal to one. For example, a GWP of 25 for methane in a 100-y
nant contribution of carbon dioxide emissions, but nitrous oxide period means that all amounts obtained in grams of methane in
emissions related to nitrogen application and fabrication also the inventories should be multiplied by 25 to convert them into
may be significant. For an analysis of vegetable products, kg CO2 equivalents.
emissions of carbon dioxide may be calculated from an energy On the basis of the latest expert panel report on GHG calculations
analysis based on known amounts of carbon dioxide emissions for national inventories from the IPCC, we assessed non–carbon
per megajoule of energy used. Types of energy carriers should dioxide emissions for various cereals, legumes, vegetables, milk,
and meats from different animals. Detailed calculations and the
corresponding uncertainty analysis are reported elsewhere (13).
TABLE 1
(See also Appendix A for an example of how nitrous oxide
Global Warming Potential for gases relevant to agriculture1
emissions are calculated for wheat and soybeans.) For the animal
Greenhouse gases 20 y 100 y 500 y products analyzed, we considered emissions during cultivation of
Nitrous oxide 289 298 153 the feed required for rearing the animals when making these es-
Methane 72 25 7.6 timates. As an example, the results for beef and pork are shown in
1 Table 2. The roles of enteric fermentation and manure manage-
Values were obtained from the Intergovernmental Panel on Climate
Change (Reference 8, Table 2.14). The Global Warming Potential is an index ment can be observed. Poultry contributes lower non–carbon di-
that measures the radiative forcing of a unit mass of a given well-mixed oxide emissions than do beef and pork, with nitrous oxide
greenhouse gas in the present-day atmosphere integrated over a chosen time emissions of 0.26-kg CO2 equivalent/kg carcass and almost no
horizon, relative to that of carbon dioxide. methane emissions due to dry management of manure. No data
3. 1706S ´
CARLSSON-KANYAMA AND GONZA LEZ
TABLE 2 kg/kg product because of the extensive use of fuel for trawling.
Non–carbon dioxide emissions for producing carcasses of beef and pork Cod is heavily overfished in the Baltic Sea, such that it is on the
Emissions from cattle Emissions from pigs verge of extinction (14). Fuel used to catch the remaining stock
is considerable but cod fishing is still profitable because of heavy
kg CO2 equivalents/ kg CO2 equivalents/ subsidies for fisheries in the European Union.
kg carcass % kg carcass % To compare the values shown in Table 3 with GHG emissions
Nitrous oxide resulting from activities other than eating, we considered the use
Feed 1.25 12 0.38 13 of a motor vehicle. The average carbon dioxide emission per
Manure 1.07 10 0.07 3 kilometer from the current passenger car fleet in the European
Methane Union is 186 g (15). The total GHG emissions shown for beef in
Manure 1.78 17 2.06 75 Table 3 mean that the consumption of 1 kg domestic beef in
Enteric 6.33 61 0.24 9
a household represents automobile use of a distance of ’160 km
Total non–carbon 10.43 — 2.75 —
dioxide emissions
(99 miles).
PLANT AND ANIMAL PROTEIN AND THEIR
were available for enteric fermentation. The IPCC (8) does not CONTRIBUTIONS TO GHG EMISSIONS
report a zero value but states that not enough data on enteric fer-
Downloaded from www.ajcn.org at McGill University Library on November 24, 2009
mentation of poultry are available to make a clear assessment. In Previous studies have shown that producing protein from soy
this case, the percentage from feed was 93%. These examples and other legumes has a very low environmental effect compared
show the diversity of variables and their relative weights influ- with protein production from animal products (16). In this study,
encing non–carbon dioxide GHG emissions during animal pro- we also concluded that it is more ‘‘climate efficient’’ to produce
duction. In addition, the comparison in meats help show the protein from vegetable sources than from animal sources, al-
important role of enteric fermentation in total emissions. though some animal products are fairly climate efficient. When
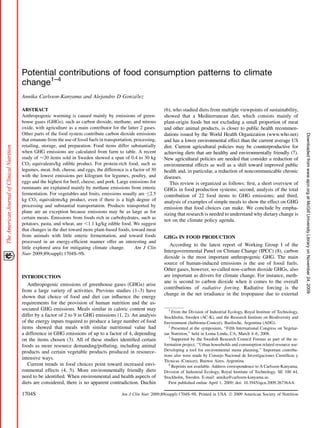
the results shown in Table 3 are combined with the protein
content per kilogram of each food item, the amount of protein
TOTAL CONTRIBUTIONS OF GHGs TO SPECIFIC FOOD available per amount of GHG emissions is distinct (Figure 1).
ITEMS Beef is the least efficient way to produce protein, less efficient
We also studied the total GHG emissions for 22 food items sold than vegetables that are not recognized for their high protein
in Sweden and created an inventory of carbon dioxide, methane, content, such as green beans or carrots. The most climate-efficient
and nitrous oxide from farm to table and used the GWPs (see way to consume protein is to eat a mixture of cereals, legumes,
Table 1) to estimate total emissions measured in CO2 equiv- and fish caught in a fuel-efficient way (see Figure 1). Un-
alents. Emissions of methane and nitrous oxide were obtained fortunately, the fish stock is under severe threat with many stocks
(explained above), and carbon dioxide emissions were calcu- that are over- or fully exploited (17), leaving environmentally
lated based on an energy analysis (3) and a subsequent calcu- conscious consumers with mainly vegetarian alternatives.
lation of carbon dioxide emissions. Allocation was based on
economic principles, meaning that the allocation of resource use
and emissions was based on the value of the various products EXAMPLES OF MEALS
obtained in a process (eg, flour and husks during milling). In Table 4, 3 possible meals with different GHG emissions
Losses were estimated during all stages in the food system, are described. For simplicity, only main ingredients are in-
including preparation and consumption. The emissions for food cluded. These 3 options for meals with similar nutritional
items ready to be consumed by households in Sweden are shown composition represent a span in GHG emissions of a factor of 11
in Table 3. Emissions during storage and handling at home also between the meal with the lowest and highest emission levels.
were considered. Details on calculation of carbon dioxide The example shows how much influence food choices can have
emissions during the production chain of soybeans are provided on GHG emissions.
in Appendix B.
Fresh vegetables, cereals, and legumes present the lowest
emissions. Meats and fruits transported by air have the highest CONCLUSIONS AND REFLECTIONS
total GHG emissions, whereas eggs, certain fish, and frozen We have studied emissions of the main GHGs in food pro-
vegetables are found in the midrange. Animal products range duction and consumption, namely carbon dioxide, methane, and
from 1.5 to 30 kg of GHG emissions/kg of food, with herring— nitrous oxide. For plant-based foods (with the exception of rice),
a fish caught with little use of fossil fuel—and eggs at the lower emissions of carbon dioxide often are the dominant contribution
end of the animal products. The values of methane and nitrous and with nitrous oxide present in small percentages. For animal-
oxide emissions for beef and pork are not the same as those shown based foods and rice, the non–carbon dioxide gases contribute
in Table 2 because of the difference in functional units: in Table significantly. Plant foods based on vegetables, cereals, and
2, kilograms per carcass and in Table 3 kilograms per prepared legumes present the lowest GHG emissions with the exception of
food item. Foods that commonly have low GHG emissions, such those transported by airplanes. Animal products, including dairy,
as fruits in some circumstances, when they are transported by are associated with higher GHG emissions than plant-based
air, may have emissions as large as some types of meat. Fish products, with the highest emissions occurring in meats from
may or may not present high emissions of carbon dioxide due to ruminants. Fowl meat and eggs are fairly climate-friendly meat
fossil fuel use. As shown in Table 3, cod emissions are close to 9 products.
4. FOOD CONSUMPTION PATTERNS AND CLIMATE CHANGE 1707S
TABLE 3
Carbon dioxide, methane, and nitrous oxide emissions from farm to table for 22 items commonly consumed in Sweden
Emissions1
Commonly consumed foods Carbon dioxide Nitrous oxide Methane Total
kg CO2 equivalents/kg product
Carrots: domestic, fresh 0.38 0.04 0.0 0.42
Potatoes: cooked, domestic 0.40 0.06 0.0 0.45
Honey 0.46 0.0 0.0 0.46
Whole wheat: domestic, cooked 0.54 0.08 0.0 0.63
Apples: fresh, overseas by boat 0.80 0.02 0.0 0.82
Soybeans: cooked, overseas by boat 0.92 0.0 0.0 0.92
Milk: domestic, 4% fat 0.45 0.14 0.45 1.0
Sugar: domestic 1.04 0.03 0.0 1.1
Italian pasta: cooked 0.96 0.12 0.0 1.1
Oranges: fresh, overseas by boat 1.1 0.10 0.0 1.2
Rice: cooked 0.59 0.21 0.52 1.3
Green beans: South Europe, boiled 1.2 0.12 0.0 1.3
Downloaded from www.ajcn.org at McGill University Library on November 24, 2009
Herring: domestic, cooked 1.5 0.0 0.0 1.5
Vegetables: frozen, overseas by boat, boiled 2.2 0.05 0.0 2.3
Eggs: Swedish, cooked 1.7 0.74 0.04 2.5
Rapeseed oil: from Europe 1.5 1.5 0.0 3.0
Chicken: fresh, domestic, cooked 3.1 1.2 0.01 4.3
Cod: domestic, cooked 8.5 0.0 0.0 8.5
Pork: domestic, fresh, cooked 3.9 1.6 3.8 9.3
Cheese: domestic 5.0 1.3 4.5 11
Tropical fruit: fresh, overseas by plane 11 0.23 0.0 11
Beef: domestic, fresh, cooked 6.9 6.6 17 30
1
Values represent kg CO2 equivalents over a 100-y time period.
The analysis shows that changes toward a more plant-based the inclusion of protein extenders from plant origin would be
diet could help substantially in mitigating emissions of GHGs. a practical way to replace red meats. McMichael et al (19)
Unfortunately, this is a largely unexplored area of climate recently proposed a 10% reduction in the current global aver-
policy. Few authors have proposed changes that lower meat age meat consumption of 100 g per person per day as a work-
consumption. Smil (18) suggested that because a large per- ing global target. We agree with these 2 proposals, which could
centage of beef is consumed ground in hamburgers or sausages, be implemented simultaneously. In the long run, however, achieving
FIGURE 1. Protein content per amount of greenhouse gases (GHGs) emitted for various types of food.
5. 1708S ´
CARLSSON-KANYAMA AND GONZA LEZ
TABLE 4 2. Engstrom R, Wadeskog A, Finnveden G. Environmental assessment of
¨
Main ingredients in 3 meal options from Sweden with different greenhouse Swedish agriculture. Ecol Econ 2007;60:550–63.
gas (GHG) emissions1 3. Carlsson-Kanyama A, Ekstrom MP, Shanahan H. Food and life cycle
¨
energy inputs: consequences of diet and ways to increase efficiency.
Edible weight GHG emissions Ecol Econ 2003;44:293–307.
´
4. Carlsson-Kanyama A, Linden A-L. Trends in food production and
kg kg CO2 equivalents
consumption: Swedish experiences from environmental and cultural
Meal A impacts. Int J Sustain Dev 2001;4:392–406.
Carrots: domestic, fresh, raw 0.10 0.04 5. Carlsson-Kanyama A. Diet, energy and greenhouse gas emissions. In:
Whole wheat: domestic, cooked 0.10 0.06 Cleveland CJ, ed. Encyclopedia of energy. Amsterdam, Netherlands:
Soybeans: overseas by boat, 0.25 0.23 Elsevier, 2004;809–16.
cooked 6. Duchin F. Sustainable consumption of food: a framework for analyzing
Apples: domestic, fresh, raw 0.10 0.08 scenarios about changes in diets. J Ind Ecol 2005;9:99–114.
Total for meal A 0.55 0.42 7. Hawkes C. Agricultural and food policy for cardiovascular health in
Meal B Latin America. Prev Control 2006;2:137–47.
Green beans: EU, boiled 0.10 0.13 8. Intergovernmental Panel on Climate Change. Working group I. Climate
Potatoes: cooked 0.30 0.14 change 2007: the physical science basis. Version ISBN 978 0521
70596–7. Available from: http://ipcc-wg1.ucar.edu/wg1/wg1-report.html
Pork meat: cooked 0.10 0.94
(cited 7 September 2007).
Orange: overseas by boat 0.10 0.12
9. Environmental Protection Agency USA. Global anthropogenic non-CO2
Total for meal B 0.60 1.3 greenhouse gas emissions: 1990–2020. Available from: http://www.epa.
Downloaded from www.ajcn.org at McGill University Library on November 24, 2009
Meal C gov/nonco2/econ-inv/downloads/GlobalAnthroEmissionsReport.pdf (cited
Vegetables: frozen, cooked 0.10 0.23 5 September 2007).
Rice: overseas by boat, cooked 0.20 0.26 10. Intergovernmental Panel on Climate Change. Working group III. Cli-
Beef: domestic, fresh, cooked 0.10 3.0 mate change 2007: mitigation of climate change. Available from: http://
Tropical fruits: by plane, 0.10 1.1 arch.rivm.nl/env/int/ipcc/pages_media/ar4.html (cited 15 April 2008).
fresh, raw 11. Pimentel D, Pimentel M. Sustainability of meat-based and plant-based
Total for meal C 0.50 4.7 diets and the environment. Am J Clin Nutr 2003;78:664S–8S.
1
12. 2006 Guidelines for National Greenhouse Gas Inventories. In-
All meals have similar nutritional compensation. Each meal has a por- tergovernmental Panel on Climate Change. Available from: http://www.i
tion of vegetables, fruits, cereal, and protein-rich food. Energy and protein pcc-nggip.iges.or.jp/public/2006gl/index.htm (cited 7 September 2007).
content of meals is similar. ´
13. Carlsson-Kanyama A, Gonzalez AD. Non-CO2 greenhouse gas emissions
associated with food production: methane (CH4) and nitrous oxide (N2O).
KTH report Trita-IMA 2007:22. Available from: http://www.ima.kth.se/
eng/respublic/emissions_report_17_set_ACK.pdf (cited 20 March 2008).
further reductions will be necessary. The magnitude of these 14. GreenPeace. The cod fishery in the Baltic Sea: unsustainable and illegal.
will depend not only on the need for stabilizing levels of GHG Available from: http://www.greenpeace.org/raw/content/international/
emissions in the atmosphere but also on efficient use of arable press/reports/cod-fishery-baltic-sea.pdf (cited 15 April 2008).
15. European Union. CO2 emissions from new passenger cars: monitoring.
land in a world in which the quest for renewable energy, such Available from: http://europa.eu/scadplus/leg/en/lvb/l28055.htm (cited
as biofuel, is increasing. It is not impossible to imagine a fu- 15 April 2008).
ture world relying on renewable energy and in which the 16. Reijnders L, Soret S. Quantification of the environmental impact of
consumption of certain meats is an exception and reserved for different dietary protein choices. Am J Clin Nutr 2003;78:664S–8S.
17. United Nations Food and Agriculture Organization (FAO). General sit-
certain festivities and rituals. uation of world fish stocks. Available from: http://www.fao.org/
For the immediate future, we recommend a better synergy newsroom/common/ecg/1000505/en/stocks.pdf (cited 5 June 2008).
between environmental and health education to obtain agreement 18. Smil V. Worldwide transformation of diets, burden of meat production and
for a dietary change for the general public. Duchin (6) and opportunities for novel food proteins. Enzyme Microb Technol 2002;
McMichael et al (19) explained the health benefits that a plant- 30:305–11.
19. McMichael A, Powles JW, Butler CD, Uauy R. Food, livestock pro-
based diet would have on health and environment, and this duction, energy, climate change, and health. Lancet 2007;370:1253–63.
knowledge could be translated into information campaigns. In 20. Carlsson-Kanyama A, Faist M. Energy use in the food sector: a data
the many actions currently proposed for climate-friendly con- survey. FMS report. Available from: http://www.infra.kth.se/fms/pdf/
sumption, however, more vegetarian food is hardly a main issue, energyuse.pdf (cited 14 March 2009).
21. Lal R. Carbon emissions from farm operations. Environ Int 2004;30:
if it is mentioned at all. This conclusion was made after 981–90.
browsing several sites offering advice for consumers and from ´
22. Rajaram S, Sabate J. Preface. Am J Clin Nutr 2009;89(suppl):1541S–2S.
attending many debates and seminars concerning climate change 23. Jacobs DR Jr, Gross MD, Tapsell LC. Food synergy: an operational
effects from food consumption. Further research is needed to concept for understanding nutrition. Am J Clin Nutr 2009;89(suppl):
understand barriers and why changes in diets have not been 1543S–8S.
24. Jacobs DR Jr, Haddad EH, Lanou AJ, Messina MJ. Food, plant food, and
a main issue on the climate agenda until now. (Other articles in vegetarian diets in the US dietary guidelines: conclusions of an expert
this supplement to the Journal include references 22–48.) panel. Am J Clin Nutr 2009;89(suppl):1549S–52S.
25. Lampe JW. Interindividual differences in response to plant-based
AC-K and ADG shared equal responsibility in creating this article. They diets: implications for cancer risk. Am J Clin Nutr 2009;89(suppl):
had no conflicts of interest to disclose. 1553S–7S.
26. Simon JA, Chen Y-H, Bent S. The relation of a-linolenic acid to the risk
of prostate cancer: a systematic review and meta-analysis. Am J Clin
Nutr 2009;89(suppl):1558S–64S.
REFERENCES 27. Pierce JP, Natarajan L, Caan BJ, et al. Dietary change and reduced breast
1. Carlsson-Kanyama A. Climate change and dietary choices—how can cancer events among women without hot flashes after treatment of
emissions of greenhouse gases from food consumption be reduced? early-stage breast cancer: subgroup analysis of the Women’s Healthy
Food Policy 1998;23:277–93. Eating and Living Study. Am J Clin Nutr 2009;89(suppl):1565S–71S.
6. FOOD CONSUMPTION PATTERNS AND CLIMATE CHANGE 1709S
28. Newby PK. Plant foods and plant-based diets: protective against child- APPENDIX A
hood obesity? Am J Clin Nutr 2009;89(suppl):1572S–87S.
29. Barnard ND, Cohen J, Jenkins DJA, et al. A low-fat vegan diet and a con- Calculating nitrous oxide emissions during production of
ventional diabetes diet in the treatment of type 2 diabetes: a randomized, wheat and soybeans
controlled, 74-wk clinical trial. Am J Clin Nutr 2009;89(suppl):1588S–96S.
30. Mangat I. Do vegetarians have to eat fish for optimal cardiovascular The emission factor for the fraction of nitrous oxide emitted
protection? Am J Clin Nutr 2009;89(suppl):1597S–601S. in fertilized fields depends on the amount of nitrogen applied per
31. Willis LM, Shukitt-Hale B, Joseph JA. Modulation of cognition and
behavior in aged animals: role for antioxidant- and essential fatty
hectare and the crop yield. The procedure to calculate it is given
acid–rich plant foods. Am J Clin Nutr 2009;89(suppl):1602S–6S. by the IPCC (8). For example, conventional wheat grown in
32. Fraser GE. Vegetarian diets: what do we know of their effects on Sweden requires ’24 kg N applied per metric tonne of crop.
common chronic diseases? Am J Clin Nutr 2009;89(suppl):1607S–12S. With an emission factor of 0.014 kg N2O/kg N and the GWP for
33. Key TJ, Appleby PN, Spencer EA, Travis RC, Roddam AW, Allen NE. 100 y of age lifetime taken from Table 1, a total of between 0.10
Mortality in British vegetarians: results from the European Prospective and 0.12 kg CO2 equivalents/kg of wheat harvest is obtained. In
Investigation into Cancer and Nutrition (EPIC-Oxford). Am J Clin Nutr
addition, if crop residues are left on fields, their decomposition
2009;89(suppl):1613S–9S.
34. Key TJ, Appleby PN, Spencer EA, Travis RC, Roddam AW, Allen NE. involves nitrogen contents, and the IPCC procedure calculation
Cancer incidence in vegetarians: results from the European Prospective leads to an additional 0.06 kg CO2 equivalent/kg wheat harvest.
Investigation into Cancer and Nutrition (EPIC-Oxford). Am J Clin Nutr Then, the total nitrous oxide from wheat is ’1.7 kg CO2
2009;89(suppl):1620S–6S. equivalents/kg wheat harvest. Soybeans require little fertiliza-
Downloaded from www.ajcn.org at McGill University Library on November 24, 2009
35. Craig WJ. Health effects of vegan diets. Am J Clin Nutr 2009;89(suppl): tion. Their crop residue, however, usually is left on the field be-
1627S–33S.
36. Weaver CM. Should dairy be recommended as part of a healthy vege-
cause of no-till practices. With the same procedure, an emission
tarian diet? Point. Am J Clin Nutr 2009;89(suppl):1634S–7S. from fertilization gives 0.004 kg CO2 equivalent/kg soybeans
37. Lanou AJ. Should dairy be recommended as part of a healthy vegetarian harvested but ’0.07 from residues, given a total of nitrous oxide
diet? Counterpoint. Am J Clin Nutr 2009;89(suppl):1638S–42S. emissions of 0.074 CO2 equivalent/kg soybeans harvested.
´
38. Sabate J, Ang Y. Nuts and health outcomes: new epidemiologic evi-
dence. Am J Clin Nutr 2009;89(suppl):1643S–8S.
39. Ros E. Nuts and novel biomarkers of cardiovascular disease. Am J Clin APPENDIX B
Nutr 2009;89(suppl):1649S–56S.
´
40. Rajaram S, Haddad EH, Mejia A, Sabate J. Walnuts and fatty fish in- Calculating carbon dioxide emissions during production of
fluence different serum lipid fractions in normal to mildly hyper-
soybeans
lipidemic individuals: a randomized controlled study. Am J Clin Nutr
2009;89(suppl):1657S–63S. Irrigated soy farming in Nebraska produces ’3.6 metric
41. Lampe JW. Is equol the key to the efficacy of soy foods? Am J Clin Nutr
2009;89:1664S–7S.
tonnes/hectare and requires an input of ’300 L of diesel, 10 kg
42. Badger TM, Gilchrist JM, Pivik RT, et al. The health implications of soy phosphorus fertilizers, and 26 kg potassium fertilizers. With the
infant formula. Am J Clin Nutr 2009;89(suppl):1668S–72S. use of available data (20, 21), carbon dioxide emissions of 0.25
43. Messina M, Wu AH. Perspectives on the soy–breast cancer relation. Am kg CO2/kg soy harvest are obtained. Then, to obtain emissions at
J Clin Nutr 2009;89(suppl):1673S–9S. Swedish household consumption level, the emissions from
44. Lonnerdal B. Soybean ferritin: implications for iron status of vegeta-
¨
transport, packing, storage, retailing, and cooking are added
rians. Am J Clin Nutr 2009;89(suppl):1680S–5S.
45. Chan J, Jaceldo-Siegl K, Fraser GE. Serum 25-hydroxyvitamin D status considering their corresponding losses in the food chain. For
of vegetarians, partial vegetarians, and nonvegetarians: the Adventist example, land and sea transport accounts for 0.32 kg CO2/kg soy
Health Study-2. Am J Clin Nutr 2009;89(suppl):1686S–92S. when transport overseas is included. Cooking beans at home
46. Elmadfa I, Singer I. Vitamin B-12 and homocysteine status among veg- generates ’3 MJ/kg output, and the carbon dioxide emissions
etarians: a global perspective. Am J Clin Nutr 2009;89(suppl):1693S–8S. per megajoule used depends on the energy source (eg, electricity
47. Marlow HJ, Hayes WK, Soret S, Carter RL, Schwab ER, Sabate J. Diet ´
and the environment: does what you eat matter? Am J Clin Nutr 2009;
from nuclear or hydropower have much fewer emissions than
89(suppl):1699S–703S. coal). It is beyond the scope of this article to discuss all the
48. Eshel G, Martin PA. Geophysics and nutritional science: toward a novel, details. For further examples of complete energy accounts in
unified paradigm. Am J Clin Nutr 2009;89(suppl):1710S–6S. food analysis, see the report by Carlsson-Kanyama and Faist (20)