

Recommandé
Contenu connexe
Tendances
Tendances (20)
Similaire à Dtm notes
Similaire à Dtm notes (20)
Plus de Moses Lutta
Plus de Moses Lutta (20)
Dernier
Dernier (20)
Dtm notes
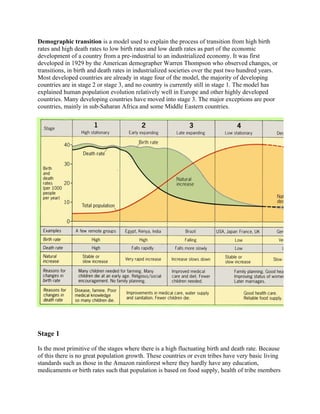
- 1. Demographic transition is a model used to explain the process of transition from high birth rates and high death rates to low birth rates and low death rates as part of the economic development of a country from a pre-industrial to an industrialized economy. It was first developed in 1929 by the American demographer Warren Thompson who observed changes, or transitions, in birth and death rates in industrialized societies over the past two hundred years. Most developed countries are already in stage four of the model, the majority of developing countries are in stage 2 or stage 3, and no country is currently still in stage 1. The model has explained human population evolution relatively well in Europe and other highly developed countries. Many developing countries have moved into stage 3. The major exceptions are poor countries, mainly in sub-Saharan Africa and some Middle Eastern countries. Stage 1 Is the most primitive of the stages where there is a high fluctuating birth and death rate. Because of this there is no great population growth. These countries or even tribes have very basic living standards such as those in the Amazon rainforest where they hardly have any education, medicaments or birth rates such that population is based on food supply, health of tribe members
- 2. etc. Other factors involved are no family planning therefore many children or because of the faith of the people which may look at large families as a sign of virility etc. High death rates are due to poor levels of hygiene and nutrition with a high incidence of disease and famine UK pre 1760, Parts of Ethiopia Stage 2 This is a period of high birth rates, however the death rate has gone down to about 20/1000 infants who die. This results in a rise in population due to the fact that more infants are surviving. Reasons for which more people may be surviving may be better health care, improved sanitation such as water etc, more transport and medical care as well as inventions relating to this. In other words this stage involves a slight modernisation in health care raising people's living standards as well as there life expectancy. UK 1760-1860, Peru, Sri Lanka Stage 3 The stage in which the birth rate begins to fall whilst there is already a low death rate as well leading to a slight increase in population. The reason for the fall in births may be due to family planning, better education, lower infant mortality rate, a more industrialised way of life and the want for more material possessions as well as women being able to go out to work. In other words these countries are in the final stages of becoming like the western countries such as the states and those in Europe. UK 1880-1940, China, Cuba, Australia Stage 4 This is the one at which Switzerland is. There is a stable population without much change because both the death and birth rate are low and in some cases there are more deaths than births therefore leading to a possible stage five. UK post 1940, Japan, USA Stage 5 A country such as Sweden is currently entering into the negative growth rate meaning that there are less births than deaths so that the country's population size is decreasing leading to problems. The fall in birth rate may be due to the increasing emancipation and financial independence of women. As well as single sex relationships and the present economic problem within the UK where financial concerns may lead to a lack of children. The ageing population may increase the death rate. Countries such as Romania also are experiencing a falling population with birth rates at10.7 births/1,000 population and death rates at 11.77 deaths/1,000 population. The Total fertility rate is 1.35 children born/woman with an net migration rate of -0.13 migrant(s)/1,000 population. This all equates to a loss of nearly a million people in the last 20 years. Hungary since 1995
- 3. Several countries have tried to force the natural rate of change by initiating policies to reduce birth rates. E.g. China and Malaysia Criticisms of the DTM Strengths include: • The model is Eurocentric, and assumes that all countries will pass through the same stages. Some LEDCs appear to skip stages, e.g. China’s one child policy implemented in 1980 resulted in a rapidly declining birth rate. • It does not take migration into account as a component of population growth/decline. Some LEDCs appear to be stuck in stage 2. Their death rates have fallen, but their birth rates remainhigh, due to cultural or religious reasons. • The relationship between population growth and economic development, seen in MEDCs, has been much more tenuous in the LEDW. • Some countries in the LEDW had a much larger base population than those in Europe at the start of the transition, so the impact of population growth during stage 2 and early part of stage 3 has been far greater. • Model irons out major fluctuations caused by naturaldisasters, wars etc. • Originally no fifth stage in the model • It does not take in the recent phenomena such as AIDS. With 2/3 of the children of sub Saharan African countries are projected to have HIV infection by the time they have reached age 50, the impact of their demographic development is obvious; • It does not consider the positive and indeed negative roles that governments may play; • Or the role of migration On the positive side: • it is easy to understand and countries can be compared; • it can be applied globally to all countries; • it provides a starter for all demographic studies • The model provides a useful generalisation of population change over time. • It can be used to compare rates of growth between different countries at a given point in time. • Can be a useful predictive tool, so that future changes can be forecasted. • It can be used to estimate population structure. In comparison with MEDCs, LEDCs generally: • had a higher birth rate in the first two stages; • had a much stepper fall in the death rate; • start with a larger population; • see a steep fall in fertility in stage 3; • see governments playing a more significant role in population management, as opposed to the economics of the country.