Leveraged loan market analysis (US) - October 2011
•
0 j'aime•272 vues

The US leveraged loan market caught a bid in November, though the market remains focused on developments abroad - specifically Italy and eurozone. Connect with LCD Facebook: http://www.lcdcomps.com/facebook Like LCD on Facebook for monthly analysis on LBO/Private equity stats, as well as Default/Restructuring analysis. LinkedIn: http://www.lcdcomps.com/linkedin There's some 6,300 market contacts in LCD's Leveraged Loan Group Twitter: http://www.twitter.com/lcdnews News, commentary, other leveraged finance info Web: http://www.lcdcomps.com

Recommandé
Recommandé
Contenu connexe
Tendances
En vedette
En vedette (8)
Similaire à Leveraged loan market analysis (US) - October 2011
Similaire à Leveraged loan market analysis (US) - October 2011 (20)
Plus de Leveraged Commentary & Data
Plus de Leveraged Commentary & Data (10)
Dernier
Dernier (20)
Leveraged loan market analysis (US) - October 2011
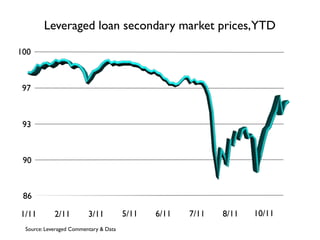
- 1. Leveraged loan secondary market prices,YTD 100 97 93 90 86 1/11 2/11 3/11 5/11 6/11 7/11 8/11 10/11 Source: Leveraged Commentary & Data
- 2. Leveraged loan returns vs. high yield bonds, equities 10% S&P/LSTA Index S&P 500 ML High Yield (H0A0) 4% -2% -8% 1/11 2/11 3/11 4/11 5/11 6/11 7/11 8/11 9/11 10/11 Source: Leveraged Commentary & Data
- 3. Change in loan outstandings vs. loan fund inflows, CLO issuance 15 Change in outstandings CLO Issuance/Prime Fund Inflows 11 8 4 0 (4) (8) (11) 1/11 3/11 5/11 7/11 9/11 10/11 Source: Leveraged Commentary & Data
- 4. Average yield, new-issue leveraged loans (%) 8.50 7.38 6.25 5.13 4.00 6/10 9/10 12/10 3/11 6/11 9/11 Source: Leveraged Commentary & Data
- 5. Forward calendar: M&A loans in the pipeline ($bils) 25 19 13 6 0 1/11 2/11 3/11 4/11 5/11 6/11 7/11 8/11 9/11 10/11 Source: Leveraged Commentary & Data
- 6. Default rate for leveraged loan issuers (%) 4.0 3.0 2.0 1.0 0 9/10 11/10 1/11 3/11 5/11 7/11 8/11 Source: Leveraged Commentary & Data
- 7. • CLO Where opens, slightly And what’s ahead? window are we now? • CLO window opens, slightly • 4 such deals recently: Credit Suisse Asset Mgmt Sankaty Guggenheim Welsh Carson Fraser Sullivan • Fourth-quarter new issues? Cupboard is bare • First-quarter 2012? Maybe some pickup • It’s all about Europe Source: Leveraged Commentary & Data
- 8. Copyright 2011 Standard & Poor's, a division of The McGraw-Hill Companies, Inc. No content (including ratings, credit-related analyses and data, model, software or other application or output therefrom) or any part thereof (Content) may be modified, reverse engineered, reproduced or distributed in any form by any means, or stored in a database or retrieval system, without the prior written permission of S&P. The Content shall not be used for any unlawful or unauthorized purposes. S&P, its affiliates, and any third party providers, as well as their directors, officers, shareholders, employees or agents (collectively S&P Parties) do not guarantee the accuracy, completeness, timeliness or availability of the Content. S&P Parties are not responsible for any errors or omissions, regardless of the cause, for the results obtained from the use of the Content, or for the security or maintenance of any data input by the user. The Content is provided on an "as is" basis. S&P PARTIES DISCLAIM ANY AND ALL EXPRESS OR IMPLIED WARRANTIES, INCLUDING, BUT NOT LIMITED TO, ANY WARRANTIES OF MERCHANTABILITY OR FITNESS FOR A PARTICULAR PURPOSE OR USE, FREEDOM FROM BUGS, SOFTWARE ERRORS OR DEFECTS, THAT THE CONTENT’S FUNCTIONING WILL BE UNINTERRUPTED OR THAT THE CONTENT WILL OPERATE WITH ANY SOFTWARE OR HARDWARE CONFIGURATION. In no event shall S&P Parties be liable to any party for any direct, indirect, incidental, exemplary, compensatory, punitive, special or consequential damages, costs, expenses, legal fees, or losses (including, without limitation, lost income or lost profits and opportunity costs) in connection with any use of the Content even if advised of the possibility of such damages. Credit-related analyses, including ratings, and statements in the Content are statements of opinion as of the date they are expressed and not statements of fact or recommendations to purchase, hold, or sell any securities or to make any investment decisions. S&P assumes no obligation to update the Content following publication in any form or format. The Content should not be relied on and is not a substitute for the skill, judgment and experience of the user, its management, employees, advisors and/or clients when making investment and other business decisions. S&P’s opinions and analyses do not address the suitability of any security. S&P does not act as a fiduciary or an investment advisor. While S&P has obtained information from sources it believes to be reliable, S&P does not perform an audit and undertakes no duty of due diligence or independent verification of any information it receives. S&P keeps certain activities of its business units separate from each other in order to preserve the independence and objectivity of their respective activities. As a result, certain business units of S&P may have information that is not available to other S&P business units. S&P has established policies and procedures to maintain the confidentiality of certain non-public information received in connection with each analytical process. S&P may receive compensation for its ratings and certain credit-related analyses, normally from issuers or underwriters of securities or from obligors. S&P reserves the right to disseminate its opinions and analyses. S&P's public ratings and analyses are made available on its Web sites, www.standardandpoors.com (free of charge), and www.ratingsdirect.com and www.globalcreditportal.com (subscription), and may be distributed through other means, including via S&P publications and third party redistributors. Additional information about our ratings fees is available at www.standardandpoors.com/usratingsfees.
Notes de l'éditeur
- This chart shows the average price of LCD’s flow name composite, a measure of the 15 largest, most liquid loans. As the big V to the right makes clear, The market has largely clawed back the devastating losses of late 08/early 09. In recent months it has stabilized, mostly moving sideways. Rather than responding to overall market conditions, names responded to earnings news and sector trends \n
- This chart shows the average price of LCD’s flow name composite, a measure of the 15 largest, most liquid loans. As the big V to the right makes clear, The market has largely clawed back the devastating losses of late 08/early 09. In recent months it has stabilized, mostly moving sideways. Rather than responding to overall market conditions, names responded to earnings news and sector trends \n
- \n
- \n
- \n
- Now we turn to market technicals. This first slide illustrates new-issue volume. As impressive as the increases have been in recent months, for loan accounts, it’s been a case of water water everywhere and not a drop to drink. The primary has been activity, but the vast majority of deal flow has been for refi’s, recaps and exits. True new-issue volume from M&A trades has been in short supply. Which brings us to the chart to the right, which displays the amount of institutional term loans outstanding over time. With repayments persisting at strong rates, the universe of loan paper continues to shrink, by about 2% YTD after an 11% decline in 2009. This inventory squeeze continues to underpin secondary price levels and whet demand for new-issue paper.\n
- Now we turn to market technicals. This first slide illustrates new-issue volume. As impressive as the increases have been in recent months, for loan accounts, it’s been a case of water water everywhere and not a drop to drink. The primary has been activity, but the vast majority of deal flow has been for refi’s, recaps and exits. True new-issue volume from M&A trades has been in short supply. Which brings us to the chart to the right, which displays the amount of institutional term loans outstanding over time. With repayments persisting at strong rates, the universe of loan paper continues to shrink, by about 2% YTD after an 11% decline in 2009. This inventory squeeze continues to underpin secondary price levels and whet demand for new-issue paper.\n
- Now we turn to market technicals. This first slide illustrates new-issue volume. As impressive as the increases have been in recent months, for loan accounts, it’s been a case of water water everywhere and not a drop to drink. The primary has been activity, but the vast majority of deal flow has been for refi’s, recaps and exits. True new-issue volume from M&A trades has been in short supply. Which brings us to the chart to the right, which displays the amount of institutional term loans outstanding over time. With repayments persisting at strong rates, the universe of loan paper continues to shrink, by about 2% YTD after an 11% decline in 2009. This inventory squeeze continues to underpin secondary price levels and whet demand for new-issue paper.\n
- This chart shows the average price of LCD’s flow name composite, a measure of the 15 largest, most liquid loans. As the big V to the right makes clear, The market has largely clawed back the devastating losses of late 08/early 09. In recent months it has stabilized, mostly moving sideways. Rather than responding to overall market conditions, names responded to earnings news and sector trends \n
- This chart shows the average price of LCD’s flow name composite, a measure of the 15 largest, most liquid loans. As the big V to the right makes clear, The market has largely clawed back the devastating losses of late 08/early 09. In recent months it has stabilized, mostly moving sideways. Rather than responding to overall market conditions, names responded to earnings news and sector trends \n
- This chart shows the monthly return of the S&P/LSTA index, a broad measure of loan market returns that we calculate in partnership with the Loan Syndications and Trading Association. The main point here is that the loan market managed to eke out a gain in February. The S&P/LSTA index was up .28%, bringing the YTD gain to 2.32%. The loan market has now posted 14 straight monthly advances. Over that period is it up a whopping 55%. \n
- This chart shows the monthly return of the S&P/LSTA index, a broad measure of loan market returns that we calculate in partnership with the Loan Syndications and Trading Association. The main point here is that the loan market managed to eke out a gain in February. The S&P/LSTA index was up .28%, bringing the YTD gain to 2.32%. The loan market has now posted 14 straight monthly advances. Over that period is it up a whopping 55%. \n
- It’s not just supportive technicals that have underpinned the loan market. Fundamentals have also been improving. This chart gives a classic view of the loan market’s default rate. It does so by dividing the amount of defaults in any given 12 month period by the amount outstanding at the period began, to give a trend line. After an unprecedented rise in 2009, default rates have started to recede. The reason is threefold. First, many of the weakest issuers in the most troubled sectors have already been claimed by bankruptcy. Second, nearly 2 in 5 issuers have executed a kick-the-can down the road transaction via A2E, bond-for-loan takeout or cov relief. Third, there’s been significant earnings improvement. Among S&P/LSTA issuers that have filed so far, EBITDA was up 10% on average in the Q4\n
- It’s not just supportive technicals that have underpinned the loan market. Fundamentals have also been improving. This chart gives a classic view of the loan market’s default rate. It does so by dividing the amount of defaults in any given 12 month period by the amount outstanding at the period began, to give a trend line. After an unprecedented rise in 2009, default rates have started to recede. The reason is threefold. First, many of the weakest issuers in the most troubled sectors have already been claimed by bankruptcy. Second, nearly 2 in 5 issuers have executed a kick-the-can down the road transaction via A2E, bond-for-loan takeout or cov relief. Third, there’s been significant earnings improvement. Among S&P/LSTA issuers that have filed so far, EBITDA was up 10% on average in the Q4\n
- It’s not just supportive technicals that have underpinned the loan market. Fundamentals have also been improving. This chart gives a classic view of the loan market’s default rate. It does so by dividing the amount of defaults in any given 12 month period by the amount outstanding at the period began, to give a trend line. After an unprecedented rise in 2009, default rates have started to recede. The reason is threefold. First, many of the weakest issuers in the most troubled sectors have already been claimed by bankruptcy. Second, nearly 2 in 5 issuers have executed a kick-the-can down the road transaction via A2E, bond-for-loan takeout or cov relief. Third, there’s been significant earnings improvement. Among S&P/LSTA issuers that have filed so far, EBITDA was up 10% on average in the Q4\n
- To wrap up then, some final points\n\nFirst, the demand for loans remains muscular as a result on high repayment rates and inflows into the loan funds\n\nSecond, The calendar of true new-issue volume remains weak \n\nThird, PE firms and issuers are focused on financial engineering deals\n\nFourth, issuers continue to create financial flexibility through A2E’s and bond take outs\n\nAnd, finally, most participants expect default rates to drop into the middle single digits by yearend. And, indeed, the market is now pricing in a default rate of about 5.5%, right in line with consensus expectations.\n
- To wrap up then, some final points\n\nFirst, the demand for loans remains muscular as a result on high repayment rates and inflows into the loan funds\n\nSecond, The calendar of true new-issue volume remains weak \n\nThird, PE firms and issuers are focused on financial engineering deals\n\nFourth, issuers continue to create financial flexibility through A2E’s and bond take outs\n\nAnd, finally, most participants expect default rates to drop into the middle single digits by yearend. And, indeed, the market is now pricing in a default rate of about 5.5%, right in line with consensus expectations.\n
- To wrap up then, some final points\n\nFirst, the demand for loans remains muscular as a result on high repayment rates and inflows into the loan funds\n\nSecond, The calendar of true new-issue volume remains weak \n\nThird, PE firms and issuers are focused on financial engineering deals\n\nFourth, issuers continue to create financial flexibility through A2E’s and bond take outs\n\nAnd, finally, most participants expect default rates to drop into the middle single digits by yearend. And, indeed, the market is now pricing in a default rate of about 5.5%, right in line with consensus expectations.\n
- To wrap up then, some final points\n\nFirst, the demand for loans remains muscular as a result on high repayment rates and inflows into the loan funds\n\nSecond, The calendar of true new-issue volume remains weak \n\nThird, PE firms and issuers are focused on financial engineering deals\n\nFourth, issuers continue to create financial flexibility through A2E’s and bond take outs\n\nAnd, finally, most participants expect default rates to drop into the middle single digits by yearend. And, indeed, the market is now pricing in a default rate of about 5.5%, right in line with consensus expectations.\n
- To wrap up then, some final points\n\nFirst, the demand for loans remains muscular as a result on high repayment rates and inflows into the loan funds\n\nSecond, The calendar of true new-issue volume remains weak \n\nThird, PE firms and issuers are focused on financial engineering deals\n\nFourth, issuers continue to create financial flexibility through A2E’s and bond take outs\n\nAnd, finally, most participants expect default rates to drop into the middle single digits by yearend. And, indeed, the market is now pricing in a default rate of about 5.5%, right in line with consensus expectations.\n
- To wrap up then, some final points\n\nFirst, the demand for loans remains muscular as a result on high repayment rates and inflows into the loan funds\n\nSecond, The calendar of true new-issue volume remains weak \n\nThird, PE firms and issuers are focused on financial engineering deals\n\nFourth, issuers continue to create financial flexibility through A2E’s and bond take outs\n\nAnd, finally, most participants expect default rates to drop into the middle single digits by yearend. And, indeed, the market is now pricing in a default rate of about 5.5%, right in line with consensus expectations.\n
- To wrap up then, some final points\n\nFirst, the demand for loans remains muscular as a result on high repayment rates and inflows into the loan funds\n\nSecond, The calendar of true new-issue volume remains weak \n\nThird, PE firms and issuers are focused on financial engineering deals\n\nFourth, issuers continue to create financial flexibility through A2E’s and bond take outs\n\nAnd, finally, most participants expect default rates to drop into the middle single digits by yearend. And, indeed, the market is now pricing in a default rate of about 5.5%, right in line with consensus expectations.\n
- To wrap up then, some final points\n\nFirst, the demand for loans remains muscular as a result on high repayment rates and inflows into the loan funds\n\nSecond, The calendar of true new-issue volume remains weak \n\nThird, PE firms and issuers are focused on financial engineering deals\n\nFourth, issuers continue to create financial flexibility through A2E’s and bond take outs\n\nAnd, finally, most participants expect default rates to drop into the middle single digits by yearend. And, indeed, the market is now pricing in a default rate of about 5.5%, right in line with consensus expectations.\n
- You’ve all seen this before, it’s a disclaimer that is long and quite detailed. Please read it at your leisure\n