SlideShare une entreprise Scribd logo
1  sur  44
HOW AGENCIES BUY
BROADCAST MEDIA
How CCO Digital
is stirring Up The Media Nest


 TRiPs & GRiPs
 Reach & Frequency
 Cost Per Point
 RESULTS
How Agencies Work
                           Big Dogs
THE CLIENT

 • ACCOUNT SERVICES
   • Strategic Planning
     • Creative Team
       •Media Planning
        • Media Buying
          • Production
            • Traffic

                          Worker Bees
How Broadcast Sells Agencies

How Radio sells against Radio


• Our audience is BIGGER than their audience
  • Is the right age
  • Is the right sex
• Our audience is BETTER than their audience
  • Has more money
  • Is better educated
  • Is employed
  • Has more/less kids (women, men, 55+…)
How Broadcast Sells Agencies

How Radio sells against Other Media
• Live, Compelling & Relevant Content
• Closest to Purchase
• Mobile Audience
• In-Office Listening (water-cooler talk)
• Listening when your store is open
• Targeted audiences: Quantitative/Qualitative
    • Demographics/Lifestyles
• Creativity, Flexibility & Fast Production Turnaround
• Live Appearances/Remote Broadcasts
• Personality Endorsements
• Contests & Promotions
How Radio Works   Coverage Maps
DFW Digital vs Broadcast Coverage
• The Case for Fixed Digital Networks


• It’s about reaching people where they live, work & play!
DFW Digital TOTAL Broadcast Coverage


  We Reach People Where They Live, Work & Play!
Ratings 101
ARBITRON :: Portable People Meter :: PPM
Listener ratings provided:
Cume - the cumulative number of unique listeners over a
 period.
Average Quarter Hour (AQH Share) - the average number of
 people listening in a given 15-minute period
Time Spent Listening (TSL)
Market breakdowns by age, gender, and race/ethnicity.
* The Cume only counts a listener once
* The AQH is a product of “Cume" and Time Spent Listening.
  • For example, if you looked into a room and saw Fred and Jane, then
   15 minutes later saw Fred with Sara.
    • The Cume would be 3 (Fred, Jane, Sara)
    • The AQH would be 2 (an average of 2 people in a 15-minute period).
Ratings 101
ARBITRON :: Portable People Meter :: PPM


                                Equal to one
                                meter for every
                                3,541 people!

                                or 1 : .00028
Coverage Comparison
• Their Weekly Audience and Reach

                                            Dallas-Ft. Worth, TX Rank: 5

  6+ Population: 5,301,200
  Ethnic Composition: Black - 15.72% Hispanic - 26%
   Station    Format                        Owner/LMA                      12-Jul   12-Aug   12-Sep     Cume
  KHKS     CHR            Clear Channel Media & Entertainment               8.1      7.3      6.9      1,795,400
  KLTY     C. Christian   Salem Communications Corp.                        5.1      6.3      6.2        910,800
  KPLX     Country        Cumulus Media, Inc.                               5.2      4.9      5.4      1,260,100
  KDMX     Hot AC         Clear Channel Media & Entertainment               3.9      4.0      4.4      1,534,700
  KZPS     Classic Rock Clear Channel Media & Entertainment                 4.5      4.8      4.3      1,050,800
  KLNO     Reg'l Mex.     Univision/Broadcasting Media Partners             3.9      4.2      4.0        638,100
  KLUV     Classic Hits   CBS Radio, Inc.                                   4.6      4.4      3.9      1,092,400
  KSCS     Country        Cumulus Media, Inc.                               3.9      3.9      3.9        912,600
  KKDA-F   Urban          Service Broadcasting Corp.                        4.0      3.3      3.6        981,200
  KJKK     Adult Hits     CBS Radio, Inc.                                   3.2      3.3      3.2      1,030,800


  Next Release: 10/29/2012
  Market Swept: 13x/year

 Totals are Persons 6+, Mon-Sun, 6am-midnight
 This profile contains a quarter hour share (AQH) rating -- the average number of persons, ages 6+, who listened
 during any average quarter hour from 6am to midnight, Monday through Sunday in the Metro Survey Area.
Coverage Comparison
• Our Weekly Reach
 Plan 1 - Two Step
 Weeks     Plant           Location           Cross Artery   Direction    Plan    Weekly    Plan    Plan    Target In-     Weekly       Total
                                                                                                                                      Target EOI
          Unit ID                                             Facing      TRP      TRP     Reach    Avg     Market EOI      Total
                                                                                            (%)     Freq                  A18+ EOI
    4     078549    STEMMONS FRWY           INWOOD RD           E         74.8     18.7     12.9     5.8      3,941,528     986,885       3,947,540

    4     078723    LBJ FRWY                DENTON DR           E          69      17.2     12.4     5.6      3,636,797     912,813       3,651,252

    4     001725    Central Expwy           Spring Valley       N         54.7     13.7     9.2      5.9      2,885,934     730,523       2,922,092

    4     003856    THORNTON FRWY           JIM MILLER RD       E         43.6     10.9     7.8      5.6      2,297,381     574,720       2,298,878

    4     001253    I-45                    RL THORNTON         S         39.5      9.9     6.3      6.3      2,079,717     520,090       2,080,360

    4     078686    WALTON WALKER           AIRPORT FRWY        S         37.1      9.3     6.1      6.1      1,956,538     489,996       1,959,984

    4     078605    AIRPORT FRWY            COUNTY LINE RD      E         35.6      8.9      7        5       1,874,768     468,692       1,874,768

    4     001054    HWY 360                 I-20                S         34.2      8.5     6.3      5.4      1,800,144     451,964       1,807,856

    4     002936    LOOP 820 SE             WICHITA ST          W         33.4      8.4     6.4      5.2      1,761,286     449,438       1,797,752

    4     006041    TOM LANDRY HWY          WESTMORELAND        W         24.1      6        5       4.9      1,272,588     318,147       1,272,588

    4     006448    South Frwy              Hargrove Ln         S         22.9      5.7      4       5.7      1,207,652     301,913       1,207,652

    4     006570    LBJ FRWY                MILLER RD           W         21.3      5.3     5.6      3.8      1,123,664     280,916       1,123,664

    4     045193    HWY 67                  MAIN ST             S         10.8      2.7     2.5      4.3        569,408     142,352        569,408

    4     078073    I-35W                   FM 407              S          8.2      2.1     1.7       5         434,288     108,572        434,288

    4     045276    HWY 380                 FM 423              W          6.1      1.5      1       6.4        323,270      82,836        331,344

    4     078709    FM 423                  WITT RD             N          4        1       0.7      5.8        208,653      52,332        209,328

    4                                                                    519.3    129.8     59.7     8.7     27,373,616   6,872,189      27,488,753


                                                                         Total  $49,280      Half $24,640
 Target Population: 5,271,248                                            Weekly $12,320     Half   $6,160
 Market: Dallas-Ft. Worth, TX (DMA), Target: All                         Daily   $1,760      Half    $880
 Telmar Outdoor Planning System, Version 2.2.1.4                         How much radio could you buy each week for $12,320 or $61600?
Media Planning 101   SQAD:
                     The go-to CPP source for
                     Agency planners & buyers
Media Planning 101
Media Planning 101
A Typical
Agency/Buyer
  “Avail”
    or
   RFP

The Station’s Goals:
•   SHARE
•   RATE
•   CPP
•   Clear Spots
     • Clear Bumps
Metrics for Success
Competitive? Radio: 21%
                                                        LOCAL RADIO          NEWSPAPERS                                          US INTERNET-
           BRAND                   TOTAL DOLS              DOLS                 DOLS         OUTDOOR DOLS     SPOT TV DOLS      DISPLAY DOLS
Q2_2012 TOTAL                  $     352,678,612    $       73,609,395   $      126,596,009 $    29,752,502 $     117,275,607   $     5,445,129
                                                                  21%                  36%               8%              33%                2%
Tom Thumb Food Store           $        1,587,217   $          919,985   $          214,583                  $        452,649
Pepsi                          $          943,451   $          851,841   $           41,976                  $         49,580   $           54
Kroger Food Stores             $        2,588,458   $          785,565   $          530,038 $        197,228 $      1,071,089   $        4,538
Sleep Experts Store            $        1,484,164   $         782,357                       $         19,296 $        669,606   $       12,905
Verizon Wireless               $        1,644,799   $          773,035   $          189,000 $        254,047 $        383,968   $       44,749
BOOTHE EYE CARE&LSR CTR        $          767,997   $         767,997
AT&T                           $        1,337,241   $          750,369   $         124,391   $        2,309   $      405,838    $       54,334
Toyota Full Line               $          797,748   $          717,490                       $       80,254                     $            4
Charter Communications Cable   $        1,104,331   $          702,083                       $       13,500   $      388,498    $          250
Six Flags Theme Parks          $        1,084,144   $         648,128                                         $      435,319    $          697
Anheuser-Busch                 $          678,029   $          638,891                       $       39,138
Geico                          $        1,519,861   $          616,191                       $      398,127   $      505,106    $          437
T-Mobile Wireless Store        $          582,373   $          581,078                                        $        1,295
Walmart                        $        1,870,415   $          573,761   $         858,704   $       58,470   $      345,110    $       34,370
Mattress Firm Store            $        1,560,407   $          567,974   $         380,876                    $      579,870    $       31,687
Subway                         $        1,064,096   $         548,609                        $       85,321   $      429,688    $          478
McDonalds                      $        1,948,059   $          518,693   $           2,444   $      706,615   $      699,116    $       21,190
Office Depot Office Supply     $        1,190,424   $          472,530   $         227,584                    $      489,965    $          345
Coca-Cola                      $          659,700   $          468,876                       $      190,791                     $           33
Reliant Energy                 $        1,549,074   $          467,620   $          31,828   $       94,088   $      898,437    $       57,102
Albertsons Food Store          $          824,467   $          454,055   $         365,422                    $        1,344    $        3,646
MillerCoors                    $          570,974   $          441,752                       $      129,222
Competitive? TV: 33%
                                                      LOCAL RADIO          NEWSPAPERS                                              US INTERNET-
           BRAND                  TOTAL DOLS             DOLS                 DOLS        OUTDOOR DOLS       SPOT TV DOLS          DISPLAY DOLS
                              $                                                          $
Q2_2012 TOTAL                 352,678,612         $       73,609,395   $     126,596,009 29,752,502        $     117,275,607   $        5,445,129
                                                                21%                 36%                 8%              33%                   2%
Pol-US Senate                 $       5,103,241   $         257,235                                        $       4,846,006
Time Warner Cable             $       4,385,894   $         301,099    $         127,711 $           9,100 $       3,903,900   $          44,083
PoL-Congress                  $       3,308,889   $         394,102    $          10,332 $        186,591 $        2,717,863   $               1
Rooms To Go Furniture Store   $       5,413,862   $         223,807    $       2,644,049                   $       2,545,579   $             427
AT&T U-verse                  $       2,412,795                                                            $       2,410,301   $           2,494
Chevrolet Silverado           $       1,473,039                                                            $       1,471,638   $           1,401
Sonic                         $       1,642,748   $         433,936                      $           2,190 $       1,206,506   $             115
Ford F-Series                 $       1,090,515                                                            $       1,090,495   $              20
Kroger Food Stores            $       2,588,458   $         785,565 $            530,038 $        197,228 $        1,071,089   $           4,538
Toyota Camry                  $       1,039,119                                                            $       1,038,777   $             342
                                                                                                           $
Jim S Adler Attorney          $       1,006,017                                                            1,006,017
Toyota Tundra                 $        968,005                                                             $         967,881   $             124
TXU Energy                    $       1,623,535   $         433,452 $             23,199 $        203,553 $          963,330
Nissan Altima                 $        957,666                                                             $         956,877   $             789
Ford Focus                    $        951,219                                                             $         950,148   $           1,071
Jack In The Box               $       1,107,715   $          56,405                      $        121,963 $          929,332   $              15
Reliant Energy                $       1,549,074   $         467,620 $             31,828 $          94,088 $         898,437   $          57,102
Empire Today Home Services    $        848,753                                                             $         848,753
Volkswagen Jetta              $        785,979                                                             $         785,711   $            268
Chase Bank                    $        996,551                         $         197,082 $          26,563 $         761,062   $          11,844
Honda Accord                  $        760,949                                                             $         760,865   $              84
Whataburger                   $       1,234,931   $         228,203                      $        245,587 $          760,261   $            880
Competitive? Newspaper: 36%?
                                                      LOCAL RADIO        NEWSPAPERS                                               US INTERNET-
           BRAND                  TOTAL DOLS             DOLS               DOLS         OUTDOOR DOLS          SPOT TV DOLS       DISPLAY DOLS
                              $                                                         $
Q2_2012 TOTAL                 352,678,612         $       73,609,395 $     126,596,009 29,752,502          $      117,275,607 $        5,445,129
                                                                21%                36%               8%                  33%                 2%
Frys Electronics Store        $       5,824,748                      $        5,824,297                                       $             451
News America FSI              $       3,650,127                      $        3,650,127
Dir                           $       3,639,007                      $        3,639,007
Valassis Coupons              $       3,001,486                      $        3,001,486
Rooms To Go Furniture Store   $       5,413,862   $         223,807 $         2,644,049                    $        2,545,579 $             427
Sears                         $       2,153,802   $         238,484 $         1,903,877                    $           2,095 $            9,346
Bankrate.com                  $       1,761,349                      $        1,761,349
Target                        $       1,773,481   $           28,775 $        1,660,934 $         77,681   $             381 $            5,710
Macys                         $       1,789,878   $           63,956 $        1,642,050                    $          81,645 $            2,227
Best Buy Electronics Store    $       1,501,239   $             975 $         1,494,184                    $             342 $            5,738
Plant Shed Nursery            $       1,444,178                      $       1,442,063                                       $            2,115
Ashley Furniture Home Store   $       1,789,914                      $        1,427,435 $         27,060   $         335,251 $              168
Kohls                         $       1,744,438   $         147,597 $         1,378,432                    $         205,946 $           12,463
Classic Chevrolet             $       1,409,795   $         154,065 $        1,252,826                     $           2,904
Dillards                      $       1,207,512   $           27,405 $        1,178,835                                      $            1,272
HP                            $       1,206,642   $           27,270 $        1,167,425 $         11,875                     $               72
Bank Of America               $       1,613,735   $           15,000 $        1,123,920                    $         404,791 $           70,024
T-Mobile Wireless             $       1,184,083                      $        1,097,738                    $          82,915 $            3,431
Cars.com                      $       1,016,749   $           25,465 $         990,797                                       $              487
Classic Auto Dealer           $        907,052    $           24,179 $         882,873
Sprint Wireless               $        930,732                       $         881,370                     $          27,198 $           22,164
Walmart                       $       1,870,415   $         573,761 $          858,704 $          58,470   $         345,110 $           34,370
If you don’t ask, you don’t get.
Metrics for Success
• Rating Points? Reach? Frequency?   Monday Morning Memo
                                         Roy Williams
                                      The Wizard of Ads
Do the Math
Metrics for Success
• Rating Points? Reach? Frequency?

Who Is Your Customer? Media Buying Lesson Number One

I’ve never seen a business fail because they were reaching the wrong customer. But I’ve
seen hundreds fail because they were saying the wrong things.
Most ads answer questions no one was asking.
How did we Americans become so fixated on “targeting the right customer” in our
advertising?
That question has two answers. The first is, “because it’s completely logical” and our
natural inclination is to follow the footsteps of lovely Logic, even when she leads us to
erroneous conclusions.
The second reason we’re fixated on targeting the right customer is, in two words,
“advertising salespeople.”

The Wizard of Ads – Roy Williams
Metrics for Success
• Rating Points? Reach? Frequency?

 Question:
 Has anyone done a one-week, let alone one month campaign
 where are we are directly connected to measureable results?
 (i.e., a product or service only advertised on our displays or a
 special landing page for the digital campaign.)

 CCO:
 We’ve seen advertisers gather measurable results from a one-
 week campaign, it was always because they had done a huge
 volume of coverage during that short term run … tipping the
 scales at 14, 28 or more digital billboard locations. Seen this
 move the needle on event promotions, major grocery retail
 pricing responses…
Measurements for Success
Metrics for Success
• Rating Points? Reach? Frequency?

 Question:
 What’s a recommended buy?

 CCO:
 One network (14 locations) or two networks (28
 locations) or other large-scale programs generate
 the best ROI… We have had several clients with
 success using these levels of coverage
Measurements for Success
Metrics for Success
• Rating Points? Reach? Frequency?

 Question:
 What Works? TRP levels? Reach levels? Frequency
 levels? (or do we just make this stuff up?)

 CCO:
 Our networks range in the following per 4-week
 period
 • Reach 40% – 50%
 • Frequency 13x – 15x
 • TRP 580 – 680
 • Impressions 24 million - 28 million
Measurements for Success
Presentation 101
• Media Comparison
• Media Mix
• Getting our fair share…And more!

• START Selling in Days/Weeks!

• STOP Selling in Periods!
28 Days


BULLETINS
DIGITAL
28 Hours!
Presentation 101   Ask For Our Fair Share
Eyes On Media Comparison
    Market: Dallas/Ft Worth                                   Target: Adults 18+                                 Duration: 4 weeks                              Budget: $24,600

                                                                          Avg                                             Gross Imp                             CPP                     CPM
    Media/Units                                Reach                                              TRPs
                                                                          Freq                                             and EOI

    Newspaper
    2 quarter page ads                           19.7%                      1.6x                       32                    1.5 million                        $750                   $15.84


     Television
     16 30-sec spots                              27.0%                      1.5x                      41                    2.1 million                        $611                   $11.69
     5 day parts

     Radio
     180 60-sec spots                             37.5%                      2.3x                      86                    4.1 million                        $286                     $6.05
     M-F 6am - Midnight

     Outdoor
     6 Digital Billboards                         23.8%                     5.6x                      134                    6.8 million                        $183                     $3.60
     Network 1

    Disclaimer: Be advised that the EOI reported for digital billboards represent the complete EOI for the locations. They are not adjusted to account for the number of messages displayed.


Sources: Telmar Outdoor Planning System for TAB 2.0; Media Market Guide; Scarborough; Telmar MediaPlanner &
TV Plan Systems
Disclaimer: EOI reported for digital billboards represent the complete EOI for the locations, unadjusted
to account for the number of messages displayed.
Cost Efficiency Comparison
Cost Per Thousand by Media
Market: Dallas/Ft Worth                Target: Adults 18+               Duration: 4 weeks   Budget: $24,600


 $20
                                                                                            Newspaper
                                                                                            2 quarter page ads
                                                                                            in Dallas Morning News
               $15.84
                                                                                            Television
                                                                                            16 30-sec spots
                                  $11.69
                                                                                            5 day parts
$10

                                                                                            Radio
                                                      $6.05                                 180 60-sec spots (top 5 stations)
                                                                         $3.60              M-F 6am - Midnight

                                                                                            Outdoor
                                                                                            6 Digital Billboards
                                                                                            Network 1
           Newspaper                 TV                Radio               DOOH


Sources: Telmar Outdoor Planning System for TAB 2.0; Media Market Guide; Scarborough;
Telmar MediaPlanner & TV Plan Systems
Disclaimer: EOI reported for digital billboards represent the complete EOI for the
locations, unadjusted to account for the number of messages displayed.
Presentation 101
• Media Comparison
• Media Mix
• Getting our fair share…And more!

  Effective      Reach & Frequency
  Efficient      CPP/CPM
  Immediate      Speed of Light (faster than sound)
  Creative       Speed & Accuracy
  Flexible       Day-parting/Week-parting
  Interactive    Social – FFL (fans for life)
  Dynamic        Live Content – Connected
Creative 101


It’s not about Geography anymore…
It’s about people searching for & finding you.


It’s
Google-ography!
Creative 101
“Begin with the End in Mind”    :: Stephen Covey

•   Who?
•   What?
•   When?
•   Where?

       Who? Name/Logo
    What? When? Where: URL
With only 8 seconds of windshield “screen” time:
        Use the website for the details!
        Mobile & Tablet websites are different.
NEXT STEP:         Let’s Get Going!
     “We Help Our Clients…”
     THE CLIENT
       • ACCOUNT SERVICES
        • Strategic Planning
          • Creative Team
            • Media Planning
              • Media Buying
                • Production
                  • Traffic
THANK YOU!
• Questions?
Additionally…
• Our Digital build-out is nearly completed for the DFW market.
• As a result we are now able to offer an audience based
  platform for this product, much like radio or other broadcast.
• While we are making the transition to this platform of set
  audience levels, we value your business and know that this is a
  product that is working for you as you are currently doing it.
• Because of that, we are happy to secure the following spots for
  you out of network and at a premium rate card price of $5,000
  each location, you are still getting great value for these two
  locations!

                             - DS -
Additionally…
How do we talk to a local agency about our local strategy, and that carry over to
other markets that offer Digital?

Since this will come up with many multi-market advertisers – this is good question.
I would simply get my spiel down from the very beginning of the conversation….

With the Dallas digital footprint one of the largest in the country, we are able to offer
full market distribution in terms of audience measurement, much like your broadcast
(radio/TV) can deliver. In many of our other markets, digital still needs to be utilized
for your call to action campaigns and as a supplemental program for your traditional
message – the measurement and distribution levels will just be a little smaller in
nature while they are still building their footprint out.

That’s pretty much it – your recommendations are based on the clients needs with
every campaign – and there isn’t much discussion involved with “why Dallas does
this” or why “Ft. Smith does that” – your recommendation as the OOH expert is still
based on the client needs along with our parameters.

                                         - DS -
Additionally…
•   Between now and the end of the year you may price as you’ve been pricing, even build virtual networks as you have been – BUT –
     you need to explain where we’re going & why. (Debra’s email yesterday included a great PURPOSE for our network structure.
•   Some locations are in High-Demand.

•   So, in 2013…
•   Yes, each location that is solo as in not sold in one of our network is $5000 per location per period (vs the $3080 local network).
•   Example: Hand-pick one location from each of the networks. 7 X $5000 = $35,000 for the period.
•
•   There are 4 networks of 16
•   Each is $16,000 per week (full spot)
•   That buys 53 minutes of radio spots compared to 18,144 minutes within our broadcast coverage.
•
•   The Business Women’s Network is 8
•   $8000 per week (full spot)
•   That buys 27 minutes of radio spots compared to 9,072 minutes within our broadcast coverage.
•
•   Denton County is 7 – not Tarrant
•   $7000 per week (full spot)
•   That buys 23 minutes of radio spots compared to 7,938 minutes within our broadcast coverage.
•
•   Tarrant County is 4 -- the one-sheet has been corrected
•   $4000 per week (full spot)
•   That buys 15 minutes of radio spots compared to 4,536 minutes within our broadcast coverage.
•
•   All the network location lists are on the common drive: Digital/Networks/EOI Reports
•
•   Change your mindset. DO NOT SELL DIGITAL IN 4-Week PERIODS….
•   Most Agency Broadcast Buyers and Direct clients buy Radio in one to two week flights spread out over a quarter to support
    their promotions and events.
•
•   Example:
•   Talk to your current clients about 12 months of static and 2 weeks of digital per month.
•   Talk to everyone else about their radio & tv campaign strategy!

Contenu connexe

Similaire à Digital ooh vs_radio_2012_$ales_training_l_bason_2012.11.05-1

Sheet1UNITED ARAB EMIRATES MOBILE DEMAND - June 2005UNITS2001A2002.docx
Sheet1UNITED ARAB EMIRATES MOBILE DEMAND - June 2005UNITS2001A2002.docxSheet1UNITED ARAB EMIRATES MOBILE DEMAND - June 2005UNITS2001A2002.docx
Sheet1UNITED ARAB EMIRATES MOBILE DEMAND - June 2005UNITS2001A2002.docxbjohn46
 
Chicago_AMERICAS_MarketBeat_Industrial_2page_Q42012
Chicago_AMERICAS_MarketBeat_Industrial_2page_Q42012Chicago_AMERICAS_MarketBeat_Industrial_2page_Q42012
Chicago_AMERICAS_MarketBeat_Industrial_2page_Q42012Carrie Haas
 
Tampa Abc stadium-options-grp-presentation-7-16-09
Tampa Abc stadium-options-grp-presentation-7-16-09Tampa Abc stadium-options-grp-presentation-7-16-09
Tampa Abc stadium-options-grp-presentation-7-16-09Buzzbomb
 
Tampa Abc stadium-options-grp-presentation-7-16-09
Tampa Abc stadium-options-grp-presentation-7-16-09Tampa Abc stadium-options-grp-presentation-7-16-09
Tampa Abc stadium-options-grp-presentation-7-16-09Buzzbomb
 
ADVERTISING BIFOLD BROCHURE-EDDIE
ADVERTISING BIFOLD BROCHURE-EDDIEADVERTISING BIFOLD BROCHURE-EDDIE
ADVERTISING BIFOLD BROCHURE-EDDIEEdward Marquie
 
CBS Media Kit 2015
CBS Media Kit 2015CBS Media Kit 2015
CBS Media Kit 2015Tara Lang
 
Lake Lanier Home Sales Analysis September 2021
Lake Lanier Home Sales Analysis September 2021Lake Lanier Home Sales Analysis September 2021
Lake Lanier Home Sales Analysis September 2021Arthur Prescott
 
Lake Lanier Home Sales Analysis November 2020
Lake Lanier Home Sales Analysis November 2020Lake Lanier Home Sales Analysis November 2020
Lake Lanier Home Sales Analysis November 2020Arthur Prescott
 
JLL Cincinnati Office Insight & Statistics - Q2 2016
JLL Cincinnati Office Insight & Statistics - Q2 2016JLL Cincinnati Office Insight & Statistics - Q2 2016
JLL Cincinnati Office Insight & Statistics - Q2 2016Ross Bratcher
 
Presentation-StepehenErickson
Presentation-StepehenEricksonPresentation-StepehenErickson
Presentation-StepehenEricksonStephen Erickson
 
Epic Strut Coverage
Epic Strut CoverageEpic Strut Coverage
Epic Strut CoverageKate McCully
 
3Q2013 Houston Land Market Report
3Q2013 Houston Land Market Report3Q2013 Houston Land Market Report
3Q2013 Houston Land Market ReportScott Davis
 
2011 09-22-0-pssh show-andtell-dougsuzibilltifpeter
2011 09-22-0-pssh show-andtell-dougsuzibilltifpeter2011 09-22-0-pssh show-andtell-dougsuzibilltifpeter
2011 09-22-0-pssh show-andtell-dougsuzibilltifpeterSuzi Wong Swint
 
Ctia Survey Midyear 2009 Graphics
Ctia Survey Midyear 2009 GraphicsCtia Survey Midyear 2009 Graphics
Ctia Survey Midyear 2009 GraphicsMarketingfacts
 
"Mission Hill Main Street Business District Market Analysis
"Mission Hill Main Street Business District Market Analysis"Mission Hill Main Street Business District Market Analysis
"Mission Hill Main Street Business District Market AnalysisSean P. Bender
 
November Market Watch 2020
November Market Watch 2020November Market Watch 2020
November Market Watch 2020Michelle Makos
 

Similaire à Digital ooh vs_radio_2012_$ales_training_l_bason_2012.11.05-1 (20)

Sheet1UNITED ARAB EMIRATES MOBILE DEMAND - June 2005UNITS2001A2002.docx
Sheet1UNITED ARAB EMIRATES MOBILE DEMAND - June 2005UNITS2001A2002.docxSheet1UNITED ARAB EMIRATES MOBILE DEMAND - June 2005UNITS2001A2002.docx
Sheet1UNITED ARAB EMIRATES MOBILE DEMAND - June 2005UNITS2001A2002.docx
 
Chicago_AMERICAS_MarketBeat_Industrial_2page_Q42012
Chicago_AMERICAS_MarketBeat_Industrial_2page_Q42012Chicago_AMERICAS_MarketBeat_Industrial_2page_Q42012
Chicago_AMERICAS_MarketBeat_Industrial_2page_Q42012
 
Tampa Abc stadium-options-grp-presentation-7-16-09
Tampa Abc stadium-options-grp-presentation-7-16-09Tampa Abc stadium-options-grp-presentation-7-16-09
Tampa Abc stadium-options-grp-presentation-7-16-09
 
Tampa Abc stadium-options-grp-presentation-7-16-09
Tampa Abc stadium-options-grp-presentation-7-16-09Tampa Abc stadium-options-grp-presentation-7-16-09
Tampa Abc stadium-options-grp-presentation-7-16-09
 
ADVERTISING BIFOLD BROCHURE-EDDIE
ADVERTISING BIFOLD BROCHURE-EDDIEADVERTISING BIFOLD BROCHURE-EDDIE
ADVERTISING BIFOLD BROCHURE-EDDIE
 
CBS Media Kit 2015
CBS Media Kit 2015CBS Media Kit 2015
CBS Media Kit 2015
 
Lake Lanier Home Sales Analysis September 2021
Lake Lanier Home Sales Analysis September 2021Lake Lanier Home Sales Analysis September 2021
Lake Lanier Home Sales Analysis September 2021
 
USF - ICC Reform Douglas Meredith
USF - ICC Reform Douglas Meredith USF - ICC Reform Douglas Meredith
USF - ICC Reform Douglas Meredith
 
May Market Watch 2021
May Market Watch 2021May Market Watch 2021
May Market Watch 2021
 
Lake Lanier Home Sales Analysis November 2020
Lake Lanier Home Sales Analysis November 2020Lake Lanier Home Sales Analysis November 2020
Lake Lanier Home Sales Analysis November 2020
 
JLL Cincinnati Office Insight & Statistics - Q2 2016
JLL Cincinnati Office Insight & Statistics - Q2 2016JLL Cincinnati Office Insight & Statistics - Q2 2016
JLL Cincinnati Office Insight & Statistics - Q2 2016
 
GMJF Social media 2011
GMJF Social media 2011GMJF Social media 2011
GMJF Social media 2011
 
Presentation-StepehenErickson
Presentation-StepehenEricksonPresentation-StepehenErickson
Presentation-StepehenErickson
 
Epic Strut Coverage
Epic Strut CoverageEpic Strut Coverage
Epic Strut Coverage
 
3Q2013 Houston Land Market Report
3Q2013 Houston Land Market Report3Q2013 Houston Land Market Report
3Q2013 Houston Land Market Report
 
2011 09-22-0-pssh show-andtell-dougsuzibilltifpeter
2011 09-22-0-pssh show-andtell-dougsuzibilltifpeter2011 09-22-0-pssh show-andtell-dougsuzibilltifpeter
2011 09-22-0-pssh show-andtell-dougsuzibilltifpeter
 
Ctia Survey Midyear 2009 Graphics
Ctia Survey Midyear 2009 GraphicsCtia Survey Midyear 2009 Graphics
Ctia Survey Midyear 2009 Graphics
 
050608 Sales Meeting
050608 Sales Meeting050608 Sales Meeting
050608 Sales Meeting
 
"Mission Hill Main Street Business District Market Analysis
"Mission Hill Main Street Business District Market Analysis"Mission Hill Main Street Business District Market Analysis
"Mission Hill Main Street Business District Market Analysis
 
November Market Watch 2020
November Market Watch 2020November Market Watch 2020
November Market Watch 2020
 

Dernier

Islamabad Escorts | Call 03070433345 | Escort Service in Islamabad
Islamabad Escorts | Call 03070433345 | Escort Service in IslamabadIslamabad Escorts | Call 03070433345 | Escort Service in Islamabad
Islamabad Escorts | Call 03070433345 | Escort Service in IslamabadAyesha Khan
 
PSCC - Capability Statement Presentation
PSCC - Capability Statement PresentationPSCC - Capability Statement Presentation
PSCC - Capability Statement PresentationAnamaria Contreras
 
FULL ENJOY Call girls in Paharganj Delhi | 8377087607
FULL ENJOY Call girls in Paharganj Delhi | 8377087607FULL ENJOY Call girls in Paharganj Delhi | 8377087607
FULL ENJOY Call girls in Paharganj Delhi | 8377087607dollysharma2066
 
Innovation Conference 5th March 2024.pdf
Innovation Conference 5th March 2024.pdfInnovation Conference 5th March 2024.pdf
Innovation Conference 5th March 2024.pdfrichard876048
 
Future Of Sample Report 2024 | Redacted Version
Future Of Sample Report 2024 | Redacted VersionFuture Of Sample Report 2024 | Redacted Version
Future Of Sample Report 2024 | Redacted VersionMintel Group
 
2024 Numerator Consumer Study of Cannabis Usage
2024 Numerator Consumer Study of Cannabis Usage2024 Numerator Consumer Study of Cannabis Usage
2024 Numerator Consumer Study of Cannabis UsageNeil Kimberley
 
APRIL2024_UKRAINE_xml_0000000000000 .pdf
APRIL2024_UKRAINE_xml_0000000000000 .pdfAPRIL2024_UKRAINE_xml_0000000000000 .pdf
APRIL2024_UKRAINE_xml_0000000000000 .pdfRbc Rbcua
 
Independent Call Girls Andheri Nightlaila 9967584737
Independent Call Girls Andheri Nightlaila 9967584737Independent Call Girls Andheri Nightlaila 9967584737
Independent Call Girls Andheri Nightlaila 9967584737Riya Pathan
 
Pitch Deck Teardown: Geodesic.Life's $500k Pre-seed deck
Pitch Deck Teardown: Geodesic.Life's $500k Pre-seed deckPitch Deck Teardown: Geodesic.Life's $500k Pre-seed deck
Pitch Deck Teardown: Geodesic.Life's $500k Pre-seed deckHajeJanKamps
 
Contemporary Economic Issues Facing the Filipino Entrepreneur (1).pptx
Contemporary Economic Issues Facing the Filipino Entrepreneur (1).pptxContemporary Economic Issues Facing the Filipino Entrepreneur (1).pptx
Contemporary Economic Issues Facing the Filipino Entrepreneur (1).pptxMarkAnthonyAurellano
 
India Consumer 2024 Redacted Sample Report
India Consumer 2024 Redacted Sample ReportIndia Consumer 2024 Redacted Sample Report
India Consumer 2024 Redacted Sample ReportMintel Group
 
Marketplace and Quality Assurance Presentation - Vincent Chirchir
Marketplace and Quality Assurance Presentation - Vincent ChirchirMarketplace and Quality Assurance Presentation - Vincent Chirchir
Marketplace and Quality Assurance Presentation - Vincent Chirchirictsugar
 
Memorándum de Entendimiento (MoU) entre Codelco y SQM
Memorándum de Entendimiento (MoU) entre Codelco y SQMMemorándum de Entendimiento (MoU) entre Codelco y SQM
Memorándum de Entendimiento (MoU) entre Codelco y SQMVoces Mineras
 
International Business Environments and Operations 16th Global Edition test b...
International Business Environments and Operations 16th Global Edition test b...International Business Environments and Operations 16th Global Edition test b...
International Business Environments and Operations 16th Global Edition test b...ssuserf63bd7
 
Traction part 2 - EOS Model JAX Bridges.
Traction part 2 - EOS Model JAX Bridges.Traction part 2 - EOS Model JAX Bridges.
Traction part 2 - EOS Model JAX Bridges.Anamaria Contreras
 
Annual General Meeting Presentation Slides
Annual General Meeting Presentation SlidesAnnual General Meeting Presentation Slides
Annual General Meeting Presentation SlidesKeppelCorporation
 
Ms Motilal Padampat Sugar Mills vs. State of Uttar Pradesh & Ors. - A Milesto...
Ms Motilal Padampat Sugar Mills vs. State of Uttar Pradesh & Ors. - A Milesto...Ms Motilal Padampat Sugar Mills vs. State of Uttar Pradesh & Ors. - A Milesto...
Ms Motilal Padampat Sugar Mills vs. State of Uttar Pradesh & Ors. - A Milesto...ShrutiBose4
 

Dernier (20)

Islamabad Escorts | Call 03070433345 | Escort Service in Islamabad
Islamabad Escorts | Call 03070433345 | Escort Service in IslamabadIslamabad Escorts | Call 03070433345 | Escort Service in Islamabad
Islamabad Escorts | Call 03070433345 | Escort Service in Islamabad
 
Japan IT Week 2024 Brochure by 47Billion (English)
Japan IT Week 2024 Brochure by 47Billion (English)Japan IT Week 2024 Brochure by 47Billion (English)
Japan IT Week 2024 Brochure by 47Billion (English)
 
PSCC - Capability Statement Presentation
PSCC - Capability Statement PresentationPSCC - Capability Statement Presentation
PSCC - Capability Statement Presentation
 
FULL ENJOY Call girls in Paharganj Delhi | 8377087607
FULL ENJOY Call girls in Paharganj Delhi | 8377087607FULL ENJOY Call girls in Paharganj Delhi | 8377087607
FULL ENJOY Call girls in Paharganj Delhi | 8377087607
 
Innovation Conference 5th March 2024.pdf
Innovation Conference 5th March 2024.pdfInnovation Conference 5th March 2024.pdf
Innovation Conference 5th March 2024.pdf
 
Future Of Sample Report 2024 | Redacted Version
Future Of Sample Report 2024 | Redacted VersionFuture Of Sample Report 2024 | Redacted Version
Future Of Sample Report 2024 | Redacted Version
 
Corporate Profile 47Billion Information Technology
Corporate Profile 47Billion Information TechnologyCorporate Profile 47Billion Information Technology
Corporate Profile 47Billion Information Technology
 
2024 Numerator Consumer Study of Cannabis Usage
2024 Numerator Consumer Study of Cannabis Usage2024 Numerator Consumer Study of Cannabis Usage
2024 Numerator Consumer Study of Cannabis Usage
 
APRIL2024_UKRAINE_xml_0000000000000 .pdf
APRIL2024_UKRAINE_xml_0000000000000 .pdfAPRIL2024_UKRAINE_xml_0000000000000 .pdf
APRIL2024_UKRAINE_xml_0000000000000 .pdf
 
Call Us ➥9319373153▻Call Girls In North Goa
Call Us ➥9319373153▻Call Girls In North GoaCall Us ➥9319373153▻Call Girls In North Goa
Call Us ➥9319373153▻Call Girls In North Goa
 
Independent Call Girls Andheri Nightlaila 9967584737
Independent Call Girls Andheri Nightlaila 9967584737Independent Call Girls Andheri Nightlaila 9967584737
Independent Call Girls Andheri Nightlaila 9967584737
 
Pitch Deck Teardown: Geodesic.Life's $500k Pre-seed deck
Pitch Deck Teardown: Geodesic.Life's $500k Pre-seed deckPitch Deck Teardown: Geodesic.Life's $500k Pre-seed deck
Pitch Deck Teardown: Geodesic.Life's $500k Pre-seed deck
 
Contemporary Economic Issues Facing the Filipino Entrepreneur (1).pptx
Contemporary Economic Issues Facing the Filipino Entrepreneur (1).pptxContemporary Economic Issues Facing the Filipino Entrepreneur (1).pptx
Contemporary Economic Issues Facing the Filipino Entrepreneur (1).pptx
 
India Consumer 2024 Redacted Sample Report
India Consumer 2024 Redacted Sample ReportIndia Consumer 2024 Redacted Sample Report
India Consumer 2024 Redacted Sample Report
 
Marketplace and Quality Assurance Presentation - Vincent Chirchir
Marketplace and Quality Assurance Presentation - Vincent ChirchirMarketplace and Quality Assurance Presentation - Vincent Chirchir
Marketplace and Quality Assurance Presentation - Vincent Chirchir
 
Memorándum de Entendimiento (MoU) entre Codelco y SQM
Memorándum de Entendimiento (MoU) entre Codelco y SQMMemorándum de Entendimiento (MoU) entre Codelco y SQM
Memorándum de Entendimiento (MoU) entre Codelco y SQM
 
International Business Environments and Operations 16th Global Edition test b...
International Business Environments and Operations 16th Global Edition test b...International Business Environments and Operations 16th Global Edition test b...
International Business Environments and Operations 16th Global Edition test b...
 
Traction part 2 - EOS Model JAX Bridges.
Traction part 2 - EOS Model JAX Bridges.Traction part 2 - EOS Model JAX Bridges.
Traction part 2 - EOS Model JAX Bridges.
 
Annual General Meeting Presentation Slides
Annual General Meeting Presentation SlidesAnnual General Meeting Presentation Slides
Annual General Meeting Presentation Slides
 
Ms Motilal Padampat Sugar Mills vs. State of Uttar Pradesh & Ors. - A Milesto...
Ms Motilal Padampat Sugar Mills vs. State of Uttar Pradesh & Ors. - A Milesto...Ms Motilal Padampat Sugar Mills vs. State of Uttar Pradesh & Ors. - A Milesto...
Ms Motilal Padampat Sugar Mills vs. State of Uttar Pradesh & Ors. - A Milesto...
 

Digital ooh vs_radio_2012_$ales_training_l_bason_2012.11.05-1

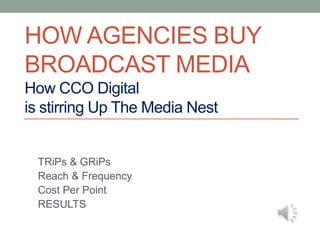
  • 1. HOW AGENCIES BUY BROADCAST MEDIA How CCO Digital is stirring Up The Media Nest TRiPs & GRiPs Reach & Frequency Cost Per Point RESULTS
  • 2. How Agencies Work Big Dogs THE CLIENT • ACCOUNT SERVICES • Strategic Planning • Creative Team •Media Planning • Media Buying • Production • Traffic Worker Bees
  • 3. How Broadcast Sells Agencies How Radio sells against Radio • Our audience is BIGGER than their audience • Is the right age • Is the right sex • Our audience is BETTER than their audience • Has more money • Is better educated • Is employed • Has more/less kids (women, men, 55+…)
  • 4. How Broadcast Sells Agencies How Radio sells against Other Media • Live, Compelling & Relevant Content • Closest to Purchase • Mobile Audience • In-Office Listening (water-cooler talk) • Listening when your store is open • Targeted audiences: Quantitative/Qualitative • Demographics/Lifestyles • Creativity, Flexibility & Fast Production Turnaround • Live Appearances/Remote Broadcasts • Personality Endorsements • Contests & Promotions
  • 5. How Radio Works Coverage Maps
  • 6.
  • 7. DFW Digital vs Broadcast Coverage • The Case for Fixed Digital Networks • It’s about reaching people where they live, work & play!
  • 8. DFW Digital TOTAL Broadcast Coverage We Reach People Where They Live, Work & Play!
  • 9. Ratings 101 ARBITRON :: Portable People Meter :: PPM Listener ratings provided: Cume - the cumulative number of unique listeners over a period. Average Quarter Hour (AQH Share) - the average number of people listening in a given 15-minute period Time Spent Listening (TSL) Market breakdowns by age, gender, and race/ethnicity. * The Cume only counts a listener once * The AQH is a product of “Cume" and Time Spent Listening. • For example, if you looked into a room and saw Fred and Jane, then 15 minutes later saw Fred with Sara. • The Cume would be 3 (Fred, Jane, Sara) • The AQH would be 2 (an average of 2 people in a 15-minute period).
  • 10. Ratings 101 ARBITRON :: Portable People Meter :: PPM Equal to one meter for every 3,541 people! or 1 : .00028
  • 11. Coverage Comparison • Their Weekly Audience and Reach Dallas-Ft. Worth, TX Rank: 5 6+ Population: 5,301,200 Ethnic Composition: Black - 15.72% Hispanic - 26% Station Format Owner/LMA 12-Jul 12-Aug 12-Sep Cume KHKS CHR Clear Channel Media & Entertainment 8.1 7.3 6.9 1,795,400 KLTY C. Christian Salem Communications Corp. 5.1 6.3 6.2 910,800 KPLX Country Cumulus Media, Inc. 5.2 4.9 5.4 1,260,100 KDMX Hot AC Clear Channel Media & Entertainment 3.9 4.0 4.4 1,534,700 KZPS Classic Rock Clear Channel Media & Entertainment 4.5 4.8 4.3 1,050,800 KLNO Reg'l Mex. Univision/Broadcasting Media Partners 3.9 4.2 4.0 638,100 KLUV Classic Hits CBS Radio, Inc. 4.6 4.4 3.9 1,092,400 KSCS Country Cumulus Media, Inc. 3.9 3.9 3.9 912,600 KKDA-F Urban Service Broadcasting Corp. 4.0 3.3 3.6 981,200 KJKK Adult Hits CBS Radio, Inc. 3.2 3.3 3.2 1,030,800 Next Release: 10/29/2012 Market Swept: 13x/year Totals are Persons 6+, Mon-Sun, 6am-midnight This profile contains a quarter hour share (AQH) rating -- the average number of persons, ages 6+, who listened during any average quarter hour from 6am to midnight, Monday through Sunday in the Metro Survey Area.
  • 12. Coverage Comparison • Our Weekly Reach Plan 1 - Two Step Weeks Plant Location Cross Artery Direction Plan Weekly Plan Plan Target In- Weekly Total Target EOI Unit ID Facing TRP TRP Reach Avg Market EOI Total (%) Freq A18+ EOI 4 078549 STEMMONS FRWY INWOOD RD E 74.8 18.7 12.9 5.8 3,941,528 986,885 3,947,540 4 078723 LBJ FRWY DENTON DR E 69 17.2 12.4 5.6 3,636,797 912,813 3,651,252 4 001725 Central Expwy Spring Valley N 54.7 13.7 9.2 5.9 2,885,934 730,523 2,922,092 4 003856 THORNTON FRWY JIM MILLER RD E 43.6 10.9 7.8 5.6 2,297,381 574,720 2,298,878 4 001253 I-45 RL THORNTON S 39.5 9.9 6.3 6.3 2,079,717 520,090 2,080,360 4 078686 WALTON WALKER AIRPORT FRWY S 37.1 9.3 6.1 6.1 1,956,538 489,996 1,959,984 4 078605 AIRPORT FRWY COUNTY LINE RD E 35.6 8.9 7 5 1,874,768 468,692 1,874,768 4 001054 HWY 360 I-20 S 34.2 8.5 6.3 5.4 1,800,144 451,964 1,807,856 4 002936 LOOP 820 SE WICHITA ST W 33.4 8.4 6.4 5.2 1,761,286 449,438 1,797,752 4 006041 TOM LANDRY HWY WESTMORELAND W 24.1 6 5 4.9 1,272,588 318,147 1,272,588 4 006448 South Frwy Hargrove Ln S 22.9 5.7 4 5.7 1,207,652 301,913 1,207,652 4 006570 LBJ FRWY MILLER RD W 21.3 5.3 5.6 3.8 1,123,664 280,916 1,123,664 4 045193 HWY 67 MAIN ST S 10.8 2.7 2.5 4.3 569,408 142,352 569,408 4 078073 I-35W FM 407 S 8.2 2.1 1.7 5 434,288 108,572 434,288 4 045276 HWY 380 FM 423 W 6.1 1.5 1 6.4 323,270 82,836 331,344 4 078709 FM 423 WITT RD N 4 1 0.7 5.8 208,653 52,332 209,328 4 519.3 129.8 59.7 8.7 27,373,616 6,872,189 27,488,753 Total $49,280 Half $24,640 Target Population: 5,271,248 Weekly $12,320 Half $6,160 Market: Dallas-Ft. Worth, TX (DMA), Target: All Daily $1,760 Half $880 Telmar Outdoor Planning System, Version 2.2.1.4 How much radio could you buy each week for $12,320 or $61600?
  • 13. Media Planning 101 SQAD: The go-to CPP source for Agency planners & buyers
  • 15. Media Planning 101 A Typical Agency/Buyer “Avail” or RFP The Station’s Goals: • SHARE • RATE • CPP • Clear Spots • Clear Bumps
  • 17. Competitive? Radio: 21% LOCAL RADIO NEWSPAPERS US INTERNET- BRAND TOTAL DOLS DOLS DOLS OUTDOOR DOLS SPOT TV DOLS DISPLAY DOLS Q2_2012 TOTAL $ 352,678,612 $ 73,609,395 $ 126,596,009 $ 29,752,502 $ 117,275,607 $ 5,445,129 21% 36% 8% 33% 2% Tom Thumb Food Store $ 1,587,217 $ 919,985 $ 214,583 $ 452,649 Pepsi $ 943,451 $ 851,841 $ 41,976 $ 49,580 $ 54 Kroger Food Stores $ 2,588,458 $ 785,565 $ 530,038 $ 197,228 $ 1,071,089 $ 4,538 Sleep Experts Store $ 1,484,164 $ 782,357 $ 19,296 $ 669,606 $ 12,905 Verizon Wireless $ 1,644,799 $ 773,035 $ 189,000 $ 254,047 $ 383,968 $ 44,749 BOOTHE EYE CARE&LSR CTR $ 767,997 $ 767,997 AT&T $ 1,337,241 $ 750,369 $ 124,391 $ 2,309 $ 405,838 $ 54,334 Toyota Full Line $ 797,748 $ 717,490 $ 80,254 $ 4 Charter Communications Cable $ 1,104,331 $ 702,083 $ 13,500 $ 388,498 $ 250 Six Flags Theme Parks $ 1,084,144 $ 648,128 $ 435,319 $ 697 Anheuser-Busch $ 678,029 $ 638,891 $ 39,138 Geico $ 1,519,861 $ 616,191 $ 398,127 $ 505,106 $ 437 T-Mobile Wireless Store $ 582,373 $ 581,078 $ 1,295 Walmart $ 1,870,415 $ 573,761 $ 858,704 $ 58,470 $ 345,110 $ 34,370 Mattress Firm Store $ 1,560,407 $ 567,974 $ 380,876 $ 579,870 $ 31,687 Subway $ 1,064,096 $ 548,609 $ 85,321 $ 429,688 $ 478 McDonalds $ 1,948,059 $ 518,693 $ 2,444 $ 706,615 $ 699,116 $ 21,190 Office Depot Office Supply $ 1,190,424 $ 472,530 $ 227,584 $ 489,965 $ 345 Coca-Cola $ 659,700 $ 468,876 $ 190,791 $ 33 Reliant Energy $ 1,549,074 $ 467,620 $ 31,828 $ 94,088 $ 898,437 $ 57,102 Albertsons Food Store $ 824,467 $ 454,055 $ 365,422 $ 1,344 $ 3,646 MillerCoors $ 570,974 $ 441,752 $ 129,222
  • 18. Competitive? TV: 33% LOCAL RADIO NEWSPAPERS US INTERNET- BRAND TOTAL DOLS DOLS DOLS OUTDOOR DOLS SPOT TV DOLS DISPLAY DOLS $ $ Q2_2012 TOTAL 352,678,612 $ 73,609,395 $ 126,596,009 29,752,502 $ 117,275,607 $ 5,445,129 21% 36% 8% 33% 2% Pol-US Senate $ 5,103,241 $ 257,235 $ 4,846,006 Time Warner Cable $ 4,385,894 $ 301,099 $ 127,711 $ 9,100 $ 3,903,900 $ 44,083 PoL-Congress $ 3,308,889 $ 394,102 $ 10,332 $ 186,591 $ 2,717,863 $ 1 Rooms To Go Furniture Store $ 5,413,862 $ 223,807 $ 2,644,049 $ 2,545,579 $ 427 AT&T U-verse $ 2,412,795 $ 2,410,301 $ 2,494 Chevrolet Silverado $ 1,473,039 $ 1,471,638 $ 1,401 Sonic $ 1,642,748 $ 433,936 $ 2,190 $ 1,206,506 $ 115 Ford F-Series $ 1,090,515 $ 1,090,495 $ 20 Kroger Food Stores $ 2,588,458 $ 785,565 $ 530,038 $ 197,228 $ 1,071,089 $ 4,538 Toyota Camry $ 1,039,119 $ 1,038,777 $ 342 $ Jim S Adler Attorney $ 1,006,017 1,006,017 Toyota Tundra $ 968,005 $ 967,881 $ 124 TXU Energy $ 1,623,535 $ 433,452 $ 23,199 $ 203,553 $ 963,330 Nissan Altima $ 957,666 $ 956,877 $ 789 Ford Focus $ 951,219 $ 950,148 $ 1,071 Jack In The Box $ 1,107,715 $ 56,405 $ 121,963 $ 929,332 $ 15 Reliant Energy $ 1,549,074 $ 467,620 $ 31,828 $ 94,088 $ 898,437 $ 57,102 Empire Today Home Services $ 848,753 $ 848,753 Volkswagen Jetta $ 785,979 $ 785,711 $ 268 Chase Bank $ 996,551 $ 197,082 $ 26,563 $ 761,062 $ 11,844 Honda Accord $ 760,949 $ 760,865 $ 84 Whataburger $ 1,234,931 $ 228,203 $ 245,587 $ 760,261 $ 880
  • 19. Competitive? Newspaper: 36%? LOCAL RADIO NEWSPAPERS US INTERNET- BRAND TOTAL DOLS DOLS DOLS OUTDOOR DOLS SPOT TV DOLS DISPLAY DOLS $ $ Q2_2012 TOTAL 352,678,612 $ 73,609,395 $ 126,596,009 29,752,502 $ 117,275,607 $ 5,445,129 21% 36% 8% 33% 2% Frys Electronics Store $ 5,824,748 $ 5,824,297 $ 451 News America FSI $ 3,650,127 $ 3,650,127 Dir $ 3,639,007 $ 3,639,007 Valassis Coupons $ 3,001,486 $ 3,001,486 Rooms To Go Furniture Store $ 5,413,862 $ 223,807 $ 2,644,049 $ 2,545,579 $ 427 Sears $ 2,153,802 $ 238,484 $ 1,903,877 $ 2,095 $ 9,346 Bankrate.com $ 1,761,349 $ 1,761,349 Target $ 1,773,481 $ 28,775 $ 1,660,934 $ 77,681 $ 381 $ 5,710 Macys $ 1,789,878 $ 63,956 $ 1,642,050 $ 81,645 $ 2,227 Best Buy Electronics Store $ 1,501,239 $ 975 $ 1,494,184 $ 342 $ 5,738 Plant Shed Nursery $ 1,444,178 $ 1,442,063 $ 2,115 Ashley Furniture Home Store $ 1,789,914 $ 1,427,435 $ 27,060 $ 335,251 $ 168 Kohls $ 1,744,438 $ 147,597 $ 1,378,432 $ 205,946 $ 12,463 Classic Chevrolet $ 1,409,795 $ 154,065 $ 1,252,826 $ 2,904 Dillards $ 1,207,512 $ 27,405 $ 1,178,835 $ 1,272 HP $ 1,206,642 $ 27,270 $ 1,167,425 $ 11,875 $ 72 Bank Of America $ 1,613,735 $ 15,000 $ 1,123,920 $ 404,791 $ 70,024 T-Mobile Wireless $ 1,184,083 $ 1,097,738 $ 82,915 $ 3,431 Cars.com $ 1,016,749 $ 25,465 $ 990,797 $ 487 Classic Auto Dealer $ 907,052 $ 24,179 $ 882,873 Sprint Wireless $ 930,732 $ 881,370 $ 27,198 $ 22,164 Walmart $ 1,870,415 $ 573,761 $ 858,704 $ 58,470 $ 345,110 $ 34,370
  • 20. If you don’t ask, you don’t get.
  • 21. Metrics for Success • Rating Points? Reach? Frequency? Monday Morning Memo Roy Williams The Wizard of Ads
  • 23. Metrics for Success • Rating Points? Reach? Frequency? Who Is Your Customer? Media Buying Lesson Number One I’ve never seen a business fail because they were reaching the wrong customer. But I’ve seen hundreds fail because they were saying the wrong things. Most ads answer questions no one was asking. How did we Americans become so fixated on “targeting the right customer” in our advertising? That question has two answers. The first is, “because it’s completely logical” and our natural inclination is to follow the footsteps of lovely Logic, even when she leads us to erroneous conclusions. The second reason we’re fixated on targeting the right customer is, in two words, “advertising salespeople.” The Wizard of Ads – Roy Williams
  • 24. Metrics for Success • Rating Points? Reach? Frequency? Question: Has anyone done a one-week, let alone one month campaign where are we are directly connected to measureable results? (i.e., a product or service only advertised on our displays or a special landing page for the digital campaign.) CCO: We’ve seen advertisers gather measurable results from a one- week campaign, it was always because they had done a huge volume of coverage during that short term run … tipping the scales at 14, 28 or more digital billboard locations. Seen this move the needle on event promotions, major grocery retail pricing responses…
  • 26. Metrics for Success • Rating Points? Reach? Frequency? Question: What’s a recommended buy? CCO: One network (14 locations) or two networks (28 locations) or other large-scale programs generate the best ROI… We have had several clients with success using these levels of coverage
  • 28. Metrics for Success • Rating Points? Reach? Frequency? Question: What Works? TRP levels? Reach levels? Frequency levels? (or do we just make this stuff up?) CCO: Our networks range in the following per 4-week period • Reach 40% – 50% • Frequency 13x – 15x • TRP 580 – 680 • Impressions 24 million - 28 million
  • 30. Presentation 101 • Media Comparison • Media Mix • Getting our fair share…And more! • START Selling in Days/Weeks! • STOP Selling in Periods!
  • 33. Presentation 101 Ask For Our Fair Share
  • 34. Eyes On Media Comparison Market: Dallas/Ft Worth Target: Adults 18+ Duration: 4 weeks Budget: $24,600 Avg Gross Imp CPP CPM Media/Units Reach TRPs Freq and EOI Newspaper 2 quarter page ads 19.7% 1.6x 32 1.5 million $750 $15.84 Television 16 30-sec spots 27.0% 1.5x 41 2.1 million $611 $11.69 5 day parts Radio 180 60-sec spots 37.5% 2.3x 86 4.1 million $286 $6.05 M-F 6am - Midnight Outdoor 6 Digital Billboards 23.8% 5.6x 134 6.8 million $183 $3.60 Network 1 Disclaimer: Be advised that the EOI reported for digital billboards represent the complete EOI for the locations. They are not adjusted to account for the number of messages displayed. Sources: Telmar Outdoor Planning System for TAB 2.0; Media Market Guide; Scarborough; Telmar MediaPlanner & TV Plan Systems Disclaimer: EOI reported for digital billboards represent the complete EOI for the locations, unadjusted to account for the number of messages displayed.
  • 35. Cost Efficiency Comparison Cost Per Thousand by Media Market: Dallas/Ft Worth Target: Adults 18+ Duration: 4 weeks Budget: $24,600 $20 Newspaper 2 quarter page ads in Dallas Morning News $15.84 Television 16 30-sec spots $11.69 5 day parts $10 Radio $6.05 180 60-sec spots (top 5 stations) $3.60 M-F 6am - Midnight Outdoor 6 Digital Billboards Network 1 Newspaper TV Radio DOOH Sources: Telmar Outdoor Planning System for TAB 2.0; Media Market Guide; Scarborough; Telmar MediaPlanner & TV Plan Systems Disclaimer: EOI reported for digital billboards represent the complete EOI for the locations, unadjusted to account for the number of messages displayed.
  • 36. Presentation 101 • Media Comparison • Media Mix • Getting our fair share…And more!  Effective Reach & Frequency  Efficient CPP/CPM  Immediate Speed of Light (faster than sound)  Creative Speed & Accuracy  Flexible Day-parting/Week-parting  Interactive Social – FFL (fans for life)  Dynamic Live Content – Connected
  • 37.
  • 38. Creative 101 It’s not about Geography anymore… It’s about people searching for & finding you. It’s Google-ography!
  • 39. Creative 101 “Begin with the End in Mind” :: Stephen Covey • Who? • What? • When? • Where? Who? Name/Logo What? When? Where: URL With only 8 seconds of windshield “screen” time: Use the website for the details! Mobile & Tablet websites are different.
  • 40. NEXT STEP: Let’s Get Going! “We Help Our Clients…” THE CLIENT • ACCOUNT SERVICES • Strategic Planning • Creative Team • Media Planning • Media Buying • Production • Traffic
  • 42. Additionally… • Our Digital build-out is nearly completed for the DFW market. • As a result we are now able to offer an audience based platform for this product, much like radio or other broadcast. • While we are making the transition to this platform of set audience levels, we value your business and know that this is a product that is working for you as you are currently doing it. • Because of that, we are happy to secure the following spots for you out of network and at a premium rate card price of $5,000 each location, you are still getting great value for these two locations! - DS -
  • 43. Additionally… How do we talk to a local agency about our local strategy, and that carry over to other markets that offer Digital? Since this will come up with many multi-market advertisers – this is good question. I would simply get my spiel down from the very beginning of the conversation…. With the Dallas digital footprint one of the largest in the country, we are able to offer full market distribution in terms of audience measurement, much like your broadcast (radio/TV) can deliver. In many of our other markets, digital still needs to be utilized for your call to action campaigns and as a supplemental program for your traditional message – the measurement and distribution levels will just be a little smaller in nature while they are still building their footprint out. That’s pretty much it – your recommendations are based on the clients needs with every campaign – and there isn’t much discussion involved with “why Dallas does this” or why “Ft. Smith does that” – your recommendation as the OOH expert is still based on the client needs along with our parameters. - DS -
  • 44. Additionally… • Between now and the end of the year you may price as you’ve been pricing, even build virtual networks as you have been – BUT – you need to explain where we’re going & why. (Debra’s email yesterday included a great PURPOSE for our network structure. • Some locations are in High-Demand. • So, in 2013… • Yes, each location that is solo as in not sold in one of our network is $5000 per location per period (vs the $3080 local network). • Example: Hand-pick one location from each of the networks. 7 X $5000 = $35,000 for the period. • • There are 4 networks of 16 • Each is $16,000 per week (full spot) • That buys 53 minutes of radio spots compared to 18,144 minutes within our broadcast coverage. • • The Business Women’s Network is 8 • $8000 per week (full spot) • That buys 27 minutes of radio spots compared to 9,072 minutes within our broadcast coverage. • • Denton County is 7 – not Tarrant • $7000 per week (full spot) • That buys 23 minutes of radio spots compared to 7,938 minutes within our broadcast coverage. • • Tarrant County is 4 -- the one-sheet has been corrected • $4000 per week (full spot) • That buys 15 minutes of radio spots compared to 4,536 minutes within our broadcast coverage. • • All the network location lists are on the common drive: Digital/Networks/EOI Reports • • Change your mindset. DO NOT SELL DIGITAL IN 4-Week PERIODS…. • Most Agency Broadcast Buyers and Direct clients buy Radio in one to two week flights spread out over a quarter to support their promotions and events. • • Example: • Talk to your current clients about 12 months of static and 2 weeks of digital per month. • Talk to everyone else about their radio & tv campaign strategy!

Notes de l'éditeur

  1. Aka :: Arbitrary. Crapitron. Diary methodology replaced by PPM in last 5 years. STILL and “estimate” as are all polls that use an acceptable % of respondents.
  2. Aka :: Arbitrary. Crapitron. Diary methodology replaced by PPM in last 5 years. STILL an “estimate” as are all polls that use an acceptable % of respondents.
  3. Distribute / email article
  4. Distribute/email article
  5. Media Comparison slide. Consult with Andrew Marcus and his research team in NYC for assistance. Outdoor delivery must be Eyes On only, NOT DEC based. All text boxes are editable and ready to be customized for your budget and program.
  6. Cost Efficiency Comparison slide. Outdoor delivery must be Eyes On only, NOT DEC based.