
Recommandé
Contenu connexe
Tendances
Tendances (20)
En vedette
Similaire à Computer Tomography
Similaire à Computer Tomography (20)
Plus de Lovnish Thakur
Plus de Lovnish Thakur (20)
Dernier
Dernier (20)
Computer Tomography
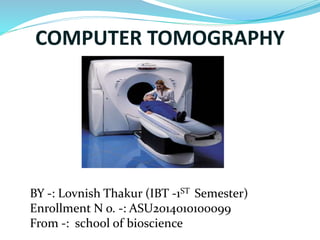
- 1. COMPUTER TOMOGRAPHY BY -: Lovnish Thakur (IBT -1ST Semester) Enrollment N o. -: ASU2014010100099 From -: school of bioscience
- 2. Computer tomography (CT), originally known as computed axial tomography (CAT or CT scan) and body section rentenography. It is a medical imaging method employing tomography where digital geometry processing is used to generate a three-dimensional image of the internals of an object from a large series of two-dimensional X-ray images taken around a single axis of rotation. The word "tomography" is derived from the Greek tomos (slice) and graphein (to write). CT produces a volume of data which can be manipulated, through a process known as windowing, in order to demonstrate various structures based on their ability to block the X-ray beam.
- 3. CT: The beginning CT founded in 1970 by Sir Godfrey Hounsfield first applications were in neuroradiology.
- 4. CT Scanner Used to determine extent of trauma location and type of tumors status of blood vessels -pre surgical planning
- 5. Basic CT scanner components Gantry X-Ray Tube Detector Control Console
- 6. Gantry . The CT scanner gantry is a moveable frame that contains the x-ray tube, including: collimators and filters, detectors, data acquisition system, rotational components including slip ring systems, and all associated electronics such as CT scanner gantry angulation motors & positioning laser lights.
- 8. Capture energy that has not been attenuated by the patient.
- 12. Digital projection AP, PA, Lat or Oblique projection Conventional CT -Axial Volumetric CT - Helical or spiral CT
- 13. Digital Projection X-ray tube and detector remain stationary Patient table moves continuously Produces an image covering a range of anatomy Image used to determine scan location
- 14. Axial CT X-ray tube and detector rotate 360° Patient table is stationary Produces one cross-sectional image Once this is complete patient is moved to next position.
- 15. X-ray tube and detector rotate 360° Patient table moves continuously Produces a helix of image information
- 16. Attenuation X-ray beam passes through patient Each structure attenuates X-ray beam differently According to individual densities Radiation received by detector varies according to these densities
- 17. Transferred from detector to CT computer (A to D converter) Reconstructed by computer into a cross-sectional image Displayed on screen Each pixel displayed on monitor has varying brightness The greater the attenuation, the brighter the pixel The less attenuation, the darker the pixel
- 18. Density information Density values correspond to a range of numbers Hounsfield scale
- 20. Window width Determines range of CT numbers displayed on an image -:Values above this range = white -:Values below this range = black Window level Sets the center CT number displayed on the monitor
- 21. CT image quality Spatial resolution Ability to resolve small objects in an image. Contrast resolution Ability to differentiate small density differences in an image. Post Processing Options • Visualization of vasculature in relation to pathology. • Show course of vessels. • Define vascular stricture.
- 22. CT SCANNER Thus provide a window into the body.
- 23. SOME OF IMAGE FORMED BY CT SCAN
- 24. THANK YOU