SlideShare une entreprise Scribd logo
1  sur  10
Télécharger pour lire hors ligne
Market Dynamics                                                                  Fresno Association Of Realtors
                                                          Months Supply of Inventory (UC Calculation vs. Sold Calculation)
                                                                      2 Years (Monthly) 04/01/10 - 04/30/12


                                                                                                 KEY INFORMATION

                   Monthly Change               Monthly %            Total Change       Total % Change
MSI-UC                      -0.13                 -2.25                  -3.03              -53.91
MSI-Sold                    -0.08                 -1.58                  -1.97              -37.96


MLS: FRESNO       Period:   2 Years (Monthly)             Price:   All                      Construction Type:    All             Bedrooms:    All             Bathrooms:    All      Lot Size: All
Property Types:   Residential: (Residential/Single Family Res, Residential/Condo/PUD)                                                                                                 Sq Ft:    All
Fresno/Clovis:    Fresno, Clovis


BrokerMetrics®                                                                                           1 of 2                                                                                       05/10/12
                                            Information not guaranteed. © 2012 - 2013 Terradatum and its suppliers and licensors (http://www.terradatum.com/metrics/licensors).
Market Dynamics                                                                 Fresno Association Of Realtors
                                            Months Supply of Inventory (UC Calculation vs. Sold Calculation)
                                                        2 Years (Monthly) 04/01/10 - 04/30/12


Time                                   # For Sale Last            # Under
Period           MSI   NAR MSI           Day of Month             Contract              # Sold
Apr-12           1.3       2.0                    1,196                 950                612
Mar-12           1.9       2.7                    1,643                 885                606
Feb-12           2.5       3.8                    1,912                 760                503
Jan-12           3.2       4.1                    2,057                 645                498
Dec-11           4.1       3.2                    2,103                 519                667
Nov-11           3.7       3.9                    2,244                 602                575
Oct-11           3.8       3.8                    2,342                 612                615
Sep-11           3.7       3.8                    2,410                 643                638
Aug-11           3.6       3.6                    2,470                 688                695
Jul-11           3.8       4.0                    2,539                 664                631
Jun-11           3.8       3.5                    2,637                 700                756
May-11           3.8       4.3                    2,682                 705                617
Apr-11           3.8       3.9                    2,684                 702                686
Mar-11           3.9       4.2                    2,709                 689                652
Feb-11           4.3       5.7                    2,687                 618                468
Jan-11           4.9       5.2                    2,707                 554                517
Dec-10           5.2       4.5                    2,737                 530                607
Nov-10           5.8       5.4                    2,956                 514                543
Oct-10           5.3       5.9                    3,006                 568                510
Sep-10           6.2       5.4                    3,078                 500                575
Aug-10           5.1       4.9                    3,026                 588                616
Jul-10           5.1       5.1                    2,973                 583                586
Jun-10           5.2       4.0                    2,855                 547                720
May-10           5.3       4.1                    2,735                 515                666
Apr-10           3.5       4.0                    2,619                 748                657


BrokerMetrics®                                                                                2 of 2                                                                                    05/10/12
                                 Information not guaranteed. © 2012 - 2013 Terradatum and its suppliers and licensors (http://www.terradatum.com/metrics/licensors).
Market Dynamics                                                                  Fresno Association Of Realtors
                                                                               Supply & Demand - # Units (FS, UC, Sold)
                                                                                 2 Years (Monthly) 04/01/10 - 04/30/12


                                                                                                  KEY INFORMATION

                   Monthly Change                Monthly %            Total Change      Total % Change
For Sale                    -48.69                 -1.21                  -1,168.52          -29.09
Under Contract              8.76                   1.63                    210.14             39.20
Sold                        -1.11                  -0.18                   -26.57             -4.27


MLS: FRESNO       Period:    2 Years (Monthly)             Price:   All                      Construction Type:    All             Bedrooms:    All             Bathrooms:    All      Lot Size: All
Property Types:   Residential: (Residential/Single Family Res, Residential/Condo/PUD)                                                                                                  Sq Ft:    All
Fresno/Clovis:    Fresno, Clovis


BrokerMetrics®                                                                                            1 of 2                                                                                       05/10/12
                                             Information not guaranteed. © 2012 - 2013 Terradatum and its suppliers and licensors (http://www.terradatum.com/metrics/licensors).
Market Dynamics                                                                 Fresno Association Of Realtors
                                                                 Supply & Demand - # Units (FS, UC, Sold)
                                                                   2 Years (Monthly) 04/01/10 - 04/30/12


                       FOR SALE                       UNDER CONTRACT                                   SOLD                                   EXPIRED                         NEW LISTINGS
 Time Period     # Properties Average DOM           # Properties Average DOM                  # Properties  Average DOM                 # Properties Average DOM                      # Properties
Apr-12                2,357              96                  950                   57                   612                  54                   211                   109                   714
Mar-12                2,737            101                   885                   55                   606                  68                   209                   116                   825
Feb-12                2,822            104                   760                   62                   503                  64                   150                   136                   765
Jan-12                2,892            110                   645                   72                   498                  61                   190                   140                   789
Dec-11                2,853            114                   519                   67                   667                  58                   231                   134                   609
Nov-11                3,040            108                   602                   59                   575                  60                   194                   146                   698
Oct-11                3,192            102                   612                   57                   615                  61                   238                   120                   782
Sep-11                3,327            101                   643                   61                   638                  60                   274                   132                   857
Aug-11                3,455            103                   688                   60                   695                  62                   297                   148                   916
Jul-11                3,459            103                   664                   62                   631                  61                   256                   125                   822
Jun-11                3,626            100                   700                   61                   756                  64                   289                   126                   944
May-11                3,649            101                   705                   56                   617                  65                   262                   146                   965
Apr-11                3,621            102                   702                   70                   686                  67                   235                   140                   912
Mar-11                3,710            105                   689                   69                   652                  72                   312                   147                 1,023
Feb-11                3,586            110                   618                   74                   468                  70                   281                   128                   879
Jan-11                3,616            113                   554                   69                   517                  73                   355                   132                   879
Dec-10                3,716            119                   530                   74                   607                  68                   449                   157                   760
Nov-10                3,790            117                   514                   71                   543                  68                   320                   137                   784
Oct-10                3,935            113                   568                   65                   510                  71                   361                   136                   857
Sep-10                3,899            112                   500                   65                   575                  75                   321                   137                   873
Aug-10                3,932            109                   588                   61                   616                  64                   318                   132                   959
Jul-10                3,862            109                   583                   61                   586                  64                   306                   143                 1,007
Jun-10                3,658            110                   547                   58                   720                  60                   256                   133                   923
May-10                3,470            110                   515                   65                   666                  61                   220                   132                   851
Apr-10                3,624            104                   748                   54                   657                  56                   257                   134                 1,085


BrokerMetrics®                                                                                 2 of 2                                                                                                05/10/12
                                  Information not guaranteed. © 2012 - 2013 Terradatum and its suppliers and licensors (http://www.terradatum.com/metrics/licensors).
Market Dynamics                                                                  Fresno Association Of Realtors
                                                                   Average DOM vs. CDOM for Under Contract Properties
                                                                           2 Years (Monthly) 04/01/10 - 04/30/12


                                                                                                 KEY INFORMATION

                   Monthly Change               Monthly %            Total Change       Total % Change
DOM                         -0.09                 -0.14                  -2.24               -3.47
CDOM                        -0.00                 -0.00                  -0.03               -0.03


MLS: FRESNO       Period:   2 Years (Monthly)             Price:   All                      Construction Type:    All             Bedrooms:    All             Bathrooms:    All      Lot Size: All
Property Types:   Residential: (Residential/Single Family Res, Residential/Condo/PUD)                                                                                                 Sq Ft:    All
Fresno/Clovis:    Fresno, Clovis


BrokerMetrics®                                                                                           1 of 2                                                                                       05/10/12
                                            Information not guaranteed. © 2012 - 2013 Terradatum and its suppliers and licensors (http://www.terradatum.com/metrics/licensors).
Market Dynamics                                                                 Fresno Association Of Realtors
                                                    Average DOM vs. CDOM for Under Contract Properties
                                                            2 Years (Monthly) 04/01/10 - 04/30/12


Time              # Under
Period           Contract   Avg DOM          Avg CDOM
Apr-12               950         57                     72
Mar-12               885         55                     73
Feb-12               760         62                     77
Jan-12               645         72                     88
Dec-11               519         67                     87
Nov-11               602         59                     71
Oct-11               612         57                     77
Sep-11               643         61                     75
Aug-11               688         60                     77
Jul-11               664         62                     81
Jun-11               700         61                     79
May-11               705         56                     77
Apr-11               702         70                     88
Mar-11               689         69                     85
Feb-11               618         74                     98
Jan-11               554         69                     91
Dec-10               530         74                     94
Nov-10               514         71                     90
Oct-10               568         65                     78
Sep-10               500         65                     85
Aug-10               588         61                     75
Jul-10               583         61                     72
Jun-10               547         58                     69
May-10               515         65                     81
Apr-10               748         54                     64


BrokerMetrics®                                                                               2 of 2                                                                                    05/10/12
                                Information not guaranteed. © 2012 - 2013 Terradatum and its suppliers and licensors (http://www.terradatum.com/metrics/licensors).
Market Dynamics                                                                  Fresno Association Of Realtors
                                                                                           Median Price (Sold)
                                                                                  2 Years (Monthly) 04/01/10 - 04/30/12


                                                                                                  KEY INFORMATION

                    Monthly Change        Monthly % Change              Total Change     Total % Change
Sold                        -714.30              -0.46                  -17,143.15           -10.95


MLS: FRESNO       Period:    2 Years (Monthly)           Price:   All                        Construction Type:    All             Bedrooms:    All             Bathrooms:    All      Lot Size: All
Property Types:   Residential: (Residential/Single Family Res, Residential/Condo/PUD)                                                                                                  Sq Ft:    All
Fresno/Clovis:    Fresno, Clovis


BrokerMetrics®                                                                                            1 of 2                                                                                       05/10/12
                                             Information not guaranteed. © 2012 - 2013 Terradatum and its suppliers and licensors (http://www.terradatum.com/metrics/licensors).
Market Dynamics                                                                 Fresno Association Of Realtors
                                                                            Median Price (Sold)
                                                                   2 Years (Monthly) 04/01/10 - 04/30/12


                    FOR SALE                       UNDER CONTRACT                                   SOLD                                    EXPIRED                          NEW LISTINGS
 Time Period     Median $   # Properties            Median $  # Properties                     Median $  # Properties                    Median $   # Properties            Median $   # Properties
Apr-12            169,900          2,357              149,900                  950              150,000                   612              165,000                    211    163,200            714
Mar-12            159,900          2,737              144,000                  885              136,880                   606              158,500                    209    155,000            825
Feb-12            159,000          2,822              149,900                  760              145,000                   503              141,450                    150    149,900            765
Jan-12            155,000          2,892              142,900                  645              135,000                   498              167,450                    190    154,500            789
Dec-11            154,900          2,853              139,500                  519              142,900                   667              171,950                    231    149,950            609
Nov-11            155,000          3,040              152,050                  602              150,000                   575              159,925                    194    154,900            698
Oct-11            150,850          3,192              143,700                  612              143,000                   615              159,000                    238    140,000            782
Sep-11            154,900          3,327              146,500                  643              148,250                   638              159,925                    274    150,000            857
Aug-11            155,000          3,455              149,925                  688              150,000                   695              160,000                    297    149,450            916
Jul-11            154,999          3,459              144,950                  664              143,000                   631              159,900                    256    142,200            822
Jun-11            155,000          3,626              139,900                  700              140,000                   756              159,900                    289    153,400            944
May-11            155,000          3,649              147,500                  705              147,000                   617              166,750                    262    149,900            965
Apr-11            155,000          3,621              149,250                  702              139,900                   686              159,000                    235    149,900            912
Mar-11            153,450          3,710              134,900                  689              144,400                   652              157,950                    312    149,900          1,023
Feb-11            154,925          3,586              154,900                  618              142,500                   468              165,000                    281    154,999            879
Jan-11            155,000          3,616              155,000                  554              136,000                   517              169,000                    355    155,800            879
Dec-10            155,700          3,716              149,900                  530              152,500                   607              177,000                    449    144,900            760
Nov-10            159,900          3,790              150,449                  514              148,000                   543              169,950                    320    147,300            784
Oct-10            162,000          3,935              152,500                  568              155,000                   510              185,000                    361    149,900            857
Sep-10            165,000          3,899              157,200                  500              160,000                   575              174,900                    321    163,000            873
Aug-10            165,000          3,932              159,900                  588              155,000                   616              175,000                    318    158,500            959
Jul-10            169,000          3,862              159,900                  583              160,000                   586              185,050                    306    160,000          1,007
Jun-10            170,000          3,658              162,500                  547              167,000                   720              204,925                    256    155,500            923
May-10            175,000          3,470              171,900                  515              160,000                   666              189,975                    220    164,900            851
Apr-10            178,975          3,624              169,900                  748              150,000                   657              185,000                    257    172,000          1,085


BrokerMetrics®                                                                               2 of 2                                                                                         05/10/12
                                Information not guaranteed. © 2012 - 2013 Terradatum and its suppliers and licensors (http://www.terradatum.com/metrics/licensors).
Market Dynamics                                                                  Fresno Association Of Realtors
                                                                                            Sales Absorption
                                                                                   2 Years (Monthly) 04/01/10 - 04/30/12


                                                                                                  KEY INFORMATION

                     Monthly Change       Monthly % Change              Total Change     Total % Change
% Under Contract             0.60                 5.01                     14.47             120.12
% Sold                       0.25                 1.64                     5.92               39.34


MLS: FRESNO        Period:   2 Years (Monthly)           Price:   All                        Construction Type:    All             Bedrooms:    All             Bathrooms:    All      Lot Size: All
Property Types:    Residential: (Residential/Single Family Res, Residential/Condo/PUD)                                                                                                 Sq Ft:    All
Fresno/Clovis:     Fresno, Clovis


BrokerMetrics®                                                                                            1 of 2                                                                                       05/10/12
                                             Information not guaranteed. © 2012 - 2013 Terradatum and its suppliers and licensors (http://www.terradatum.com/metrics/licensors).
Market Dynamics                                                                 Fresno Association Of Realtors
                                                                                Sales Absorption
                                                                       2 Years (Monthly) 04/01/10 - 04/30/12


Time         % of Properties   % of Properties         # Properties         # Properties             # Properties
Period       Under Contract              Sold             For Sale        Under Contract                    Sold
Apr-12                 40.3              26.0                 2,357                    950                    612
Mar-12                 32.3              22.1                 2,737                    885                    606
Feb-12                 26.9              17.8                 2,822                    760                    503
Jan-12                 22.3              17.2                 2,892                    645                    498
Dec-11                 18.2              23.4                 2,853                    519                    667
Nov-11                 19.8              18.9                 3,040                    602                    575
Oct-11                 19.2              19.3                 3,192                    612                    615
Sep-11                 19.3              19.2                 3,327                    643                    638
Aug-11                 19.9              20.1                 3,455                    688                    695
Jul-11                 19.2              18.2                 3,459                    664                    631
Jun-11                 19.3              20.8                 3,626                    700                    756
May-11                 19.3              16.9                 3,649                    705                    617
Apr-11                 19.4              19.0                 3,621                    702                    686
Mar-11                 18.6              17.6                 3,710                    689                    652
Feb-11                 17.2              13.0                 3,586                    618                    468
Jan-11                 15.3              14.3                 3,616                    554                    517
Dec-10                 14.3              16.3                 3,716                    530                    607
Nov-10                 13.6              14.3                 3,790                    514                    543
Oct-10                 14.4              13.0                 3,935                    568                    510
Sep-10                 12.8              14.8                 3,899                    500                    575
Aug-10                 15.0              15.7                 3,932                    588                    616
Jul-10                 15.1              15.2                 3,862                    583                    586
Jun-10                 15.0              19.7                 3,658                    547                    720
May-10                 14.8              19.2                 3,470                    515                    666
Apr-10                 20.6              18.1                 3,624                    748                    657


BrokerMetrics®                                                                                   2 of 2                                                                                    05/10/12
                                    Information not guaranteed. © 2012 - 2013 Terradatum and its suppliers and licensors (http://www.terradatum.com/metrics/licensors).

Contenu connexe

Similaire à Market dynamics report

June 2010 Bucks County Month Supply of Inventory and Average Days on Market A...
June 2010 Bucks County Month Supply of Inventory and Average Days on Market A...June 2010 Bucks County Month Supply of Inventory and Average Days on Market A...
June 2010 Bucks County Month Supply of Inventory and Average Days on Market A...Prudential Fox & Roach, Realtors
 
June 2010 Delaware County Month Supply of Inventory and Average Days on Market
June 2010 Delaware County Month Supply of Inventory and Average Days on Market June 2010 Delaware County Month Supply of Inventory and Average Days on Market
June 2010 Delaware County Month Supply of Inventory and Average Days on Market Prudential Fox & Roach, Realtors
 
2010 March Delaware County Month Supply of Inventory and Average Days on Mark...
2010 March Delaware County Month Supply of Inventory and Average Days on Mark...2010 March Delaware County Month Supply of Inventory and Average Days on Mark...
2010 March Delaware County Month Supply of Inventory and Average Days on Mark...Prudential Fox & Roach, Realtors
 
Montgomery county Month Supply of Inventory and Average Days on Market Analysis
Montgomery county Month Supply of Inventory and Average Days on Market AnalysisMontgomery county Month Supply of Inventory and Average Days on Market Analysis
Montgomery county Month Supply of Inventory and Average Days on Market AnalysisPrudential Fox & Roach, Realtors
 
June 2010 Chester County Month Supply of Inventory and Average Days on Market...
June 2010 Chester County Month Supply of Inventory and Average Days on Market...June 2010 Chester County Month Supply of Inventory and Average Days on Market...
June 2010 Chester County Month Supply of Inventory and Average Days on Market...Prudential Fox & Roach, Realtors
 
July 2010 Bucks County Month Supply of Inventory and Average Days on Market
July 2010 Bucks County Month Supply of Inventory and Average Days on MarketJuly 2010 Bucks County Month Supply of Inventory and Average Days on Market
July 2010 Bucks County Month Supply of Inventory and Average Days on MarketPrudential Fox & Roach, Realtors
 

Similaire à Market dynamics report (20)

May 2010 Delaware County MSI And Avg DOM
May 2010 Delaware County MSI And Avg DOMMay 2010 Delaware County MSI And Avg DOM
May 2010 Delaware County MSI And Avg DOM
 
June 2010 Bucks County Month Supply of Inventory and Average Days on Market A...
June 2010 Bucks County Month Supply of Inventory and Average Days on Market A...June 2010 Bucks County Month Supply of Inventory and Average Days on Market A...
June 2010 Bucks County Month Supply of Inventory and Average Days on Market A...
 
June 2010 Delaware County Month Supply of Inventory and Average Days on Market
June 2010 Delaware County Month Supply of Inventory and Average Days on Market June 2010 Delaware County Month Supply of Inventory and Average Days on Market
June 2010 Delaware County Month Supply of Inventory and Average Days on Market
 
May 2010 Bucks County MSI and Avg DOM
May 2010 Bucks County MSI and Avg DOMMay 2010 Bucks County MSI and Avg DOM
May 2010 Bucks County MSI and Avg DOM
 
2010 March Delaware County Month Supply of Inventory and Average Days on Mark...
2010 March Delaware County Month Supply of Inventory and Average Days on Mark...2010 March Delaware County Month Supply of Inventory and Average Days on Mark...
2010 March Delaware County Month Supply of Inventory and Average Days on Mark...
 
Montgomery county Month Supply of Inventory and Average Days on Market Analysis
Montgomery county Month Supply of Inventory and Average Days on Market AnalysisMontgomery county Month Supply of Inventory and Average Days on Market Analysis
Montgomery county Month Supply of Inventory and Average Days on Market Analysis
 
Delaware county msi and avg dom
Delaware county msi and avg domDelaware county msi and avg dom
Delaware county msi and avg dom
 
Delaware County MSI and Average Days on Market
Delaware County MSI and Average Days on MarketDelaware County MSI and Average Days on Market
Delaware County MSI and Average Days on Market
 
Delaware county msi and avg dom
Delaware county msi and avg domDelaware county msi and avg dom
Delaware county msi and avg dom
 
Delaware county msi and avg dom
Delaware county msi and avg domDelaware county msi and avg dom
Delaware county msi and avg dom
 
January 2010 Delaware County MSI And Avg Dom
January 2010 Delaware County MSI And Avg DomJanuary 2010 Delaware County MSI And Avg Dom
January 2010 Delaware County MSI And Avg Dom
 
2010 February Delaware County MSI And Avg Dom
2010 February Delaware County MSI And Avg Dom2010 February Delaware County MSI And Avg Dom
2010 February Delaware County MSI And Avg Dom
 
May 2010 Montgomery County MSI and Average DOM
May 2010 Montgomery County MSI and Average DOMMay 2010 Montgomery County MSI and Average DOM
May 2010 Montgomery County MSI and Average DOM
 
May 2010 Chester County MSI And Avg Days on Market
May 2010 Chester County MSI And Avg Days on MarketMay 2010 Chester County MSI And Avg Days on Market
May 2010 Chester County MSI And Avg Days on Market
 
Chester county msi and avg dom
Chester county msi and avg domChester county msi and avg dom
Chester county msi and avg dom
 
Chester county msi and avg dom
Chester county msi and avg domChester county msi and avg dom
Chester county msi and avg dom
 
June 2010 Chester County Month Supply of Inventory and Average Days on Market...
June 2010 Chester County Month Supply of Inventory and Average Days on Market...June 2010 Chester County Month Supply of Inventory and Average Days on Market...
June 2010 Chester County Month Supply of Inventory and Average Days on Market...
 
July 2010 Bucks County Month Supply of Inventory and Average Days on Market
July 2010 Bucks County Month Supply of Inventory and Average Days on MarketJuly 2010 Bucks County Month Supply of Inventory and Average Days on Market
July 2010 Bucks County Month Supply of Inventory and Average Days on Market
 
Montgomery County MSI and Avg DOM
Montgomery County MSI and Avg DOMMontgomery County MSI and Avg DOM
Montgomery County MSI and Avg DOM
 
Montgomery county msi and avg dom
Montgomery county msi and avg domMontgomery county msi and avg dom
Montgomery county msi and avg dom
 

Dernier

How to Build Multifamily and Laneway Suites in Toronto!! (feat. Expert Archi...
How to Build Multifamily and Laneway Suites  in Toronto!! (feat. Expert Archi...How to Build Multifamily and Laneway Suites  in Toronto!! (feat. Expert Archi...
How to Build Multifamily and Laneway Suites in Toronto!! (feat. Expert Archi...Volition Properties
 
Raquel Thompson: Combining Creativity with Practicality in Architecture
Raquel Thompson: Combining  Creativity with Practicality in ArchitectureRaquel Thompson: Combining  Creativity with Practicality in Architecture
Raquel Thompson: Combining Creativity with Practicality in ArchitectureRaquel Thompson Barbados
 
Properties for Sale in Istanbul with Schools and Parks | Antalya Development
Properties for Sale in Istanbul with Schools and Parks | Antalya DevelopmentProperties for Sale in Istanbul with Schools and Parks | Antalya Development
Properties for Sale in Istanbul with Schools and Parks | Antalya DevelopmentAntalya Development
 
Call Girls in Noida Sector 12 Noida 💯Call Us 🔝 9582086666 🔝 South Delhi Escor...
Call Girls in Noida Sector 12 Noida 💯Call Us 🔝 9582086666 🔝 South Delhi Escor...Call Girls in Noida Sector 12 Noida 💯Call Us 🔝 9582086666 🔝 South Delhi Escor...
Call Girls in Noida Sector 12 Noida 💯Call Us 🔝 9582086666 🔝 South Delhi Escor...delhimodel235
 
Call Girls in laxmi Nagar Delhi 💯Call Us 🔝 9582086666🔝 South Delhi Escorts Se...
Call Girls in laxmi Nagar Delhi 💯Call Us 🔝 9582086666🔝 South Delhi Escorts Se...Call Girls in laxmi Nagar Delhi 💯Call Us 🔝 9582086666🔝 South Delhi Escorts Se...
Call Girls in laxmi Nagar Delhi 💯Call Us 🔝 9582086666🔝 South Delhi Escorts Se...delhimodel235
 
Premium Villa Projects in Sarjapur Road Bengaluru
Premium Villa Projects in Sarjapur Road BengaluruPremium Villa Projects in Sarjapur Road Bengaluru
Premium Villa Projects in Sarjapur Road BengaluruShivaSeo3
 
Sankla East World Hadapsar Pune E-Brochure.pdf
Sankla East World Hadapsar Pune  E-Brochure.pdfSankla East World Hadapsar Pune  E-Brochure.pdf
Sankla East World Hadapsar Pune E-Brochure.pdfManishSaxena95
 
M3M 129 E Brochure Noida Expressway, Sector 129, Noida
M3M 129 E Brochure Noida Expressway, Sector 129, NoidaM3M 129 E Brochure Noida Expressway, Sector 129, Noida
M3M 129 E Brochure Noida Expressway, Sector 129, Noidasarak0han45400
 
Mahindra Happinest Tathawade Pune Brochure.pdf
Mahindra Happinest Tathawade Pune Brochure.pdfMahindra Happinest Tathawade Pune Brochure.pdf
Mahindra Happinest Tathawade Pune Brochure.pdfBabyrudram
 
Call Girls in Noida Sector 11 Noida 💯Call Us 🔝 9582086666 🔝 South Delhi Escor...
Call Girls in Noida Sector 11 Noida 💯Call Us 🔝 9582086666 🔝 South Delhi Escor...Call Girls in Noida Sector 11 Noida 💯Call Us 🔝 9582086666 🔝 South Delhi Escor...
Call Girls in Noida Sector 11 Noida 💯Call Us 🔝 9582086666 🔝 South Delhi Escor...delhimodel235
 
Listing Turkey Sylvana Istanbul - Bahcesehir
Listing Turkey Sylvana Istanbul - BahcesehirListing Turkey Sylvana Istanbul - Bahcesehir
Listing Turkey Sylvana Istanbul - BahcesehirListing Turkey
 
2k Shot Call girls Karol Bagh Delhi 9205541914
2k Shot Call girls Karol Bagh Delhi 92055419142k Shot Call girls Karol Bagh Delhi 9205541914
2k Shot Call girls Karol Bagh Delhi 9205541914Delhi Call girls
 
Magarpatta Nova Elegance Mundhwa Pune E-Brochure.pdf
Magarpatta Nova Elegance Mundhwa Pune  E-Brochure.pdfMagarpatta Nova Elegance Mundhwa Pune  E-Brochure.pdf
Magarpatta Nova Elegance Mundhwa Pune E-Brochure.pdfManishSaxena95
 
9990771857 Call Girls in Dwarka Sector 1 Delhi (Call Girls) Delhi
9990771857 Call Girls in Dwarka Sector 1 Delhi (Call Girls) Delhi9990771857 Call Girls in Dwarka Sector 1 Delhi (Call Girls) Delhi
9990771857 Call Girls in Dwarka Sector 1 Delhi (Call Girls) Delhidelhimodel235
 
Girls in Kalyanpuri }Delhi↫8447779280↬Escort Service. In Delhi NCR
Girls in Kalyanpuri }Delhi↫8447779280↬Escort Service. In Delhi NCRGirls in Kalyanpuri }Delhi↫8447779280↬Escort Service. In Delhi NCR
Girls in Kalyanpuri }Delhi↫8447779280↬Escort Service. In Delhi NCRasmaqueen5
 
Kohinoor Hinjewadi Phase 2 Pune E-Brochure.pdf
Kohinoor Hinjewadi Phase 2 Pune  E-Brochure.pdfKohinoor Hinjewadi Phase 2 Pune  E-Brochure.pdf
Kohinoor Hinjewadi Phase 2 Pune E-Brochure.pdfManishSaxena95
 
Omaxe Dwarka In Delhi E Brochure Pdf
Omaxe Dwarka In Delhi E Brochure     PdfOmaxe Dwarka In Delhi E Brochure     Pdf
Omaxe Dwarka In Delhi E Brochure Pdfashiyadav24
 
Telibagh & Call Girls Lucknow - 450+ Call Girl Cash Payment 🎂 8923113531 🎪 Ne...
Telibagh & Call Girls Lucknow - 450+ Call Girl Cash Payment 🎂 8923113531 🎪 Ne...Telibagh & Call Girls Lucknow - 450+ Call Girl Cash Payment 🎂 8923113531 🎪 Ne...
Telibagh & Call Girls Lucknow - 450+ Call Girl Cash Payment 🎂 8923113531 🎪 Ne...gurkirankumar98700
 
Maha Mauka Squarefeet Brochure |Maha Mauka Squarefeet PDF Brochure|
Maha Mauka Squarefeet Brochure |Maha Mauka Squarefeet PDF Brochure|Maha Mauka Squarefeet Brochure |Maha Mauka Squarefeet PDF Brochure|
Maha Mauka Squarefeet Brochure |Maha Mauka Squarefeet PDF Brochure|AkshayJoshi575980
 
Pooja Mehta 9167673311 Get Warm Welcome By Andheri Escorts For Desired Fantasies
Pooja Mehta 9167673311 Get Warm Welcome By Andheri Escorts For Desired FantasiesPooja Mehta 9167673311 Get Warm Welcome By Andheri Escorts For Desired Fantasies
Pooja Mehta 9167673311 Get Warm Welcome By Andheri Escorts For Desired FantasiesPooja Nehwal
 

Dernier (20)

How to Build Multifamily and Laneway Suites in Toronto!! (feat. Expert Archi...
How to Build Multifamily and Laneway Suites  in Toronto!! (feat. Expert Archi...How to Build Multifamily and Laneway Suites  in Toronto!! (feat. Expert Archi...
How to Build Multifamily and Laneway Suites in Toronto!! (feat. Expert Archi...
 
Raquel Thompson: Combining Creativity with Practicality in Architecture
Raquel Thompson: Combining  Creativity with Practicality in ArchitectureRaquel Thompson: Combining  Creativity with Practicality in Architecture
Raquel Thompson: Combining Creativity with Practicality in Architecture
 
Properties for Sale in Istanbul with Schools and Parks | Antalya Development
Properties for Sale in Istanbul with Schools and Parks | Antalya DevelopmentProperties for Sale in Istanbul with Schools and Parks | Antalya Development
Properties for Sale in Istanbul with Schools and Parks | Antalya Development
 
Call Girls in Noida Sector 12 Noida 💯Call Us 🔝 9582086666 🔝 South Delhi Escor...
Call Girls in Noida Sector 12 Noida 💯Call Us 🔝 9582086666 🔝 South Delhi Escor...Call Girls in Noida Sector 12 Noida 💯Call Us 🔝 9582086666 🔝 South Delhi Escor...
Call Girls in Noida Sector 12 Noida 💯Call Us 🔝 9582086666 🔝 South Delhi Escor...
 
Call Girls in laxmi Nagar Delhi 💯Call Us 🔝 9582086666🔝 South Delhi Escorts Se...
Call Girls in laxmi Nagar Delhi 💯Call Us 🔝 9582086666🔝 South Delhi Escorts Se...Call Girls in laxmi Nagar Delhi 💯Call Us 🔝 9582086666🔝 South Delhi Escorts Se...
Call Girls in laxmi Nagar Delhi 💯Call Us 🔝 9582086666🔝 South Delhi Escorts Se...
 
Premium Villa Projects in Sarjapur Road Bengaluru
Premium Villa Projects in Sarjapur Road BengaluruPremium Villa Projects in Sarjapur Road Bengaluru
Premium Villa Projects in Sarjapur Road Bengaluru
 
Sankla East World Hadapsar Pune E-Brochure.pdf
Sankla East World Hadapsar Pune  E-Brochure.pdfSankla East World Hadapsar Pune  E-Brochure.pdf
Sankla East World Hadapsar Pune E-Brochure.pdf
 
M3M 129 E Brochure Noida Expressway, Sector 129, Noida
M3M 129 E Brochure Noida Expressway, Sector 129, NoidaM3M 129 E Brochure Noida Expressway, Sector 129, Noida
M3M 129 E Brochure Noida Expressway, Sector 129, Noida
 
Mahindra Happinest Tathawade Pune Brochure.pdf
Mahindra Happinest Tathawade Pune Brochure.pdfMahindra Happinest Tathawade Pune Brochure.pdf
Mahindra Happinest Tathawade Pune Brochure.pdf
 
Call Girls in Noida Sector 11 Noida 💯Call Us 🔝 9582086666 🔝 South Delhi Escor...
Call Girls in Noida Sector 11 Noida 💯Call Us 🔝 9582086666 🔝 South Delhi Escor...Call Girls in Noida Sector 11 Noida 💯Call Us 🔝 9582086666 🔝 South Delhi Escor...
Call Girls in Noida Sector 11 Noida 💯Call Us 🔝 9582086666 🔝 South Delhi Escor...
 
Listing Turkey Sylvana Istanbul - Bahcesehir
Listing Turkey Sylvana Istanbul - BahcesehirListing Turkey Sylvana Istanbul - Bahcesehir
Listing Turkey Sylvana Istanbul - Bahcesehir
 
2k Shot Call girls Karol Bagh Delhi 9205541914
2k Shot Call girls Karol Bagh Delhi 92055419142k Shot Call girls Karol Bagh Delhi 9205541914
2k Shot Call girls Karol Bagh Delhi 9205541914
 
Magarpatta Nova Elegance Mundhwa Pune E-Brochure.pdf
Magarpatta Nova Elegance Mundhwa Pune  E-Brochure.pdfMagarpatta Nova Elegance Mundhwa Pune  E-Brochure.pdf
Magarpatta Nova Elegance Mundhwa Pune E-Brochure.pdf
 
9990771857 Call Girls in Dwarka Sector 1 Delhi (Call Girls) Delhi
9990771857 Call Girls in Dwarka Sector 1 Delhi (Call Girls) Delhi9990771857 Call Girls in Dwarka Sector 1 Delhi (Call Girls) Delhi
9990771857 Call Girls in Dwarka Sector 1 Delhi (Call Girls) Delhi
 
Girls in Kalyanpuri }Delhi↫8447779280↬Escort Service. In Delhi NCR
Girls in Kalyanpuri }Delhi↫8447779280↬Escort Service. In Delhi NCRGirls in Kalyanpuri }Delhi↫8447779280↬Escort Service. In Delhi NCR
Girls in Kalyanpuri }Delhi↫8447779280↬Escort Service. In Delhi NCR
 
Kohinoor Hinjewadi Phase 2 Pune E-Brochure.pdf
Kohinoor Hinjewadi Phase 2 Pune  E-Brochure.pdfKohinoor Hinjewadi Phase 2 Pune  E-Brochure.pdf
Kohinoor Hinjewadi Phase 2 Pune E-Brochure.pdf
 
Omaxe Dwarka In Delhi E Brochure Pdf
Omaxe Dwarka In Delhi E Brochure     PdfOmaxe Dwarka In Delhi E Brochure     Pdf
Omaxe Dwarka In Delhi E Brochure Pdf
 
Telibagh & Call Girls Lucknow - 450+ Call Girl Cash Payment 🎂 8923113531 🎪 Ne...
Telibagh & Call Girls Lucknow - 450+ Call Girl Cash Payment 🎂 8923113531 🎪 Ne...Telibagh & Call Girls Lucknow - 450+ Call Girl Cash Payment 🎂 8923113531 🎪 Ne...
Telibagh & Call Girls Lucknow - 450+ Call Girl Cash Payment 🎂 8923113531 🎪 Ne...
 
Maha Mauka Squarefeet Brochure |Maha Mauka Squarefeet PDF Brochure|
Maha Mauka Squarefeet Brochure |Maha Mauka Squarefeet PDF Brochure|Maha Mauka Squarefeet Brochure |Maha Mauka Squarefeet PDF Brochure|
Maha Mauka Squarefeet Brochure |Maha Mauka Squarefeet PDF Brochure|
 
Pooja Mehta 9167673311 Get Warm Welcome By Andheri Escorts For Desired Fantasies
Pooja Mehta 9167673311 Get Warm Welcome By Andheri Escorts For Desired FantasiesPooja Mehta 9167673311 Get Warm Welcome By Andheri Escorts For Desired Fantasies
Pooja Mehta 9167673311 Get Warm Welcome By Andheri Escorts For Desired Fantasies
 

Market dynamics report

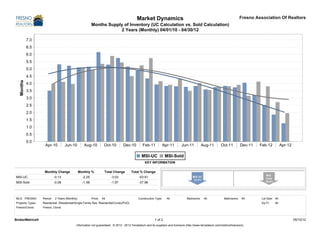
  • 1. Market Dynamics Fresno Association Of Realtors Months Supply of Inventory (UC Calculation vs. Sold Calculation) 2 Years (Monthly) 04/01/10 - 04/30/12 KEY INFORMATION Monthly Change Monthly % Total Change Total % Change MSI-UC -0.13 -2.25 -3.03 -53.91 MSI-Sold -0.08 -1.58 -1.97 -37.96 MLS: FRESNO Period: 2 Years (Monthly) Price: All Construction Type: All Bedrooms: All Bathrooms: All Lot Size: All Property Types: Residential: (Residential/Single Family Res, Residential/Condo/PUD) Sq Ft: All Fresno/Clovis: Fresno, Clovis BrokerMetrics® 1 of 2 05/10/12 Information not guaranteed. © 2012 - 2013 Terradatum and its suppliers and licensors (http://www.terradatum.com/metrics/licensors).
  • 2. Market Dynamics Fresno Association Of Realtors Months Supply of Inventory (UC Calculation vs. Sold Calculation) 2 Years (Monthly) 04/01/10 - 04/30/12 Time # For Sale Last # Under Period MSI NAR MSI Day of Month Contract # Sold Apr-12 1.3 2.0 1,196 950 612 Mar-12 1.9 2.7 1,643 885 606 Feb-12 2.5 3.8 1,912 760 503 Jan-12 3.2 4.1 2,057 645 498 Dec-11 4.1 3.2 2,103 519 667 Nov-11 3.7 3.9 2,244 602 575 Oct-11 3.8 3.8 2,342 612 615 Sep-11 3.7 3.8 2,410 643 638 Aug-11 3.6 3.6 2,470 688 695 Jul-11 3.8 4.0 2,539 664 631 Jun-11 3.8 3.5 2,637 700 756 May-11 3.8 4.3 2,682 705 617 Apr-11 3.8 3.9 2,684 702 686 Mar-11 3.9 4.2 2,709 689 652 Feb-11 4.3 5.7 2,687 618 468 Jan-11 4.9 5.2 2,707 554 517 Dec-10 5.2 4.5 2,737 530 607 Nov-10 5.8 5.4 2,956 514 543 Oct-10 5.3 5.9 3,006 568 510 Sep-10 6.2 5.4 3,078 500 575 Aug-10 5.1 4.9 3,026 588 616 Jul-10 5.1 5.1 2,973 583 586 Jun-10 5.2 4.0 2,855 547 720 May-10 5.3 4.1 2,735 515 666 Apr-10 3.5 4.0 2,619 748 657 BrokerMetrics® 2 of 2 05/10/12 Information not guaranteed. © 2012 - 2013 Terradatum and its suppliers and licensors (http://www.terradatum.com/metrics/licensors).
  • 3. Market Dynamics Fresno Association Of Realtors Supply & Demand - # Units (FS, UC, Sold) 2 Years (Monthly) 04/01/10 - 04/30/12 KEY INFORMATION Monthly Change Monthly % Total Change Total % Change For Sale -48.69 -1.21 -1,168.52 -29.09 Under Contract 8.76 1.63 210.14 39.20 Sold -1.11 -0.18 -26.57 -4.27 MLS: FRESNO Period: 2 Years (Monthly) Price: All Construction Type: All Bedrooms: All Bathrooms: All Lot Size: All Property Types: Residential: (Residential/Single Family Res, Residential/Condo/PUD) Sq Ft: All Fresno/Clovis: Fresno, Clovis BrokerMetrics® 1 of 2 05/10/12 Information not guaranteed. © 2012 - 2013 Terradatum and its suppliers and licensors (http://www.terradatum.com/metrics/licensors).
  • 4. Market Dynamics Fresno Association Of Realtors Supply & Demand - # Units (FS, UC, Sold) 2 Years (Monthly) 04/01/10 - 04/30/12 FOR SALE UNDER CONTRACT SOLD EXPIRED NEW LISTINGS Time Period # Properties Average DOM # Properties Average DOM # Properties Average DOM # Properties Average DOM # Properties Apr-12 2,357 96 950 57 612 54 211 109 714 Mar-12 2,737 101 885 55 606 68 209 116 825 Feb-12 2,822 104 760 62 503 64 150 136 765 Jan-12 2,892 110 645 72 498 61 190 140 789 Dec-11 2,853 114 519 67 667 58 231 134 609 Nov-11 3,040 108 602 59 575 60 194 146 698 Oct-11 3,192 102 612 57 615 61 238 120 782 Sep-11 3,327 101 643 61 638 60 274 132 857 Aug-11 3,455 103 688 60 695 62 297 148 916 Jul-11 3,459 103 664 62 631 61 256 125 822 Jun-11 3,626 100 700 61 756 64 289 126 944 May-11 3,649 101 705 56 617 65 262 146 965 Apr-11 3,621 102 702 70 686 67 235 140 912 Mar-11 3,710 105 689 69 652 72 312 147 1,023 Feb-11 3,586 110 618 74 468 70 281 128 879 Jan-11 3,616 113 554 69 517 73 355 132 879 Dec-10 3,716 119 530 74 607 68 449 157 760 Nov-10 3,790 117 514 71 543 68 320 137 784 Oct-10 3,935 113 568 65 510 71 361 136 857 Sep-10 3,899 112 500 65 575 75 321 137 873 Aug-10 3,932 109 588 61 616 64 318 132 959 Jul-10 3,862 109 583 61 586 64 306 143 1,007 Jun-10 3,658 110 547 58 720 60 256 133 923 May-10 3,470 110 515 65 666 61 220 132 851 Apr-10 3,624 104 748 54 657 56 257 134 1,085 BrokerMetrics® 2 of 2 05/10/12 Information not guaranteed. © 2012 - 2013 Terradatum and its suppliers and licensors (http://www.terradatum.com/metrics/licensors).
  • 5. Market Dynamics Fresno Association Of Realtors Average DOM vs. CDOM for Under Contract Properties 2 Years (Monthly) 04/01/10 - 04/30/12 KEY INFORMATION Monthly Change Monthly % Total Change Total % Change DOM -0.09 -0.14 -2.24 -3.47 CDOM -0.00 -0.00 -0.03 -0.03 MLS: FRESNO Period: 2 Years (Monthly) Price: All Construction Type: All Bedrooms: All Bathrooms: All Lot Size: All Property Types: Residential: (Residential/Single Family Res, Residential/Condo/PUD) Sq Ft: All Fresno/Clovis: Fresno, Clovis BrokerMetrics® 1 of 2 05/10/12 Information not guaranteed. © 2012 - 2013 Terradatum and its suppliers and licensors (http://www.terradatum.com/metrics/licensors).
  • 6. Market Dynamics Fresno Association Of Realtors Average DOM vs. CDOM for Under Contract Properties 2 Years (Monthly) 04/01/10 - 04/30/12 Time # Under Period Contract Avg DOM Avg CDOM Apr-12 950 57 72 Mar-12 885 55 73 Feb-12 760 62 77 Jan-12 645 72 88 Dec-11 519 67 87 Nov-11 602 59 71 Oct-11 612 57 77 Sep-11 643 61 75 Aug-11 688 60 77 Jul-11 664 62 81 Jun-11 700 61 79 May-11 705 56 77 Apr-11 702 70 88 Mar-11 689 69 85 Feb-11 618 74 98 Jan-11 554 69 91 Dec-10 530 74 94 Nov-10 514 71 90 Oct-10 568 65 78 Sep-10 500 65 85 Aug-10 588 61 75 Jul-10 583 61 72 Jun-10 547 58 69 May-10 515 65 81 Apr-10 748 54 64 BrokerMetrics® 2 of 2 05/10/12 Information not guaranteed. © 2012 - 2013 Terradatum and its suppliers and licensors (http://www.terradatum.com/metrics/licensors).
  • 7. Market Dynamics Fresno Association Of Realtors Median Price (Sold) 2 Years (Monthly) 04/01/10 - 04/30/12 KEY INFORMATION Monthly Change Monthly % Change Total Change Total % Change Sold -714.30 -0.46 -17,143.15 -10.95 MLS: FRESNO Period: 2 Years (Monthly) Price: All Construction Type: All Bedrooms: All Bathrooms: All Lot Size: All Property Types: Residential: (Residential/Single Family Res, Residential/Condo/PUD) Sq Ft: All Fresno/Clovis: Fresno, Clovis BrokerMetrics® 1 of 2 05/10/12 Information not guaranteed. © 2012 - 2013 Terradatum and its suppliers and licensors (http://www.terradatum.com/metrics/licensors).
  • 8. Market Dynamics Fresno Association Of Realtors Median Price (Sold) 2 Years (Monthly) 04/01/10 - 04/30/12 FOR SALE UNDER CONTRACT SOLD EXPIRED NEW LISTINGS Time Period Median $ # Properties Median $ # Properties Median $ # Properties Median $ # Properties Median $ # Properties Apr-12 169,900 2,357 149,900 950 150,000 612 165,000 211 163,200 714 Mar-12 159,900 2,737 144,000 885 136,880 606 158,500 209 155,000 825 Feb-12 159,000 2,822 149,900 760 145,000 503 141,450 150 149,900 765 Jan-12 155,000 2,892 142,900 645 135,000 498 167,450 190 154,500 789 Dec-11 154,900 2,853 139,500 519 142,900 667 171,950 231 149,950 609 Nov-11 155,000 3,040 152,050 602 150,000 575 159,925 194 154,900 698 Oct-11 150,850 3,192 143,700 612 143,000 615 159,000 238 140,000 782 Sep-11 154,900 3,327 146,500 643 148,250 638 159,925 274 150,000 857 Aug-11 155,000 3,455 149,925 688 150,000 695 160,000 297 149,450 916 Jul-11 154,999 3,459 144,950 664 143,000 631 159,900 256 142,200 822 Jun-11 155,000 3,626 139,900 700 140,000 756 159,900 289 153,400 944 May-11 155,000 3,649 147,500 705 147,000 617 166,750 262 149,900 965 Apr-11 155,000 3,621 149,250 702 139,900 686 159,000 235 149,900 912 Mar-11 153,450 3,710 134,900 689 144,400 652 157,950 312 149,900 1,023 Feb-11 154,925 3,586 154,900 618 142,500 468 165,000 281 154,999 879 Jan-11 155,000 3,616 155,000 554 136,000 517 169,000 355 155,800 879 Dec-10 155,700 3,716 149,900 530 152,500 607 177,000 449 144,900 760 Nov-10 159,900 3,790 150,449 514 148,000 543 169,950 320 147,300 784 Oct-10 162,000 3,935 152,500 568 155,000 510 185,000 361 149,900 857 Sep-10 165,000 3,899 157,200 500 160,000 575 174,900 321 163,000 873 Aug-10 165,000 3,932 159,900 588 155,000 616 175,000 318 158,500 959 Jul-10 169,000 3,862 159,900 583 160,000 586 185,050 306 160,000 1,007 Jun-10 170,000 3,658 162,500 547 167,000 720 204,925 256 155,500 923 May-10 175,000 3,470 171,900 515 160,000 666 189,975 220 164,900 851 Apr-10 178,975 3,624 169,900 748 150,000 657 185,000 257 172,000 1,085 BrokerMetrics® 2 of 2 05/10/12 Information not guaranteed. © 2012 - 2013 Terradatum and its suppliers and licensors (http://www.terradatum.com/metrics/licensors).
  • 9. Market Dynamics Fresno Association Of Realtors Sales Absorption 2 Years (Monthly) 04/01/10 - 04/30/12 KEY INFORMATION Monthly Change Monthly % Change Total Change Total % Change % Under Contract 0.60 5.01 14.47 120.12 % Sold 0.25 1.64 5.92 39.34 MLS: FRESNO Period: 2 Years (Monthly) Price: All Construction Type: All Bedrooms: All Bathrooms: All Lot Size: All Property Types: Residential: (Residential/Single Family Res, Residential/Condo/PUD) Sq Ft: All Fresno/Clovis: Fresno, Clovis BrokerMetrics® 1 of 2 05/10/12 Information not guaranteed. © 2012 - 2013 Terradatum and its suppliers and licensors (http://www.terradatum.com/metrics/licensors).
  • 10. Market Dynamics Fresno Association Of Realtors Sales Absorption 2 Years (Monthly) 04/01/10 - 04/30/12 Time % of Properties % of Properties # Properties # Properties # Properties Period Under Contract Sold For Sale Under Contract Sold Apr-12 40.3 26.0 2,357 950 612 Mar-12 32.3 22.1 2,737 885 606 Feb-12 26.9 17.8 2,822 760 503 Jan-12 22.3 17.2 2,892 645 498 Dec-11 18.2 23.4 2,853 519 667 Nov-11 19.8 18.9 3,040 602 575 Oct-11 19.2 19.3 3,192 612 615 Sep-11 19.3 19.2 3,327 643 638 Aug-11 19.9 20.1 3,455 688 695 Jul-11 19.2 18.2 3,459 664 631 Jun-11 19.3 20.8 3,626 700 756 May-11 19.3 16.9 3,649 705 617 Apr-11 19.4 19.0 3,621 702 686 Mar-11 18.6 17.6 3,710 689 652 Feb-11 17.2 13.0 3,586 618 468 Jan-11 15.3 14.3 3,616 554 517 Dec-10 14.3 16.3 3,716 530 607 Nov-10 13.6 14.3 3,790 514 543 Oct-10 14.4 13.0 3,935 568 510 Sep-10 12.8 14.8 3,899 500 575 Aug-10 15.0 15.7 3,932 588 616 Jul-10 15.1 15.2 3,862 583 586 Jun-10 15.0 19.7 3,658 547 720 May-10 14.8 19.2 3,470 515 666 Apr-10 20.6 18.1 3,624 748 657 BrokerMetrics® 2 of 2 05/10/12 Information not guaranteed. © 2012 - 2013 Terradatum and its suppliers and licensors (http://www.terradatum.com/metrics/licensors).