1. Cash Flow and Financial Statement
Analysis-FSA
A summary of a firm’s payments during a period of time. This statement reports cash inflows
and outflows based on the firm’s
operating activities,
investing activities, and
financing activities
Cash flow from operating activities
Inflows Outflows
From sales of goods or services To pay suppliers for inventory
From interest and dividend income To pay employees for services
To pay lenders (interest)
To pay government for taxes
To pay other suppliers for other operating expenses
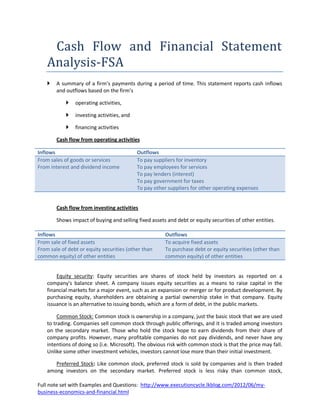
Cash flow from investing activities
Shows impact of buying and selling fixed assets and debt or equity securities of other entities.
Inflows Outflows
From sale of fixed assets To acquire fixed assets
From sale of debt or equity securities (other than To purchase debt or equity securities (other than
common equity) of other entities common equity) of other entities
Equity security: Equity securities are shares of stock held by investors as reported on a
company's balance sheet. A company issues equity securities as a means to raise capital in the
financial markets for a major event, such as an expansion or merger or for product development. By
purchasing equity, shareholders are obtaining a partial ownership stake in that company. Equity
issuance is an alternative to issuing bonds, which are a form of debt, in the public markets.
Common Stock: Common stock is ownership in a company, just the basic stock that we are used
to trading. Companies sell common stock through public offerings, and it is traded among investors
on the secondary market. Those who hold the stock hope to earn dividends from their share of
company profits. However, many profitable companies do not pay dividends, and never have any
intentions of doing so (i.e. Microsoft). The obvious risk with common stock is that the price may fall.
Unlike some other investment vehicles, investors cannot lose more than their initial investment.
Preferred Stock: Like common stock, preferred stock is sold by companies and is then traded
among investors on the secondary market. Preferred stock is less risky than common stock,
Full note set with Examples and Questions: http://www.executioncycle.lkblog.com/2012/06/my-
business-economics-and-financial.html
2. therefore investors can expect less reward. In many ways, preferred stock works like bonds. While
bonds guarantee regular interest payments, preferred stock guarantees regular dividend payments
for a specified time. Preferred stock price is less volatile than common, and virtually eliminates the
possibility of large capital gains. The bottom line is that preferred stock is less risky than common
stock. It is designed to provide an income generating opportunity for investors while raising capital
for the underlying company.
Common Equity: A measure of equity, which only takes into account the common stockholders,
and disregards the preferred stockholders. It is equal to shareholders' equity minus preferred
equity.
Preferred Equity: A measure of equity, which only takes into account the preferred stockholders,
and disregards the common stockholders. It is equal to shareholders' equity minus common equity.
Cash flow from financing activities
Shows influence of all cash transactions with shareholders and the borrowing and repaying
transactions with lenders.
Inflows Outflows
From borrowing To repay amounts borrowed
From the sale of the firm’s own equity To repurchase the firm’s own equity securities
securities To pay shareholders dividends
Indirect Method or Reconciliation Method:
Indirect method is the most widely used method for the calculation of net cash flow from
operating activities. Under this method, net cash provided or used by operating activities is
determined by adding back or deducting from net income those items that do not effect on cash.
The following are the common types of adjustments that are made to net income to arrive at net
cash flow from operating activities.
Adjustments Needed to Determine Net Cash Flow from Operating Activities Using Indirect
Method
Note: Direct and indirect methods are different only to the extent of the calculation of cash
flows from operating activities; cash flows from investing and financing activities are calculated in
the same manner.
Full note set with Examples and Questions: http://www.executioncycle.lkblog.com/2012/06/my-
business-economics-and-financial.html
3. Example:
Cash flow from operating activities:
Net income 117000
Adjustments to reconcile net income to net cash
used/provided by operating by activities:
Depreciation expenses 14,800
Amortization of trade mark 2,400
Amortization of bond premium (1,000)
Equity in earnings of Porter Co. (3,500)
Gain on condemnation of land (8,000)
Loss on sale of equipment 1,500
Increase in deferred tax liabilities 3,000
Increase in accounts receivable (net) (53,000)
Increase in inventories (152,000)
Decrease in prepaid expenses 500
Increase in accounts payable 1,000
Increase in accrued liabilities 4,000
Decrease in income tax payable (13,000) 203,500
Net cash used by operating activities (86,500)
Direct Method or Income Statement Method:
Under the direct method the statement of cash flows reports net cash flow from operating
activities as major classes of operating cash receipts (e.g., cash collected from customers and cash
received from interest and dividends) and cash disbursements (e.g., cash paid to suppliers for goods,
to employees for services, to creditors for interest, and to government authorities for taxes).
The direct method is explained on cash flow statement direct method page. This method is
illustrated here in more detail to help you understand the difference between accrual based income
and net cash flow from operating activities and to illustrate the data needed to apply the direct
method.
Full note set with Examples and Questions: http://www.executioncycle.lkblog.com/2012/06/my-
business-economics-and-financial.html
4. Suppose a company, which began business on January 1, 2005, has the following balance sheet
information:
December 31
2005 2004
Cash $159,000 0
Accounts receivable 15,000 0
Inventory 160,000 0
Prepaid expenses 8,000 0
Property, plant, and equipment (net) 90,000 0
Accounts payable 60,000 0
Accrued expenses payable 20,000 0
Company's December 31, 2005, income statement and additional information are:
Revenues from sales $780,000
Cost of goods sold 450,000
Gross profit 330,000
Operating expenses $160,000
Depreciation 10,000 170,000
Income before income taxes 160,000
Income tax expenses 48,000
Net income $112,000
Additional Information:
(a). Dividends of $70,000 were declared and paid in cash.
(b). the accounts payable increase resulted from the purchases of merchandise.
(c). Prepaid expenses and accrued expenses payable relate to operating expenses.
Full note set with Examples and Questions: http://www.executioncycle.lkblog.com/2012/06/my-
business-economics-and-financial.html
5. There are two key factors for business survival:
Profitability is important if the business is to generate revenue (income) in excess of the
expenses incurred in operating that business.
The solvency of a business is important because it looks at the ability of the business in meeting
its financial obligations.
Financial Statements
A financial statement is a complication of data, which is logically and consistently organized
according to the accounting principles.
Its purpose is to convey an understanding of some financial aspects of a business firm.
Financial statements are the major means through which firms present their financial situation
to stockbrokers, creditors and the general public.
The majority of firms include extensive financial statements in their annual reports, which are
distributed widely.
Who analyzes financial statements?
Internal users (i.e. management)
External users (i.e. Investors, creditors, regulatory agencies, stock market analysts and
auditors)
Internal users use it for planning, evaluating and controlling company operations.
External users use it for assessing past performance and current financial position and
making predictions about the future profitability and solvency of the company as well as
evaluating the effectiveness of management.
Effective Financial Statement Analysis
To perform an effective financial statement analysis, you need to be aware of,
individual organisational factors,
o business strategy
o objectives
o Annual report and other documents like articles about the organization in
newspapers and business reviews.
External factors,
o Understand the nature of the industry in which the organisation works. This is
an industry factor.
o Understand that the overall state of the economy may also have an impact on
the performance of the organisation.
Full note set with Examples and Questions: http://www.executioncycle.lkblog.com/2012/06/my-
business-economics-and-financial.html
6. Principal Tools of Analysis
Financial Ratio Analysis
Comparative financial statements analysis:
o Horizontal analysis/Trend analysis
o Vertical analysis/Common size analysis/ Component Percentages
Ratio Analysis
Computation is simple but interpretation is difficult.
Usefulness of ratios depends on their intelligence and skillful interpretation.
Helps in valuing firms quantitatively.
Working capital = Current assets – current liabilities
Kh ySñfhda Kh .e;sfhda
Liabilities Asserts
Profitability Ratios
Liquidity or Short-Term Solvency ratios
Asset Management or Activity Ratios
Financial Structure or Capitalisation Ratios
Market Test Ratios
Full note set with Examples and Questions: http://www.executioncycle.lkblog.com/2012/06/my-
business-economics-and-financial.html
7. Liquidity Ratios
Liquidity implies a firm’s ability to pay its debts in the short run.
Short-term liquidity involves the relationship between current assets and current liabilities.
If a firm has sufficient net working capital (excess of current assets over current liabilities), it is
assumed to have enough liquidity.
Current Ratio:
current _ assets(CA)
current _ ratio
curren _ liabilitie s(CL)
Ideally, this has to be around two, but it usually depends on the industry we are talking. If it is
less than 1 it simply means that the company is in a great risk. If it is 1 it is again at some risk if
debtors do not pay their part in the correct date. If it is above 2 that simply means there are too
many current assets and the company may not be efficiently using its current assets or its short-
term financing facilities. This may also indicate problems in working capital management.
Quick Ratio (Acid test)
Quick _ assets
Quick _ ratio
Current _ Liabilitie s
current _ assets Inventories
Quick _ ratio
CL
Ideal value for this is 1. In finance, the “Acid-test” or quick ratio or liquid ratio measures the
ability of a company to use its near cash or quick assets to extinguish or retire its current liabilities
immediately. Quick assets include those current assets that presumably can be quickly converted to
cash at close to their book values. A company with a Quick Ratio of less than 1 cannot currently pay
back its current liabilities. Note that Inventory is excluded from the sum of assets financially.
Financial Structure or Capitalisation Ratios
𝐷𝑒𝑏𝑡
𝐷𝑒𝑏𝑡/𝐸𝑞𝑢𝑖𝑡𝑦 𝑟𝑎𝑡𝑖𝑜 =
𝐸𝑞𝑢𝑖𝑡𝑦
𝐷𝑒𝑏𝑡
𝐷𝑒𝑏𝑡/𝑇𝑜𝑡𝑎𝑙 𝐴𝑠𝑠𝑒𝑡𝑠 𝑟𝑎𝑡𝑖𝑜 = ∗ 100
𝑇𝑜𝑡𝑎𝑙 𝐴𝑠𝑠𝑒𝑡𝑠
𝐸𝑞𝑢𝑖𝑡𝑦
𝐸𝑞𝑢𝑖𝑡𝑦 𝑟𝑎𝑡𝑖𝑜 = ∗ 100
𝑇𝑜𝑡𝑎𝑙 𝐴𝑠𝑠𝑒𝑡𝑠
Full note set with Examples and Questions: http://www.executioncycle.lkblog.com/2012/06/my-
business-economics-and-financial.html
8. 𝐸𝑎𝑟𝑛𝑖𝑛𝑔𝑠 𝑏𝑒𝑓𝑜𝑟𝑒 𝐼𝑛𝑡𝑒𝑟𝑒𝑠𝑡 𝑎𝑛𝑑 𝑇𝑎𝑥
𝑇𝑖𝑚𝑒𝑠 𝐼𝑛𝑡𝑒𝑟𝑒𝑠𝑡 𝐸𝑎𝑟𝑛𝑒𝑑 =
𝐼𝑛𝑡𝑒𝑟𝑒𝑠𝑡
In finance, capital structure refers to the way a corporation finances its assets through some
combination of equity, debt, or hybrid securities. A firm's capital structure is then the composition
or 'structure' of its liabilities. For example, a firm that sells $20 billion in equity and $80 billion in
debt is said to be 20% equity-financed and 80% debt-financed. The firm's ratio of debt to total
financing, 80% in this example is referred to as the firm's leverage. In reality, capital structure may
be highly complex and include dozens of sources. Gearing Ratio is the proportion of the capital
employed of the firm which come from outside of the business finance, e.g. by taking a short-term
loan etc.
Each of these ratios gives valuable information about the company. As example Debt/Equity
ratio, measures the relationship between debt and equity. A ratio of 1 indicates that debt and
equity funding are equal (i.e. there is $1 of debt to $1 of equity) whereas a ratio of 1.5 indicates
that there is higher debt gearing in the business (i.e. there is $1.5 of debt to $1 of equity). This
higher debt gearing is usually interpreted as bringing in more financial risk for the business
particularly if the business has profitability or cash flow problems.
Asset Management or Activity Ratios
Measures the speed at which inventory is converted to sales and/or Debtors converted to cash.
Asset Management Ratios attempt to measure the firm's success in managing its assets to generate
sales. For example, these ratios can provide insight into the success of the firm's credit policy and
inventory management. These ratios are also known as Activity or Turnover Ratios.
Net _ credit _ sales
Debtors _ turnover _ ratio ( DTR)
Average _ debtors
360
Average _ collection _ period
Debtors _ turnover _ ratio
Normally there is a defined average collection period for the company by rules. We will compare
realized average collection period with that. If the average collection period is 30 days and the
realized average collection period is 60 days. It will say few things about the company collection.
Collection job is poor (debt collector & collection)
Difficulties in obtaining prompt payments
Customers face financial problems
Full note set with Examples and Questions: http://www.executioncycle.lkblog.com/2012/06/my-
business-economics-and-financial.html
9. Average creditors
Average payment period 360
Purchases
cos t _ of goods _ sold
Inventory _ turnover
average _ inventory
NOTE: Here you can also use the ‘inventory instead’ of ‘average inventory’, but we have to
mention that in the calculation.
Measures how fast the inventory moving through the firm and generating sales. This is
important because of two reasons. We have to make sure that we do not run out stock due to
low inventory. Moreover, in the same time we have to make sure that we avoid excessive
carrying charge because of high inventory.
Profitability/Efficiency Ratios
Measure the efficiency of the firm’s activities and its ability to generate profits (profit per unit
sold).
Gross _ profit
Gross _ profit _ m arg in
Sales
Net _ profit
Net _ profit _ m arg in
Sales
Gross profit (Also called "gross margin" and "gross income”): A company's revenue minus its
cost of goods sold. Gross profit is a company's residual profit after selling a product or service and
deducting the cost associated with its production and sale. To calculate gross profit: examine the
income statement, take the revenue and subtract the cost of goods sold.
Net profit (Also called net income or net earnings): Often referred to as the bottom line, net
profit is calculated by subtracting a company's total expenses from total revenue, thus showing
what the company has earned (or lost) in a given period of time (usually one year).
Sales
Asset _ turnover _ ratio
Average _ assets
Profits generated are compared with the amount invested by owners and creditors.
It is required to generate adequate profits per unit asset otherwise; assets are misused
or under-utilized.
Full note set with Examples and Questions: http://www.executioncycle.lkblog.com/2012/06/my-
business-economics-and-financial.html
10. 𝐸𝑎𝑟𝑛𝑖𝑛𝑔 𝑏𝑒𝑓𝑜𝑟 𝑖𝑛𝑡𝑒𝑟𝑒𝑛𝑡 𝑐𝑎𝑟𝑔𝑒𝑠 𝑎𝑛𝑑 𝑡𝑎𝑥𝑖𝑠𝑎𝑡𝑖𝑜𝑛
𝐸𝑎𝑟𝑛𝑖𝑛𝑔 𝑃𝑜𝑤𝑒𝑟 =
𝐴𝑣𝑒𝑟𝑎𝑔𝑒 𝑡𝑜𝑡𝑎𝑙 𝑎𝑠𝑠𝑒𝑡𝑠
Earning Power Measures the operating business performance, this is not affected by interest
charges and taxation.
Net _ income
Re turn _ on _ equity
Average _ equity
Return on equity is an important profit indicator for shareholders.
Market Test Ratios
Market test ratios will help the stockholders to analyze their present and future
investment in the firm.
Compare the investment value with factors such as debt, dividends, earnings etc.
𝑁𝑒𝑡 𝑃𝑟𝑜𝑓𝑖𝑡 𝑎𝑓𝑡𝑒𝑟 𝑡𝑎𝑥
𝐸𝑎𝑟𝑛𝑖𝑛𝑔𝑠 𝑝𝑒𝑟 𝑠𝑎𝑟𝑒 =
𝑁𝑢𝑚𝑏𝑒𝑟 𝑜𝑓 𝑖𝑠𝑠𝑢𝑒𝑑 𝑜𝑟𝑑𝑖𝑛𝑎𝑟𝑦 𝑠𝑎𝑟𝑒𝑠
𝐷𝑖𝑣𝑖𝑑𝑒𝑛𝑑𝑠
𝐷𝑖𝑣𝑖𝑑𝑒𝑛𝑑𝑠 𝑝𝑒𝑟 𝑠𝑎𝑟𝑒 =
𝑁𝑢𝑚𝑏𝑒𝑟 𝑜𝑓 𝑖𝑠𝑠𝑢𝑒𝑑 𝑜𝑟𝑑𝑖𝑛𝑎𝑟𝑦 𝑠𝑎𝑟𝑒𝑠
𝐷𝑖𝑣𝑖𝑑𝑒𝑛𝑑𝑠 𝑝𝑒𝑟 𝑠𝑎𝑟𝑒
𝐷𝑖𝑣𝑖𝑑𝑒𝑛𝑑 𝑝𝑎𝑦𝑜𝑢𝑡 𝑟𝑎𝑡𝑖𝑜 = ∗ 100
𝐸𝑎𝑟𝑛𝑖𝑛𝑔𝑠 𝑝𝑒𝑟 𝑠𝑎𝑟𝑒
𝑀𝑎𝑟𝑘𝑒𝑡 𝑝𝑟𝑖𝑐𝑒 𝑝𝑒𝑟 𝑠𝑎𝑟𝑒
𝑃𝑟𝑖𝑐𝑒 𝐸𝑎𝑟𝑛𝑖𝑛𝑔𝑠 𝑟𝑎𝑡𝑖𝑜 =
𝐸𝑎𝑟𝑛𝑖𝑛𝑔𝑠 𝑝𝑒𝑟 𝑠𝑎𝑟𝑒
Du Pont Analysis
Analyze return ratios in terms of profit margin and turnover ratios.
DuPont analysis tells us that ROE is affected by three things:
Operating efficiency, which is measured by profit margin
Asset use efficiency, which is measured by total asset turnover
Financial leverage, which is measured by the equity multiplier
Full note set with Examples and Questions: http://www.executioncycle.lkblog.com/2012/06/my-
business-economics-and-financial.html
11. ROE = Profit Margin (Profit/Sales) * Total Asset Turnover (Sales/Assets) * Equity Multiplier
(Assets/Equity)
les
𝑁𝑒𝑡 𝑃𝑟𝑜𝑓𝑖𝑡𝑠 𝑆𝑎𝑙𝑒𝑠 𝐴𝑣𝑒𝑟𝑎𝑔𝑒 𝐴𝑠𝑠𝑒𝑡𝑠
𝑅𝑒𝑡𝑢𝑟𝑛 𝑜𝑛 𝐸𝑞𝑢𝑖𝑡𝑦 = ∗ ∗
𝑠𝑎𝑙𝑒𝑠 𝐴𝑣𝑒𝑟𝑎𝑔𝑒 𝐴𝑠𝑠𝑒𝑡𝑠 𝐴𝑣𝑒𝑟𝑎𝑔𝑒 𝐸𝑞𝑢𝑖𝑡𝑦
Issues in FSA
Comparability between periods. The company preparing the financial statements may have
changed the accounts in which it stores financial information, so that results may differ from
period to period. For example, an expense may appear in the cost of goods sold in one period,
and in administrative expenses in another period.
Comparability between companies. An analyst frequently compares the financial ratios of
different companies in order to see how they match up against each other. However, each
company may aggregate financial information differently, so that the results of their ratios are
not really comparable. This can lead an analyst to draw incorrect conclusions about the results
of a company in comparison to its competitors.
Operational information. Financial analysis only reviews a company's financial information, not
its operational information, so you cannot see a variety of key indicators of future performance,
Full note set with Examples and Questions: http://www.executioncycle.lkblog.com/2012/06/my-
business-economics-and-financial.html
12. such as the size of the order backlog, or changes in warranty claims. Thus, financial analysis only
presents part of the total picture.
Interpretation of results - Variability in interpretations
Correlation among ratios - Degree of correlation
Development of benchmarks
o Many firms operate in different industries.
o Proportions of operation
Window dressing
o Shows a better picture than what actually exists
o Makes no sense in analyzing
NOTE: Strong financial statement analysis does not necessarily mean that the organisation has a
strong financial future. Financial statement analysis might look good but other factors that can
cause an organisation to collapse.
Common size Income statement
Common size income statement is an income statement in which each account is expressed as a
percentage of the value of sales. This type of financial statement can be used to allow for easy analysis
between companies or between time periods of a company.
“Common size income statement” analysis allows an analyst to determine how the various
components of the income statement affect a company's profit.
Full note set with Examples and Questions: http://www.executioncycle.lkblog.com/2012/06/my-
business-economics-and-financial.html
13. Common size Balance sheet
Common size Balance sheet is a company balance sheet that displays all items as percentages of
a common base figure. This type of financial statement can be used to allow for easy analysis
between companies or between time periods of a company.
In the normal balance sheet, account values are expressed in dollar terms, while in the common
size one, each value is listed as a percentage of total assets. This is also done for liabilities, where
each liability account is a percentage of total liabilities.
◦ Important analysis for comparative purposes “Over time” and For “different sized
enterprises“
Horizontal Analysis
Horizontal analysis is the comparison of historical financial information over a series of reporting
periods, or of the ratios derived from this financial information. The analysis is most commonly a
simple grouping of information that is sorted by period, but the numbers in each succeeding period
can also be expressed as a percentage of the amount in the baseline year, with the baseline amount
being listed as 100%.
Read more at: http://www.accountingtools.com/horizontal-analysis
Horizontal Analysis of the Income Statement
Horizontal analysis of the income statement is usually in a two-year format, such as the one
shown below, with a variance also shown that states the difference between the two years for each
line item. An alternative format is to simply add as many years as will fit on the page, without
showing a variance, so that you can see general changes by account over multiple years. A third
format is to include a vertical analysis of each year in the report, so that each year shows expenses
as a percentage of the total revenue in that year.
Full note set with Examples and Questions: http://www.executioncycle.lkblog.com/2012/06/my-
business-economics-and-financial.html
14. It should be possible to calculate the ratios when the FSs are given. Here is an example of doing
that.
Full note set with Examples and Questions: http://www.executioncycle.lkblog.com/2012/06/my-
business-economics-and-financial.html