Personalizzazione della terapia del Diabete Mellito - Gastrolearning®
•
2 j'aime•884 vues

Gastrolearning VII lezione Personalizzazione della terapia del Diabete Mellito - Prof. S. Del Prato (Università di Pisa) www.gastrolearning.it

Recommandé
Recommandé
Contenu connexe
Tendances
Tendances (20)
Similaire à Personalizzazione della terapia del Diabete Mellito - Gastrolearning®
Similaire à Personalizzazione della terapia del Diabete Mellito - Gastrolearning® (20)
Plus de Gastrolearning
Plus de Gastrolearning (20)
Dernier
Dernier (20)
Personalizzazione della terapia del Diabete Mellito - Gastrolearning®
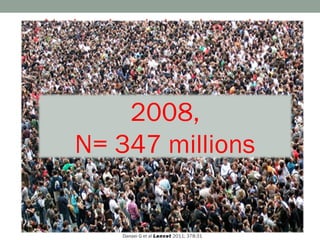
- 1. National and global trends in diabetes prevalence 1980-2008 2008, N= 347 millions 1980, N= 153 millions Danaei G et al Lancet 2011; 378:31
- 2. National and global trends in diabetes prevalence 1980-2008 Effective preventive interventions are needed, and health systems should prepare to detect and manage diabetes and its sequelae Danaei G et al Lancet 2011; 378:31
- 3. National and global trends in diabetes prevalence 1980-2008 Effective preventive interventions are needed, and health systems should prepare to detect and manage diabetes and its sequelae Danaei G et al Lancet 2011; 378:31
- 4. National and global trends in diabetes prevalence 1980-2008 Effective preventive interventions are needed, and health systems should prepare to detect and manage diabetes and its sequelae Danaei G et al Lancet 2011; 378:31
- 5. Macrovascular and microvascular complications occur frequently in people with diabetes Macrovascular Microvascular Prevalence (% patients) Heart Chest CHD CHF Stroke Kidney Foot Eye attack pain Complications CHD = Coronary heart disease CHF = Congestive heart failure Deshpande AD, et al. Phys Ther 2008;88:1254
- 6. Hazard ratios for major causes of death, according to baseline levels of fasting glucose The Emerging Risk Factors Collaboration. N Engl J Med 2011;364:829-841
- 7. ACCORD, ADVANCE & VADT – Effect of intesive treatment on glycemic control ACCORD VADT ADVANCE
- 8. Effect of intensive glucose control in T2DM patients Primary Outcome Mortality HR 95% CI P HR 95% CI P VADT 1 0.87 0.73-1.04 NS VADT 1 1.0650.801-1.416 NS ACCORD 2 0.90 0.78-1.04 NS ACCORD 2 1.22 1.01-1.46 0.04 ADVANCE 30.94 0.84-1.06 NS ADVANCE 30.93 0.83-1.06 NS 0.5 1.0 2.0 0.5 1.0 2.0 W. Duckworth et NEJM 2009;359:156; 2The ACCORD Study Group NEJM 2008;358:2545; 1 3 The ADVANCE Collaborative Group N EJM 2008,358:2560
- 9. Failure to observe reduction in macrovascular events in ACCORD, ADVANCE, and VADT • Wrong sample size …major CV risk factors already intensively treated factors already • Wrong drug …insulin and insulin providing drugs and insulin drugs • Wrong hypothesis …glycemia is not a major CV risk factor • Wrong patient population …advanced ATS in long standing T2DM patients T2DM
- 10. VADT in the context of the “natural history” of Type 2 diabetes Generate a Generate a Drive risk for Drive risk for negative negative complications complications “legacy” “legacy” HbA1c (%) TIME (years since diagnosis) Del Prato S. Diabetologia 2009;52:1219
- 11. Long-Term Effects of Intensive Glucose in Newly Diagnosed Type 2 Diabetic Patients Intensive (SU/Ins) vs. Conventional glucose control HR (95%CI) HR (95%CI) NNT 29.4 for 10 yrs* Intensive (metformin) vs. Conventional glucose control HR (95%CI) NNT HR (95%CI) 14 for 10 yrs* Holman RR et al. N Engl J Med. 2008;359:1577–1589 *De Vries JH Diabetologia. 2011;54:705–706
- 12. The lesson of the intervention trials • Aim at near-normal glycemic • Aim at near-normal glycemic control control • Adopt an uncompromised • Adopt an uncompromised • Intensify CV risk factor Rx • Intensify CV risk factor Rx therapeutic insistence • Assess risk:benefit ratio METABOLIC – HEMODYNAMIC ALTERATIONS therapeutic insistence • Assess risk:benefit ratio • Consider pathophysiological • Consider pathophysiological • Individualize therapy • Individualize therapy Dysglycemia basis (insulin resistance and β- basis (insulin resistance and β- Diabetes • Consider anti- • Consider anti- cell dysfunction) cell dysfunction) hyperglycemic vs. hyperglycemic vs. • Individualize therapy hypoglycemic agents Relative Risk • Individualize therapy hypoglycemic agents • Treat promptly all CV risk • Treat promptly all CV risk factors factors CVD 1.0 Plasma Glucose
- 13. Management of Hyperglycemia in Type 2 Diabetes: A Patient- Centered Approach Diabetes Care – Diabetologia June 2012
- 14. Glycaemic targets in diabetes. The ADA/AHA position statement A1c <7.0% A1cA1c >7.0% • >7.0% • Short duration of diabetes • History of severe • Long life expectancy hypoglycemia • No significant • Limited life expectancy cardiovascular disease • Long-standing diabetes • Advanced micro- and MAY GAIN ADDITIONAL macrovascular MICROVASCULAR BENEFIT AS WELL complications AS MACROVASCULAR PROTECTION Patient’s phenotype B =body weight B Skyler J, et al Diabetes Care 2009;32:187
- 15. Beyond the ADA/EASD algorithm
- 16. The A1C and ABCD of glycaemia management in T2DM: a physician’s personalized approach Age Age MIDDLE MIDDLE ELDERL ELDERL YOUNG YOUNG AGE AGE Y Y Complications* or Complications* or Disease duration Disease duration >10yrs >10yrs – – + + – – + + – – + + A1c target 6.5- 6.5- 7.0- 7.0- A1c target <6.0 <6.0 <6.5 <6.5 <6.5 <6.5 <7.0 <7.0 7.0 7.0 8.0 8.0 A1c at A1c at <9.0% <9.0% >9.0 >9.0 diagnosis diagnosis Initial Initial Metformi Metformi Consider Consider therapy therapy n n insulin insulin *Micro- and macrovascular complications Pozzilli P …. Del Prato S Diabetes Metab Res Rev 2010; 26:239
- 17. Effect of noninsulin antidiabetic drugs added to metformin on glycemic control -0,8 Phung OJ et al JAMA 2010; 303:1410
- 18. The A1C and ABCD of glycaemia management in T2DM: a physician’s personalized approach AGE BODY WEIGHT COMPLICATION DURATION
- 19. The A1C and ABCD of glycaemia management in T2DM: a physician’s personalized approach AGE BODY WEIGHT COMPLICATION DURATION
- 20. Glycaemic control and all-cause mortality – A U shaped curve? 100 90 Age at baseline (years) 80 70 60 50 40 Currie JE et al Lancet 2010; 375:481
- 21. Glycaemic control and all-cause mortality – A U shaped curve? 100 90 Age at baseline (years) 80 70 60 50 40 Currie JE et al Lancet 2010; 375:481
- 22. Glycaemic control and all-cause mortality – A U shaped curve? Currie JE et al Lancet 2010; 375:481
- 23. High prevalence of T2DM in the elderly population 20 17.6 18 16 14.9 Prevalence (%) 14 12 10 7.9 8 6 4 2.1 2 0.2 0 12–19 20–39 40–59 60–74 ≥75 Age (years) National Health and Nutrition Examination Survey (NHANES) 2005–2006. T2DM=type 2 diabetes mellitus. Adapted from Cowie CC, et al. Diabetes Care. 2009;32:287–294.
- 24. The management of T2DM in the elderly is challenging Risk factors Geriatric syndromes Ageing Depression Diabetes Disability complications Comorbidity Malnutrition Increased Urinary Hyperglycaemia incontinence mortality Hypoglycaemia Falling Lack of Cognitive social support impairment Ageing, diabetic microvascular and macrovascular complications, hyperglycaemia, hypoglycaemia, multiple morbidity and lack of social support are risk factors for the geriatric syndromes T2DM=type 2 diabetes mellitus. Araki A, Ito H. Geriatr Gerontol Int. 2009;9:105–114.
- 25. The Consequences of Hypoglycaemia Hospitalisation Coma 3 costs4 Cardiovascular Death2,3 complications3 Weight gain by Increased risk defensive eating5 of dementia1 HYPOGLYCAEMIA Loss of Reduced consciousness3 quality of life7 Increased risk Increased risk of car accident6 of seizures3 1 Whitmer RA, et al. JAMA. 2009;301:1565–1572; 2Bonds DE, et al. BMJ. 2010;340:b4909; 3 Barnett AH. Curr Med Res Opin. 2010;26:1333–1342; 4Jönsson L, et al. Value Health . 2006;9:193–198; 5Foley JE, Jordan J. Vasc Health Risk Manag . 2010;6:541–548; 6Begg IS, et al. Can J Diabetes. 2003;27:128–140; 7McEwan P, et al. Diabetes Obes Metab . 2010;12:431–436.
- 26. ADVANCE – Association of severe hypoglycemia with the risk of an adverse clinical outcome or death Zoungas S. et al N Engl J Med 2010;363:1410
- 27. The risk of severe hypoglycaemia: post hoc epidemiological analysis of the ACCORD study Miller ME et al . BMJ 2010;340: b5444 C D B C P<0.0001 A P=0.01 P=0.03 P<0.03 P<0.0001 P<0.0001 P<0.0001 Diabetes duration BMI Serum creatinine (years) (kg/m ) 2 (µmol/l) *History of peripheral neuropathy (yes vs. no); **per 1 year increase
- 28. Antidiabetic agents and risk of hypoglycemia High risk Low risk Insulin therapy1 1 Metformin6 6 Sulphonylureas2 2 a-glucosidase inhibitors7 7 Glinides (less than SUs)1,3 1,3 Thiazolidinediones6,8 6,8 Drug-drug interaction can GLP-1 agonists9 9 potentiate hypoglycemia4,5 4,5 DPP-4 inhibitors10-12 10-12 1. Henderson JN, et al. Diabet Med. 2003;20:1016; 2. Bolen S, et al. Ann Intern Med. 2007;147:386; 3. Kahn SE, et al. N Engl J Med. 2006;355:2427; 4. Krentz AJ, Bailey CJ. Drugs. 2005;65:385; 5. Prandin® (repaglinide) package insert. Novo Nordisk; June 2006; 6. Kahn SE, et al. N Engl J Med. 2006;355:2427; 7. Cefalu WT. Nature. 2007;81:636; 8. Bolen S, et al. Ann Intern Med . 2007;147:386; 9. DeFronzo RA, et al. Diabetes Care. 2005;28:1092; 10. Stonehouse A. Curr Diabetes Rev 2008;4:101; 11. Aschner P et al. Diabetes Care. 2006; 29:2632; 12. Rosenstock J et al. Diabetes Obes Metab 2008;10:376.
- 29. Vildagliptin in the very elderly T2DM patients ∆ HBA1c ∆ Body Weight Achieving A1c ≤7.0 Hypoglycemia Age ≥75 yr (MonoRx, N=62; Add-on, N=25) Age <75 yr (MonoRx, N=2303; Add-on, N=910) Schweizer A et al. Diabetes Obes Metab 2011; 13:55
- 30. The A1C and ABCD of glycaemia management in T2DM: a physician’s personalized approach AGE BODY WEIGHT COMPLICATION DURATION
- 31. The A1C and ABCD of glycaemia management in T2DM: a physician’s personalized approach AGE BODY WEIGHT COMPLICATION DURATION
- 32. Frequency distribution of BMI and waist circumference in T2DM patients. The Pisa Diabetes Survey Women (n.918) Men (n. 680) 200 200 160 160 BMI Count Count 120 120 m±sd: 80 80 28.7±8.2 range: 16-52 40 40 0 0 15 20 25 30 35 40 45 50 55 15 20 25 30 35 40 45 50 55 200 200 160 160 Count 120 Waist Count 120 80 m±sd:106.0±12.3 80 range: 70-156 40 40 0 0 60 80 100 120 140 160 60 80 100 120 140 160
- 33. Frequency distribution of BMI and waist circumference in T2DM patients. The Pisa Diabetes Survey Women (n.918) Men (n. 680) 200 200 160 160 BMI Count Count 120 120 m±sd: 80 80 28.7±8.2 range: 16-52 40 40 0 0 15 20 25 30 35 40 45 50 55 15 20 25 30 35 40 45 50 55 200 200 160 160 Count 120 Waist Count 120 80 m±sd:106.0±12.3 80 range: 70-156 40 40 0 0 60 80 100 120 140 160 60 80 100 120 140 160
- 34. Frequency distribution of BMI and waist circumference in T2DM patients. The Pisa Diabetes Survey Women (n.918) Men (n. 680) 200 200 160 160 BMI Count Count 120 120 m±sd: 80 80 28.7±8.2 range: 16-52 40 40 0 0 15 20 25 30 35 40 45 50 55 15 20 25 30 35 40 45 50 55 200 200 160 160 Count 120 Waist Count 120 80 m±sd:106.0±12.3 80 range: 70-156 40 40 0 0 60 80 100 120 140 160 60 80 100 120 140 160
- 35. Frequency distribution of BMI and waist circumference in T2DM patients. The Pisa Diabetes Survey
- 36. Baseline BMI is associated with increased CV mortality in treatment trials* 0.40 (logarithmically transformed) MentelHenzel-Odds Ratio 0.32 0.24 0.16 0.08 0.00 -0.08 -0.16 -0.24 -0.32 -0.40 27.2 27.7 28.2 28.7 29.2 29.7 30.2 30.7 31.2 31.7 32.2 BMI at baseline (Kg/m2) *UKPDS Group. Lancet 1998;352:837; UKPDS Group Lancet 1998;352:854; Darmandy JA et al Lancet 2005;366:1279; ADVANCE Collaborative Group. N Engl J Med 2008;358:2560; ACCORD Study Group. N E ngl J Med 2008;358:2545. Duckworth et al N Engl J Med 2009;360:129. Mannucci E. et al Nutr Metab Cardiovasc Dis. 2009 May 7. [Epub ahead of
- 37. Pooled between-group differences in body weight with monotherapy and combination therapies. Bennett WL et al Ann Intern Med. 2011;154:602-613.
- 38. Effect of noninsulin antidiabetic drugs added to metformin on glycemic control Phung OJ et al JAMA 2010 ; 303:1410
- 39. T2DM treatment – a composite endpoint ↓=BMI ↑BMI ↓HYPOs ↑HYPOs Efficacy Efficacy
- 40. The A1C and ABCD of glycaemia management in T2DM: a physician’s personalized approach AGE BODY WEIGHT COMPLICATIONS DURATION
- 41. The A1C and ABCD of glycaemia management in T2DM: a physician’s personalized approach AGE BODY WEIGHT COMPLICATIONS DURATION
- 42. The Renal Insufficiency And Cardiovascular Events (RIACE) Italian multicentre study eGFR <60 ml/min Both Albuminuria 100 80 60 Percent 40 20 0 ≤45 46-60 61-75 >75 n. 113 (21.4%) n. 1,067 (26.8%) n. 3,100 (37.0%) n. 1,628 (56.4%) n. 528 n. 3,986 n. 8,374 n. 2,885 RIACE Study Group, unpublished data
- 43. Tolerability and efficacy of vildagliptin in T2DM patients with moderate or severe renal insufficiency a Number of patients ≥65 years with moderate RI were 113 (vildagliptin) and 102 (placebo) and with severe RI were 64 (vildagliptin) and 46 (placebo). AEs=adverse events; RI=renal impairment; SAEs=serious adverse events; vilda=vildagliptin. Lukashevich V et al Diabet Obes Metab 2011;13:942
- 44. Tolerability and efficacy of vildagliptin in T2DM patients with moderate or severe renal insufficiency Moderate RI Severe RI Mean Change from Between-treatment Mean Change from Between-treatment Baseline to End Point Difference vs Placebo Baseline to End Point Difference vs Placebo N= 157 128 N= 122 95 BL= 7.86 7.79 BL= 7.69 7.65 Adjusted Mean Change from Adjusted Mean Change from Baseline in HbA1c (%) * Baseline in HbA1c (%) * Vildagliptin 50 mg once daily Placebo *P <0.0001 vs placebo. Full analysis set. BL=baseline; HbA1c=haemoglobin A1c; RI=renal impairment; T2DM=type 2 diabetes mellitus. Lukashevich V et al Diabet Obes Metab 2011;13:942
- 45. Most prescribed medications in diabetis persons – ARNO 2010 Atorvastatin (s) Atorvastatin (s) Metoprolol (s) Metoprolol (s) Rosuvastatin (s) Rosuvastatin (s) Warfarin (s) Warfarin (s) Simvastatin (s) Simvastatin (s) Diltiazem (s) Diltiazem (s) Carbamazepine Carbamazepine Phenobarbital Phenobarbital Phentoyn Phentoyn Clarithromycin Clarithromycin Phluoxetine Phluoxetine Erythromycin Erythromycin Midazolam (s) Midazolam (s) Fluconazole Fluconazole Ketoconazole Ketoconazole Rifampicin Rifampicin Dexamethasone Dexamethasone Diclofenac Diclofenac (s) – substrate; – inhibitor; –cythocrome p-450 inducer
- 46. Interaction of DPP4 Inhibitors with Cytochrome p450 Vildagliptin Sitagliptin Saxagliptin Substrate for CYP3A4 No Low Yes CYP3A5 No No Yes CYP2C8 No Very low No Dose proportion Yes Yes Yes Meal effect No No No Drug interaction No No Yes Dose reduction with No No Yes (2.5 mg) CYP3A4 inhibitors Scheen A J. Diabetes, Obesity and Metabolism 2010; 12:648–658
- 47. UKPS 23: Risk Factors for CHD HbA1c (%) Age (yrs) Systolic BP (mmHg) LDL-cholesterol mmol/l) Turner RC et al BMJ 316:823-828, 1999
- 48. Metformin: a multitasking medication FA Insulin action Insulin sensitivity glucose LDL production body weight PAI-1 Metformin Insulin action β-cell function • antioxidant effects • neutralisation of AGE Insulin adhesion molecule secretion* differentiation of inflammatory cells into macrophages lipolysis improved microcirculation * Indirectly through reduced glucotoxicity or GLP-1 enhancement; ** Independently of glycemic lowering ?
- 49. AMI, stroke, CHF and all-cause mortality in elderly medicare patients treated with pio- or rosiglitazone Bone fracture! Heart failure! Graham at al., JAMA 2007; 304:411
- 50. Potential cardiovascular protective properties of incretin-based therapies INCRETIN-BASED THERAPY METABOLIC EFFECTS CV EFFECTS Glycemic control Endothelial function = Body weight Anti-ischemic effect Blood pressure Angiogenesis CV risk factors Myocardial lipid profile lipid profile metabolism inflammation inflammation Cardiac function
- 51. Ongoing pre- and post-approval outcome studies Source: clinicaltrials.goc and sponsor’s web sites
- 52. The A1C and ABCD of glycaemia management in T2DM: a physician’s personalized approach AGE BODY WEIGHT COMPLICATIONS DURATION
- 53. The A1C and ABCD of glycaemia management in T2DM: a physician’s personalized approach AGE BODY WEIGHT COMPLICATION DURATION
- 54. The lesson of the intervention trials Reducing hypoglycemia Reducing hypoglycemia Preventing body weight Preventing body weight METABOLIC – HEMODYNAMIC ALTERATIONS gain gain Dysglycemia Diabetes Increase adherence Increase adherence Relative Risk Reduce clinical inertia Reduce clinical inertia CVD 1.0 Plasma Glucose
- 55. Association between A1C and adherence 8.8 8.0 Adjusted A1c (%) 7.2 6.4 5.6 -0.15% per 10% increase in adherence -0.15% per 10% increase in adherence 4.8 4.0 0 10 20 30 40 50 60 70 80 90 100 Adherence(%) Adjusted for Baseline A1C and the ODM Regimen* Rozenfeld Y. Am J Manag Care. 2008;14: 71
- 56. Insulin sensitivity and secretion in individuals with different degrees of glucose tolerance with ( ) and without ( ) family history for T2DM HOMA IR β-index Log [pmol insulin.120min-1 .m-2] NGT IGT DM NGT IGT DM NGT, normal glucose tolerance; IGT, impaired glucose tolerance; IR, insulin resistance Del Prato S, Marchetti P, Bonadonna RC. Diabetes 2002; 51 (Suppl 1):S109
- 57. Sulfonylurea-induced beta-cell apoptosis in cultured human islets Solvent Repaglinide 0.01 µM Control GLP-1–treated cells Day 1 Nateglinide 10 µM Glibenclamide 0.1 µM Day 3 Day 5 Maedler K, et al. J Clin Endocrinol Metab . 2005;90:501 Farilla L et al. E ndocrinology . 2003;144:5149
- 58. VERIFY Vildagliptin Efficacy in combination with metfoRmIn For earlY treatment of T2DM Circa 2000 mostly drug-naïve T2DM patients HbA1c 6.5% to 7.5% 1:1 randomization 5-year follow-up Multinational double-blind, parallel group study To test the hypothesis whether early treatment combination with VILDA-MET will result in lower treatment failure rate or in lower rate of loss in glycemic control (HbA1c) over time than with MET alone.
- 59. VERIFY Vildagliptin Efficacy in combination with metfoRmIn For earlY treatment of T2DM Other objectives include evaluation of rate of fasting plasma glucose (FPG) progression over time, change in HbA1c over time, time to insulin initiation, development or progression of micro- and macrovascular complications, changes in body weight, HOMA-B/IR, health status, safety and tolerability Insulin secretion rate relative to glucose (ISR/G) oral glucose insulin sensitivity (OGIS) microalbuminuria tests retinal photography with microaneurism counts
- 60. The A1C and ABCD of glycaemia management in T2DM: a physician’s personalized approach AGE BODY WEIGHT COMPLICATION DURATION tiology E ducation conomy
- 61. The evolving complexity of T2DM pathogenesis accounts for treatment evolution Islet b-cell DPP4-I DPP4-I DPP4-I DPP4-I GLP-1 agonists GLP-1 agonists GLP-1 agonists GLP-1 agonists GK agonists GK agonists Bile acid sequestrants Bile acid sequestrants TZDs Increased TZDs GPRs, IL-receptor GPRs, IL-receptor Dual/Pan PPARs Dual/Pan PPARs Impaired Lipolysis antagonist antagonist Decreased 11βHSD-I 11βHSD-I Insulin Secretion Incretin Effect Islet a-cell DPP4-I DPP4-I GLP-1 agonists GLP-1 agonists SGLT2-I SGLT2-I Glucagon receptor Glucagon receptor antagonist antagonist Increased Increased Glucose Glucagon Reabsorption Secretion TZDs TZDs Metformin Metformin Dual/Pan PPARs Dual/Pan PPARs GK agonists GK agonists Metformin Metformin Glucagon receptor Glucagon receptor antagonists antagonists Bromocriptin Bromocriptin Increased HGP Decreased Glucose Neurotransmitter Dysfunction Uptake
- 62. The evolving complexity of T2DM pathogenesis accounts for treatment evolution Islet b-cell DPP4-I DPP4-I DPP4-I DPP4-I GLP-1 agonists GLP-1 agonists GLP-1 agonists GLP-1 agonists GK agonists GK agonists Bile acid sequestrants Bile acid sequestrants TZDs Increased TZDs GPRs, IL-receptor Impaired GPRs, IL-receptor Dual/Pan PPARs Dual/Pan PPARs Lipolysis antagonist antagonist Decreased 11βHSD-I 11βHSD-I Insulin Secretion Incretin Effect Islet a-cell DPP4-I DPP4-I GLP-1 agonists GLP-1 agonists SGLT2-I SGLT2-I Glucagon receptor Glucagon receptor antagonist antagonist Increased Increased Glucose Glucagon Reabsorption Secretion TZDs TZDs Metformin Metformin Dual/Pan PPARs Dual/Pan PPARs GK agonists GK agonists Metformin Metformin Glucagon receptor Glucagon receptor antagonists antagonists Bromocriptin Bromocriptin Increased HGP Decreased Glucose Neurotransmitter Dysfunction Uptake
- 63. A roadmap for selecting antihyperglycemic agents for treatment of Type 2 diabetes *potential β-cell protection? Adapted from Drucker DJ et al Diabetes Care 2010; 33:428
- 64. Conclusion While we await for effective and safe preventative approaches we must appreciate that pharmacologic intervention together with lifestyle modification: •Can provide strict and long-term glycemic control •This may not necessarily ensure clear cut benefits in term of long-term complications, unless •Proper therapy is initiated early in the course of the disease •Individualized early intervention can be more effective though not necessarily simpler
- 65. Glucose lowering management in Type 2 diabetes - the way forward
- 66. Glucose lowering management in Type 2 diabetes - the way forward B C D A E Etiology Complications Education Body Diabetes Age Economy Weight Duration
- 67. The A1C and the diabetes alphabet Foot care Quality of life Guidelines Risk of CV disease Hypoglycemia Statins Insulin Treat-to-target Liver steatosis Urgency Monitoring Validation Organization W Prevention Y Z
- 68. The A1C and the diabetes alphabet Foot care Quality of life Guidelines Risk of CV disease Hypoglycemia Statins Insulin Treat-to-target Liver steatosis Urgency Monitoring Validation Organization Win against diabetes Prevention Y Z
- 69. The A1C and the diabetes alphabet Foot care Quality of life Guidelines Risk of CV disease Hypoglycemia Statins Insulin Treat-to-target Liver steatosis Urgency Monitoring Validation Organization Win against diabetes Prevention You are the specialists Z
- 70. The A1C and the diabetes alphabet Foot care Quality of life Guidelines Risk of CV disease Hypoglycemia Statins Insulin Treat-to-target Liver steatosis Urgency Monitoring Validation Organization Win against diabetes Prevention You are the specialists ZZZZZZZZZZZZZZZZZZZZ ZZ
Notes de l'éditeur
- Using the UKPDS follow-up data [6], Yudkin et al. calculated the NNT for 10 years to prevent one myocardial infarction or stroke to be 29.4 [1]. This number relates to the sulfonylurea– insulin group. In the metformin group, the corresponding NNT is 14. Moreover, the 10 year NNT to prevent one death was 29 in the sulfonylurea–insulin and 14 in the metformin group.
- Overview of anti-hyperglycemic therapy in T2DM (Figure 2.) What follows are variations of this figure to help guide the clinician in choosing agents which may be most appropriate under certain situations: to avoid weight gain, to avoid hypoglycemia, and to minimize costs.
- Total 43% >60 32,5
- Patients with normoalbuminuric stages 3-5 CKD had lower rate of cardiovascular disease than those with albuminuric stages 3-5 CKD but higher rate than subjects with stages 1-2 CKD.
- Similar incidence of hypoglycemia in Vilda and Pbo patients with severe RI Slightly higher incidence of hypoglycemia in Vilda vs. Pbo patients with moderate RI Lower HbA1c in Vilda patients compared to Pbo Majority of patients with hypoglycemia (>90%) had background insulin
- Vildagliptin increases pancreatic beta cell mass in neonatal rats Histological and morphometric analysis of pancreatic islets from neonatal rats (n =6/group/timepoint) that were treated once daily with vehicle or vildagliptin (60 mg/kg) for 19 days from day 2 to day 20 and pancreatic tissues were analyzed 24 h after the last dose. All bar graphs at the left panel show quantitation of A. BrdU-positive cells per insulin-positive islet area (1X10 5 μ M); B. Apoptag-positive cells per insulin-positive islet area (1X10 5 μM); and C. Beta cell mass (mg). The middle and right panels show photomicrographs of histological representation of A. BrdU-immuno-positive, B. Apoptag-immuno-positive islet cells at day 7 and C. insulin-immuno-positive islet cells at day 21 from vehicle and vildagliptin treated rats. Arrows indicate the positively stained cells. Values are expressed as the mean ± S.E.M., *P<0.05; **P<0.01. These data show that the DPP-4 inhibitor vildagliptin increased pancreatic beta cell mass through enhanced beta cell replication and reduced apoptosis. The increased beta cell mass was sustained for 12 days after vildagliptin washout. This study demonstrates that DPP-4 inhibitors can elicit beneficial effects on beta cell turnover that could help to prevent or retard the progression of type 2 diabetes. Reference Duttaroy A. et al. European Journal of Pharmacology. 2011; 650: 703–707