Cybersecurity Awareness Training Presentation v2024.03
Private Equity Returns Continue to be Impacted By Falling Valuations and Limited Exit Opportunities
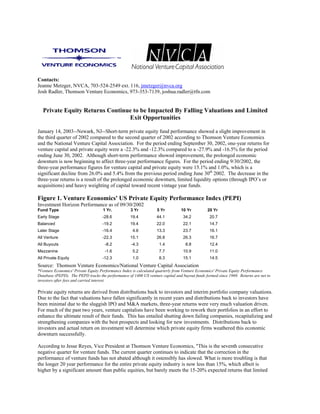
1. Contacts:
Jeanne Metzger, NVCA, 703-524-2549 ext. 116, jmetzger@nvca.org
Josh Radler, Thomson Venture Economics, 973-353-7139, joshua.radler@tfn.com
Private Equity Returns Continue to be Impacted By Falling Valuations and Limited
Exit Opportunities
January 14, 2003--Newark, NJ--Short-term private equity fund performance showed a slight improvement in
the third quarter of 2002 compared to the second quarter of 2002 according to Thomson Venture Economics
and the National Venture Capital Association. For the period ending September 30, 2002, one-year returns for
venture capital and private equity were a -22.3% and -12.3% compared to a -27.9% and -16.5% for the period
ending June 30, 2002. Although short-term performance showed improvement, the prolonged economic
downturn is now beginning to affect three-year performance figures. For the period ending 9/30/2002, the
three-year performance figures for venture capital and private equity were 15.1% and 1.0%, which is a
significant decline from 26.0% and 5.4% from the previous period ending June 30th 2002. The decrease in the
three-year returns is a result of the prolonged economic downturn, limited liquidity options (through IPO’s or
acquisitions) and heavy weighting of capital toward recent vintage year funds.
Figure 1. Venture Economics' US Private Equity Performance Index (PEPI)
Investment Horizon Performance as of 09/30/2002
Fund Type 1 Yr. 3 Yr 5 Yr 10 Yr 20 Yr
Early Stage -28.6 19.4 44.1 34.2 20.7
Balanced -19.2 19.4 22.0 22.1 14.7
Later Stage -16.4 4.6 13.3 23.7 16.1
All Venture -22.3 15.1 26.8 26.3 16.7
All Buyouts -8.2 -4.3 1.4 8.8 12.4
Mezzanine -1.6 5.2 7.7 10.9 11.0
All Private Equity -12.3 1.0 8.3 15.1 14.5
Source: Thomson Venture Economics/National Venture Capital Association
*Venture Economics' Private Equity Performance Index is calculated quarterly from Venture Economics' Private Equity Performance
Database (PEPD). The PEPD tracks the performance of 1400 US venture capital and buyout funds formed since 1969. Returns are net to
investors after fees and carried interest.
Private equity returns are derived from distributions back to investors and interim portfolio company valuations.
Due to the fact that valuations have fallen significantly in recent years and distributions back to investors have
been minimal due to the sluggish IPO and M&A markets, three-year returns were very much valuation driven.
For much of the past two years, venture capitalists have been working to rework their portfolios in an effort to
enhance the ultimate result of their funds. This has entailed shutting down failing companies, recapitalizing and
strengthening companies with the best prospects and looking for new investments. Distributions back to
investors and actual return on investment will determine which private equity firms weathered this economic
downturn successfully.
According to Jesse Reyes, Vice President at Thomson Venture Economics, quot;This is the seventh consecutive
negative quarter for venture funds. The current quarter continues to indicate that the correction in the
performance of venture funds has not abated although it ostensibly has slowed. What is more troubling is that
the longer 20 year performance for the entire private equity industry is now less than 15%, which albeit is
higher by a significant amount than public equities, but barely meets the 15-20% expected returns that limited
2. partners had when making these investments. While the final outcome may ultimately redeem these
investments, it does appear that it will be an uphill climb to meet investor expectations.quot;
“It will likely take several years for short-term private equity performance to return back to normal levels as it
will take sometime for company valuations to rise and the IPO and M&A markets to recover. Today, venture
capitalists are focused on building strong, sustainable businesses so that when liquidity options do emerge, they
will be able to produce attractive returns for their investors,” explained Mark G. Heesen, president of the
National Venture Capital Association.
Figure 2. Third Quarter Company Valuations
Time Period Avg Val ($Millions) Median ($Millions)
2000-3 83.63 37
2001-3 51.73 26
2002-3 35.26 24.45
Comparison of Recent Funds to their Predecessors after 3 Years of Activity
Venture funds have lives on average of 10-12 years. Their performance during their first three years of
investment activity are difficult to measure and volatile. This is because significant investment has been made
in young companies that are generally pre-revenue, pre-profit, and often pre-proof-of-concept. Analyzing the
performance of young funds does not accurately predict the ultimate performance of the funds.
However, in the current challenging times of falling portfolio company valuations and limited opportunities for
exits, it is worth looking at the early performance of recent funds and comparing them to their predecessors.
For example, after 3 years of their activity, 1996 vintage year funds had returned 1.17 times the original
investment to the investors. In addition, companies remaining in the portfolios had a remaining combined
valuation of 4.03 times the original investment. We know now that 1996 vintage year funds as a group
performed extremely well.
More recent funds are challenged. At the 3-year mark, vintage year 1998 funds have returned 59 cents on the
original investment dollar and the remaining companies in the portfolio had a valuation (residual value) of 94
cents on the dollar. The 1999 funds as a group are even more challenged with a combined paid amount and
residual value at only 67 cents on the original investment dollar.
Figure 3. Results for Selected Vintage Years--Three Years from Inception
Venture Funds
(Vintage Measurement Realized Unrealized Total Return
Year) Date (3 years TVPI=DPI+RVPI
from inception) (times)
Year of Return Return
Fund (DPI) (RVPI)
Formation (times) (times)
1984 12/31/1987 0.05 1.00 1.05
1990 12/31/1993 0.14 0.99 1.13
1996 12/31/1999 1.17 4.03 5.20
1998 12/31/2001 0.59 0.94 1.53
1999 09/30/2002 0.16 0.51 0.68
Source: Thomson Venture Economics/National Venture Capital Association
DPI (distributed to paid-in) = ratio of distributions paid out to investors to the original invested capital
RVPI (residual value to paid-in) = ratio of remaining portfolio holdings as valued by the venture firm to the original invested capital
TVPI (total value to paid-in) = ratio of distributed and undistributed portfolio value to the original invested capital
The National Venture Capital Association (NVCA) represents more than 450 venture capital and private
equity firms. The NVCA’s mission is to foster the understanding of the importance of venture capital to the
3. vitality of the U.S. and global economies, to stimulate the flow of equity capital to emerging growth companies
by representing the public policy interests of the venture capital and private equity communities at all levels of
government, to maintain high professional standards, to facilitate networking opportunities, and to provide
research data and professional development for its members. For more information about the NVCA, please
visit www.nvca.org.
Thomson Venture Economics, a Thomson Financial company, is the foremost information provider for equity
professionals worldwide. Venture Economics offers an unparalleled range of products from directories to
conferences, journals, newsletters, research reports, and the Venture Expert™ database. For over 35 years,
Venture Economics has been tracking the venture capital and buyouts industry. Since 1961, it has been a
recognized source for comprehensive analysis of investment activity and performance of the private equity
industry. Venture Economics maintains a long-standing relationship within the private equity investment
community, in-depth industry knowledge, and proprietary research techniques. Private equity managers and
institutional investors alike consider Venture Economics information to be the industry standard. For more
information about Venture Economics, please visit www.ventureeconomics.com.
Thomson Financial
Thomson Financial (www.thomsonfinancial.com), is a US$1.6 billion provider of information and technology
solutions to the worldwide financial community. Through the widest range of products and services in the
industry, Thomson Financial helps clients in more than 70 countries make better decisions, be more productive
and achieve superior results. Thomson Financial is part of The Thomson Corporation (www.thomson.com), a
leading provider of value-added information, software applications and tools to more than 20 million users in
the fields of law, tax, accounting, financial services, higher education, reference information, corporate training
and assessment, scientific research and healthcare. The Corporation reported 2001 revenues of US$7.2 billion
and its common shares are listed on the New York and Toronto stock exchanges (NYSE: TOC; TSX: TOC).