
Recommandé
Contenu connexe
Tendances
Tendances (16)
En vedette
Similaire à Project management
Similaire à Project management (20)
Dernier
Dernier (20)
Project management
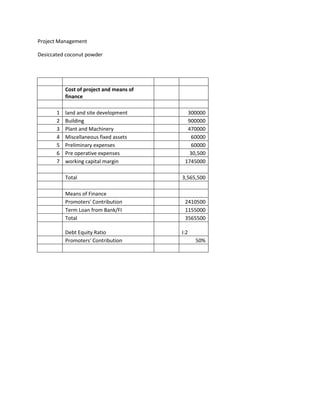
- 1. Project Management Desiccated coconut powder Cost of project and means of finance 1 land and site development 300000 2 Building 900000 3 Plant and Machinery 470000 4 Miscellaneous fixed assets 60000 5 Preliminary expenses 60000 6 Pre operative expenses 30,500 7 working capital margin 1745000 Total 3,565,500 Means of Finance Promoters' Contribution 2410500 Term Loan from Bank/FI 1155000 Total 3565500 Debt Equity Ratio I:2 Promoters' Contribution 50%
- 2. PROFITABILITY CALCULATIONS Particulars /YEAR I II III IV V 200 200 200 200 200 Installed Capacity Tonnes Tonnes Tonnes Tonnes Tonnes 120 150 156 160 164 Production tonnes tonnes tonnes tonnes tonnes Capacity Utilization 60% 75% 78% 80% 82% A Sales Realisation 10075000 15000000 15600000 16000000 16400000 B Cost of production Raw and Packing Materials 7800000 9750000 10000000 10200000 10400000 Utilities 48000 60000 65000 70000 72000 Salaries 366000 450000 500000 530000 550000 Stores and Spares 36000 48000 52000 55000 60000 Repairs & Maintenance 48000 66000 70000 80000 90000 Selling Expenses @ 17.5% 1005000 1260000 1300000 1400000 1500000 Administrative Expenses 75000 100000 150000 180000 200000 Total 9378000 11734000 12137000 12515000 12872000 Profit before Interest & C Depreciation 697000 3266000 3463000 3485000 3528000 D Total financial expenses Interest on Term Loan 138600 129937.5 95287.5 60637.5 25987.5 Interest on bank borrowing 120000 138000 142500 144000 146250 Interest On Term Loans Loans o/s at Total Loan o/s Loans o/s at the end of Interest for Interest for interest at the the end of second half the first half the second for term Year beginning first half year year year half year loan I 1155000 1155000 1155000 69300 69300 138600 II 1155000 1155000 1010625 69300 60637.5 129937.5 I 1010625 866250 721875 51975 43312.5 95287.5 IV 721875 577500 433125 34650 25987.5 60637.5 V 433125 288750 144375 17325 8662.5 25987.5 VI 144375 0 0 8662.5 0 8662.5
- 3. working Capital Requirements Particulars period(months) I II III IV V 1 Raw materials 1.5 2 Stock in Process 1 100000 120000 120000 120000 120000 3 Finished Goods 0.5 60000 64000 70000 72000 75000 Total Current Assets 160000 184000 190000 192000 195000 10075000 15000000 15600000 16000000 16400000 less Margin for working capital of long term sources(25% of total current assets) 40000 46000 47500 48000 48750 Bank Finance for working Capital 120000 138000 142500 144000 146250 Depreciation Asset valuation for depreciation A. purpose Share of pre Basic operative Share of contigency Asset Expenses cost cost margin Total 1 land and site development 300000 2 Building 900000 3 Plant and Machinery 470000 1670000