Scanning the Internet for External Cloud Exposures via SSL Certs
Gender selection-2011
1. PRENATAL DIAGNOSIS
Prenat Diagn 2011; 31: 560–565.
Published online 27 March 2011 in Wiley Online Library
(wileyonlinelibrary.com) DOI: 10.1002/pd.2747
Distortions of sex ratios at birth in the United States;
evidence for prenatal gender selection†
James F. X. Egan1 *, Winston A. Campbell1 , Audrey Chapman2 , Alireza A. Shamshirsaz1 ,
Padmalatha Gurram1 and Peter A. Benn3
1
Department of Obstetrics and Gynecology, University of Connecticut Health Center, Farmington, CT 06030, USA
2
Department of Community Medicine and Health Care, University of Connecticut Health Center, Farmington, CT 06030, USA
3
Department of Genetics and Developmental Biology, Division of Human Genetics, University of Connecticut Health Center,
Farmington, CT 06030, USA
Objective The normal male to female livebirth sex ratio ranges from 1.03 to 1.07. Higher ratios in China,
India and Korea reflect prenatal sex selection. We reviewed sex ratios for US births to investigate potential
prenatal sex selection.
Methods We reviewed all US livebirths from 1975 to 2002 using National Center for Health Statistics birth
certificates in 4-year intervals. We compared the sex ratios of Blacks, Chinese, Filipinos, Asian Indians and
Koreans relative to Whites. We also compared the sex ratios by birth order for first, second and third and more
births (third+) from 1991 to 2002.
Results The male to female sex ratio from 1975 to 2002 was 1.053 for Whites, 1.030 (p < 0.01) for Blacks,
1.074 (p < 0.01) for Chinese and 1.073 (p < 0.01) for Filipinos. From 1991 to 2002, the sex ratio increased
from 1.071 to 1.086 for Chinese, 1.060 to 1.074 for Filipinos, 1.043 to 1.087 for Asian Indians and 1.069
to 1.088 for Koreans. The highest sex ratios were seen for third+ births to Asian Indians (1.126), Chinese
(1.111) and Koreans (1.109).
Conclusion The male to female livebirth sex ratio in the United States exceeded expected biological variation
for third+ births to Chinese, Asian Indians and Koreans strongly suggesting prenatal sex selection. Copyright
2011 John Wiley & Sons, Ltd.
KEY WORDS: male sex selection; prenatal diagnosis; ultrasound
INTRODUCTION provide the choice for the termination of a female fetus,
was widely available.
Although contemporary laws in these countries have
Male sex selection at birth has been well-documented in made discrimination against women illegal, there is still
China, India, Korea and some other countries (Hesketh evidence for continuing prenatal sex selection in areas of
and Xing, 2006). The cultural basis for this in China China and India (Park and Cho, 1995; George, 2006; Zhu
and Korea is rooted in the tenets of Confucianism, et al., 2009). A distortion in the sex ratio for a country
which mandate a strict patrilineal inheritance (Chung or a population has many social and ethical implications.
and Das Gupta, 2007; Das Gupta, 2009) Sons were
The potential consequences of a surplus of males include
also traditionally responsible for the care of elders
fewer women to marry, long-term economic stresses
in the family and daughters were effectively lost to
associated with declining population numbers, more
their parents after they married. This social structure
mental health problems, increased mobility and violence
made producing and raising male children the most
in young men devoid of family responsibilities and a
important role for women in the family. The explanation
growing sex industry with coercion and trafficking of
for India may be more complex but probably also
women.(Hesketh et al., 2005; Hesketh and Xing, 2006)
reflects similar patrilineal values (Das Gupta, 1987)
The sex ratio is defined as the ratio of male births
Although these cultural preferences for male children
existed for centuries, it was not until the 1980s that to female births. The sex ratio at birth ranges from
the technology for prenatal sex selection, i.e. second 1.03 to 1.07 in most western industrialized countries
trimester ultrasound to determine fetal sex and thereby with a median of 1.059 (Parazzini et al., 1998; United
Nations, Department of Economic and Social Affairs,
2008). Sex ratios generally decline with increasing
*Correspondence to: James F. X. Egan, Department of Obstetrics parity and increasing age (Mathews and Hamilton,
and Gynecology, University of Connecticut Health Center, 263 2005). A reversal of this normal trend in the sex ratio
Farmington Avenue, Farmington, CT 06030, USA. with increasing parity might be indicative of prenatal
E-mail: jegan@uchc.edu
† An abstract with some of the data contained in this article was sex selection because it may be motivated by parents
presented as a poster at the 31st Annual Meeting of the Society wishing to be assured that there is a male heir.
of Maternal–Fetal Medicine, February 11, 2011 in San Francisco, Mathews and Hamilton(2005) analyzed trends in the
CA, USA. sex ratios for US births from 1910 to 2002. They noted
Copyright 2011 John Wiley & Sons, Ltd. Received: 3 February 2011
Revised: 23 February 2011
Accepted: 24 February 2011
Published online: 27 March 2011
2. DISTORTIONS OF SEX RATIOS AT BIRTH IN THE UNITED STATES 561
a high sex ratio for births to Chinese mothers (1.074)
and Filipino mothers (1.072) but did not separately
analyze other Asian minorities where gender selection
is common or consider patterns associated with birth
order in these populations. We reanalyzed the sex ratios
in US births from 1975 to 2002 for various populations
and sex ratios by birth order to determine if there were
patterns consistent with prenatal sex selection.
METHODS
Various definitions of the sex ratio at birth are available
(male to female, males per 100 females, males per 1000
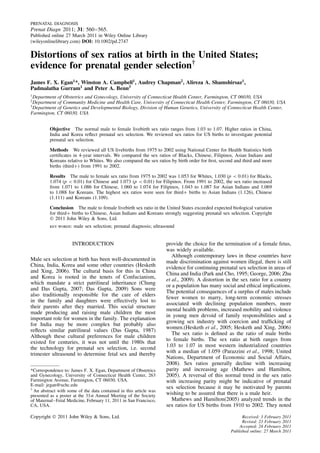
females and female to male). We defined the sex ratio Figure 1—Male to female sex ratios at birth in the United States in
4-year intervals from 1975 to 2002 by selected races
as the number of male births divided by the number of
female births (Davis et al., 1998).
Using data from the US National Center for Health
we used a two-tailed test with p < 0.01 considered sig-
Statistics (NCHS) from 1975 to 2002, we recorded
nificant. For the more limited analyses that evaluated
the birth sex ratios by maternal race and nationality
whether there was an excess of males with higher par-
and birth order and grouped them into 4-year intervals
ity, we compared the ratios using a one-tailed test with
(Centers for Disease Control and Prevention, National
p < 0.05 considered significant.
Center for Health Statistics, 1975–1990; Centers for
This data is publicly available, de-identified data so
Disease Control and Prevention, National Center for
our institutional human subject review board approval
Health Statistics, 1990–2006). We included singleton
was not required.
and multiple births and also tracked maternal place
of birth. Maternal race and nationality was based on
birth certificate data and may include individuals of
mixed race. Through 2002, NCHS classified mothers RESULTS
by a discrete race and/or nationality category, i.e. there
was no overlap in the groups reported. For example,
‘White’ excludes all Asian and Pacific Islanders. Some The male/female sex ratio for all 105 939 732 US births
race/nationality classifications changed during the study, from 1975 to 2002 was 1.050. The ratio declined from
so certain categories were only available for limited 1.053 in 1975–1978 to 1.048 in 1995–1998 before
time periods. We confined our analysis to those Asian returning to 1.053 in 1999–2002. For White births,
populations residing in the United States with the highest the ratio declined from 1.058 in 1975–1978 to 1.050
numbers of births. We assumed that the reporting of in 1999–2002 (Figure 1). At the same time, the ratio
gender at birth was equally accurate for all populations for Black births increased from 1.028 in 1975–1978 to
and all time intervals included in this study. 1.032 in 1999–2002 and this was significantly different
Ratios for Black, Chinese, Filipino, Asian Indian and from White births for all quadrennials (Table 1). The
Korean were compared to those reported for White highest ratios were seen in several Asian-American
births. We also determined sex ratios by birth order populations. Ratios exceeded 1.08 for Filipinos from
for first, second and third or more children (third+), 1983 to 1990 and Chinese from 1995 to 1998. Chinese
the mother’s place of birth (i.e. in the 50 United had significantly higher sex ratios when compared to
States and the District of Columbia, or elsewhere) and White births for quadrennial intervals from 1991 to 2002
singleton and multiple births from 1991 to 2002 by race but there was no significant difference for 1975–1990.
and nationality. The quadrennial data for 1975–2002 Filipino populations also showed significantly elevated
allowed the analysis of race/nationality for many groups, ratios for the time periods of 1983–1990 and 1995–2002
but 1991–2002 was the only time period where data for (Table 1).
parity was available for these specific Asian and Pacific From 1991 to 2002, NCHS provided additional
Island populations in the United States. nationality sub-categories allowing the analyses to
Because the data is an entire population, statistical include Asian Indians and Koreans (Figure 2). Through-
sampling errors are not present and the results can be out this time period, both Asian Indian and Korean births
interpreted directly. However, we also used the statistical showed higher sex ratios relative to Whites, but these
test of proportions suggested by Mathews and Hamilton differences only reached statistical significance for the
(2005) where the data is considered to be one possible 1991–1994 quadrennial (Table 1).
set of outcomes that could have arisen in similar cir- For 1991–2002, information was also available for
cumstances. This provided a measure of the strength of sex ratios by birth order. Figure 3 compares the sex
the observed patterns given the size of the populations. ratio in first versus second and subsequent births.
For the large number of comparisons involving differ- For both White and Black populations, there was a
ences in the sex ratio for populations relative to White, statistically significant decrease in sex ratio for second
Copyright 2011 John Wiley & Sons, Ltd. Prenat Diagn 2011; 31: 560–565.
DOI: 10.1002/pd
3. 562 J. F. X. EGAN et al.
Ratio m/f
1.093∗
1.080∗
1.080
1.071
Korean
24 329
33 269
40 132
97 730
Total
Ratio m/f
1.069∗
1.068∗
1.072
1.066
Indian Asian
32 673
65 097
102 328
200 098
Total
Figure 2—Male to female sex ratios at birth in the United States in
4-year intervals from 1991 to 2002 by maternal race with a focus on
mothers of Asian or Pacific Island origin
Ratio m/f
1.081∗
1.081∗
1.069∗
1.074∗
1.073∗
1.064
1.075
1.064
Filipino
Table 1—Sex ratios at birth in 4-year groups by maternal race/ethnicity in the United States from 1975 to 2002
50 572
61 792
81 512
98 603
115 324
124 328
128 268
660 399
Total
Ratio m/f
1.080∗
1.081∗
1.078∗
1.074∗
1.055
1.074
1.060
1.072
Chinese
39 605
52 138
66 704
85 916
99 667
112 372
128 198
584 600
Total
Figure 3—Male to female sex ratio by birth order (first and second+)
in the United States by maternal race with a focus on mothers of Asian
or Pacific Island origin from 1991 to 2002. ∗ Significantly different
Racial/ethnic data was not available for Indian Asians and Koreans from 1975 to 1990.
when compared to White
Ratio m/f
∗
1.030∗
1.031∗
1.030∗
1.031∗
1.031∗
1.032∗
1.030∗
and subsequent births, relative to that seen for first births.
1.028
In contrast to this decrease, the male/female sex ratio for
second and subsequent births increased relative to first
Black
births for Chinese, Filipino, Asian Indian and Korean
populations. For Asian Indians, the sex ratio in second
2 408164
17 036 546
2 121 821
2 347 909
2 671 001
2 651 501
2 407 735
2 428 415
and more births was 1.087 (p < 0.01) and for Chinese
Total
was 1.086 (p < 0.05) and for Filipino, it was 1.073
(p < 0.05) (Table 2).
Figure 4 shows a further division of the sex ratios
by birth order comparing first, second and third or
Ratio m/f
higher livebirths. The highest ratios were seen for
1.053
1.058
1.056
1.055
1.054
1.052
1.050
1.050
third+ births to Asian Indians (1.147), Chinese (1.101)
and Koreans (1.140) for 1991–1994. These data show
White
considerable differences between race/nationality in the
sex ratios for first, second and third+ births. For Asian
∗ p < 0.01, for two-tailed test.
84 136 302
10 491 596
11 557 875
11 789 564
12 521 278
12 713 788
12 383 309
12 678 892
Indians, the very high rate for third+ births declined in
Total
each successive quadrennial although the ratio for first
pregnancies increased. For Koreans, there also appeared
to be a trend toward more normal sex ratios over time
m/f, male/female.
(Table 2).
1975–1978
1979–1982
1983–1986
1987–1990
1991–1994
1995–1998
1999–2002
The mother’s place of birth from 1991 to 2002
was in the 50 states or the District of Columbia for
Total
82.1% of Whites, 89.7% of Blacks, 9.6% of Chinese,
Year
17.9% of Filipinos, 5.2% of Asian Indians and 5.3%
Copyright 2011 John Wiley & Sons, Ltd. Prenat Diagn 2011; 31: 560–565.
DOI: 10.1002/pd
4. DISTORTIONS OF SEX RATIOS AT BIRTH IN THE UNITED STATES 563
Table 2—Male to female (m/f) ratio at birth of first births, second, third + (i.e. third or more) and all births subsequent to first
births (i.e. second +) in the United States by selected races from 1991 to 2002
Year Total Ratio m/f Total Ratio m/f Total Ratio m/f total ratio m/f
White First Second Third + All subsequent to First
1991–1994 4 093 864 1.059 3 716 627 1.052 4 486 387 1.046 8 203 014 1.049
1995–1998 4 130 400 1.056 3 679 125 1.051 4 471 840 1.044 8 150 965 1.047
1999–2002 4 186 856 1.056 3 779 526 1.051 4 657 455 1.043 8 436 981 1.046
1991–2002 12 411 120 1.057 11 175 278 1.051 13 615 682 1.044 24 790 960 1.047
Black
1991–1994 693 374 1.043 622 637 1.030 1 063 065 1.026 1 685 702 1.028
1995–1998 728 003 1.042 616 486 1.031 1 039 877 1.023 1 656 363 1.026
1999–2002 719 449 1.038 624 424 1.036 1 073 512 1.025 1 697 936 1.029
1991–2002 2 140 826 1.041 1 863 547 1.032 3 176 454 1.025 5 040 001 1.028
Chinese
1991–1994 34 346 1.082 28 761 1.055 20 305 1.101 49 066 1.074
1995–1998 44 585 1.069 39 510 1.084 27 542 1.103∗ 67 052 1.092∗
1999–2002 51 873 1.065 44 401 1.086 31 659 1.089 76 060 1.087∗
1991–2002 130 804 1.071 112 672 1.077 79 506 1.097 192 178 1.086∗
Filipino
1991–1994 59 126 1.060 48 733 1.062 54 557 1.069 103 290 1.066
1995–1998 47 219 1.054 38 239 1.089∗ 38 295 1.068 76 534 1.079
1999–2002 47 027 1.066 40 063 1.084 40 744 1.072 80 807 1.078
1991–2002 153 372 1.060 127 035 1.077∗ 133 596 1.070 260 631 1.073∗
Asian Indian
1991–1994 13 297 1.026 10 752 1.063 8 370 1.147∗ 19 122 1.099∗
1995–1998 26 170 1.024 21 609 1.086∗ 16 970 1.128∗ 38 579 1.105∗
1999–2002 44 186 1.060 33 354 1.059 24 472 1.089∗ 57 826 1.071
1991–2002 83 653 1.043 65 715 1.068∗ 49 812 1.112∗ 115 527 1.087∗
Korean
1991–1994 9 516 1.085 8 686 1.071 5 942 1.140 14 628 1.098
1995–1998 12 630 1.045 11 579 1.095∗ 8 822 1.119∗ 20 401 1.105∗
1999–2002 16 096 1.077 13 412 1.077 10 484 1.052 23 896 1.066
1991–2002 38 242 1.069 33 677 1.082 25 248 1.095 58 925 1.088
We compared the first to each of the other groups.
∗ p ≤ 0.05 for one-tailed test.
of Koreans. The percentages of all livebirths that were 1.08 have been found and these have been interpreted
twins or higher order multiples from 1991 to 2002 as having arisen through prenatal gender selection (Park
were 2.8% for Whites, 3.1% for Blacks, 2.2% for and Cho, 1995; George, 2006; Hesketh and Xing, 2006;
Chinese, 1.9% for Filipinos, 2.6% for Asian Indians Sahni et al., 2008; Zhu et al., 2009). Our analyses show
and 1.8% for Koreans. In all the above categories, that there are also significant differences in the male to
the male to female sex ratio was lower for multiples female sex ratio at birth for different populations in the
than singletons, specifically Whites 1.013 to 1.052, United States. For some populations, notably, Chinese,
Blacks 0.990 to 1.032, Chinese 1.077 to 1.080, Filipinos Filipino, Asian Indian and Korean, the ratios did at times
1.022 to 1.070, Asian Indians 0.994 to 1.071 and exceed that historically encountered as a consequence of
Koreans 1.038 to 1.082 for multiples and singletons, normal variation. However, these ratios were lower than
respectively. Although there were differences in sex some of the values reported for the same populations in
ratios for multiples, the inclusion of multiple births was
their native countries.
insufficient to explain the overall distortions in sex ratios
for the total population. Differences in the sex ratios may be attributable to
maternal age, parity, prenatal healthcare, stress and other
environmental factors as well as prenatal sex selection
(Davis et al., 1998). It is well established that fetal loss
DISCUSSION rates are higher when the fetal gender is male (Cata-
lano et al., 2009) and it is reasonable to think that a
In the absence of extrinsic factors, the sex ratio at birth is broad spectrum of additional environmental challenges
widely considered to be consistent across human popula- or sub-optimal healthcare will potentially have a greater
tions with values of 1.03 to 1.07 (Coale, 1991). In China, toll on male fetuses. Our data for White and Black
India, Korea and some other countries rates in excess of births indicate that such factors do not have an acute
Copyright 2011 John Wiley & Sons, Ltd. Prenat Diagn 2011; 31: 560–565.
DOI: 10.1002/pd
5. 564 J. F. X. EGAN et al.
Figure 4—Sex ratios for first, second and third or more births for six races. Data for each quadrennial, 1991–1994, 1995–1998 and 1999–2002
is shown separately
impact on sex ratios; the observed rates show consis- independent evidence for an excess of males in second
tency over time with only very minor changes in the and third births to Chinese, Korean and Asian Indian
ratios over from 1975 to 2002. However, maternal demo- parents (Almond and Edlund, 2008). This same trend
graphics, environmental factors and healthcare could still of increased sex ratio with higher parity has also been
account, at least in part, for observed race and nation- reported in China, India and Korea and it is consistent
ality differences. Therefore, even though we observed with prenatal sex selection (Park and Cho, 1995; George,
statistically significant elevations in overall sex ratios for 2006; Zhu et al., 2009)
Chinese Filipino, Asian Indian and Koreans, the com- The data shown in Figure 4 indicate that the great-
ponent attributable to prenatal sex selection cannot be est departure from the normal sex ratio occurred in
easily established from these data. the 1991–1994 quadrennial for third+ pregnancies. In
Analyzing the data from the perspective of differ- the two subsequent quadrennials, there were lower sex
ences in the sex ratio across birth order for each ratios for the Chinese, Korean and Asian Indian popu-
race/nationality has the advantage of substantially con- lations. Possible explanations for the peak in the early
trolling for the confounding environmental and health- 1990s include greater demand for sex selection at the
care differences. For each population group, the sex time when the ultrasound technology was first being
ratios for first, second and third+ births should be com- introduced in the 1980s, differences in education and
parable with a slightly lower ratio for higher order births acceptance or rejection of gender selection by differ-
reflecting advancing maternal age (Mathews and Hamil- ent immigrant populations, assimilation and changes in
ton, 2005). Consistent with this, we did indeed see laws in Korea, China, India and elsewhere that have
the expected slight decline in sex ratios with increas- reduced discrimination and increased societal opportu-
ing parity for White and Black women (Figure 4). For nities for women(Park and Cho, 1995; Hesketh et al.,
Chinese, Filipino, Asian Indian and Korean populations, 2005; Lai-wan et al., 2006; Zhu et al., 2009). Our data
we observed the opposite, i.e. increases in sex ratios on the maternal birthplace documents that over 90%
with higher parity with some of the ratios substantially of the Chinese, Asian Indian and Korean mothers and
higher than that expected for normal biological variation. 82% of Filipino mothers were born outside of the 50
Limited data from the U.S. year 2000 census provides United States and District of Columbia. Those women
Copyright 2011 John Wiley & Sons, Ltd. Prenat Diagn 2011; 31: 560–565.
DOI: 10.1002/pd
6. DISTORTIONS OF SEX RATIOS AT BIRTH IN THE UNITED STATES 565
who came to the United States more recently were less States. Although the magnitude of prenatal sex selection
likely to have had acculturation. Declining use of gender in the United States is not on the scale of that seen in
selection has been reported for native Koreans (Chung China and other Asian countries where it results in major
and Das Gupta, 2007). More data are needed to evaluate sex ratio imbalances, the practice does raise serious
these temporal trends. ethical issues in the United States. Future monitoring
Limitations of our analyses include inaccurate or of sex ratios will be especially important because
incomplete reporting, inability to separately take into inexpensive and non-invasive prenatal sex identification
consideration mixed parentage and the limited numbers tests in the first trimester are becoming increasingly
of births in some subgroups. Although sex selection has available (Benn and Chapman, 2010).
not been identified as an issue in Whites, we assumed
that if there were any gender selection in the control
White population it was minimal or was minimal or REFERENCES
neutral, in its effect on sex ratios. In evaluating sex
ratio differences with increasing parity, it should be Almond D, Edlund L. 2008. Son-biased sex ratios in the 2000 United States
recognized that birth certificates do not provide data for census. Proc Natl Acad Sci USA 105: 5681–5682.
the sex of previous children and slightly more than one Benn PA, Chapman AR. 2010. Ethical challenges in providing noninvasive
prenatal diagnosis. Curr Opin Obstet Gynecol 22: 128–134.
half of first births are male. Therefore, many parents Catalano RA, Saxton K, Bruckner T, Goldman S, Anderson E. 2009. A sex-
may not consider intervention in a subsequent pregnancy specific test of selection in utero. J Theor Bio. 257: 475–479.
because their goal of having a male has already been Centers for Disease Control and Prevention; National Center for Health Statis-
met. There is also presumably a countering component tics. VitalStats. 1975–1990. http://www.cdc.gov/nchs/products/vsus.htm..
Accessed 18 April to 14 June 2010.
of preferential selection for females to be considered;
Centers for Disease Control and Prevention; National Center for Health
either because of X-linked genetic conditions, for family Statistics. VitalStats. 1990–2006. http://www.cdc.gov/nchs/vitalstats.htm..
balancing, or other personal preferences. Accessed 14 May to to 21 June 2010 and 22 February to 23 February 2011.
It is not possible from our analyses to reliably estimate Chung W, Das Gupta M. 2007. Why is son preference declining in Korea?
the overall deficit in the number of female infants for Policy Research Working Paper 4373. The World Bank: Development
Research Group: Human Development and Public Services Team.
each year. However, from Figure 1, it would appear that Coale AJ. 1991. Excess female mortality and the balance of the sexes in the
at least for Chinese and Filipino, the ratios are very sim- population: an estimate of the number of “missing females”. Pop Develop
ilar to White for the earliest (1975–1978) quadrennial Rev 17: 517–23.
when any gender selection would have been minimal. Committee on Ethics. 2007. The American College of Obstetrics and
Gynecology. Committee Opinion 360. Obstet Gynecol. 109: 475–478.
Applying the White sex ratio, to all Asian or Pacific
Das Gupta M. 1987. Selective discrimination against female children in rural
Islanders, we can very crudely estimate that that there Punjab, India. Pop Devel Rev 13: 77–100.
were approximately 20 000 (1.25%) missing females in Das Gupta M. 2009. Family systems, political systems, and Asia’s “missing
this subset of US births from 1983 to 2002 or an aver- girls”. Policy Research Working Paper 5148. The World Bank: Development
age of 1000 per year. This 20-year interval was chosen Research Group: Human Development and Public Services Team.
Davis DL, Gottlieb MB, Stampnitzky JR. 1998. Reduced ratio of male to female
as ultrasound identification of fetal sex became gener- births in several industrial countries: a sentinel health indicator? JAMA 279:
ally available in the early 1980s. The American College 1018–1023.
of Obstetrics and Gynecology (ACOG) opposes prenatal George SM. 2006. Millions of missing girls: from fetal sexing to high
gender selection when it is motivated by, and reinforces, technology sex selection in India. Prenat Diagn 26: 604–609.
Hesketh T, Lu L, Xing ZW. 2005. The effect of China’s one-child family policy
the devaluation of women (Committee on Ethics, 2007).
after 25 years. N Engl J Med 353: 1171–1176.
However, ACOG acknowledges that ‘it will sometimes Hesketh T, Xing ZW. 2006. Abnormal sex ratios in human populations: causes
be impossible for health care professionals to avoid and consequences. Proc Natl Acad Sci U S A 103: 13271–13275.
unwitting participation’. George (2006) notes that it is Lai-wan CC, Blyth E, Hoi-yan CC. 2006. Attitudes to and practices regarding
not appropriate for dominant communities in Western sex selection in China. Prenat Diagn 26: 610–613.
Mathews TJ, Hamilton BE. 2005. Trend analysis of the sex ratio at birth in the
societies to accept sex selection for Asian minorities and United States. Natl Vital Stat Rep 53: 1–17.
that the problem requires global responsibility. Indeed, Parazzini F, La Vecchia C, Levi F, Franceschi S. 1998. Trends in male : female
the long-term consequences of sex ratio distortions (Hes- ratio among newborn infants in 29 countries from five continents. Hum
keth et al., 2005; Hesketh and Xing, 2006) will not Reprod 13: 1394–1396.
Park CB, Cho NH. 1995. Consequences of son preference in a low fertility
necessarily be confined to the societies where gender
society: imbalance of the sex ratio at birth in Korea. Pop Dev Rev 2: 59–84.
selection is currently the most common. Sahni M, Verma N, Narula D, Varghese RM, Sreenivas V, Puliyel JM. 2008.
Missing girls in India: infanticide, feticide and made-to-order pregnancies?
Insights from hospital-based sex-ratio-at-birth over the last century. PLoS
One 3: e2224.
CONCLUSION United Nations, Department of Economic and Social Affairs. Population
Division: World Population Prospects: 2009. The 2008 Revision. (New York).
We report evidence which strongly suggests that male Zhu WX, Lu L, Hesketh T. 2009. China’s excess males, sex selective abortion,
and one child policy: analysis of data from 2005 national intercensus survey.
sex selection occurs in some populations of Asian and BMJ 338: 1211–1216.
Pacific Island origin/culture who deliver in the United
Copyright 2011 John Wiley & Sons, Ltd. Prenat Diagn 2011; 31: 560–565.
DOI: 10.1002/pd