![A Number Of Forces, Trends, and Pressures Are Affecting Shopper Behavior Source: The World According to Shoppers, 2004 As consumers grow more time-starved, we are seeing changes in their preferences and behaviors ,[object Object],[object Object],*Source: Mintel/TechnoMetrica **Source: Texas Transportation Institute, Urban Mobility Study 2001 Shopper Insights](data:image/gif;base64,R0lGODlhAQABAIAAAAAAAP///yH5BAEAAAAALAAAAAABAAEAAAIBRAA7)
Recommended
Recommended
More Related Content
What's hot
What's hot (20)
Similar to Coca Cola
Similar to Coca Cola (20)
More from mixas450
Recently uploaded
Recently uploaded (20)
Coca Cola
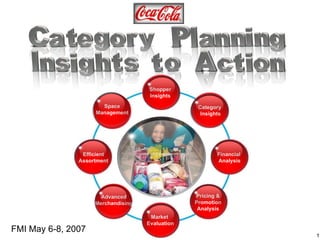
- 1. Shopper Insights Market Evaluation Pricing & Promotion Analysis Financial Analysis Category Insights Space Management Efficient Assortment Advanced Merchandising FMI May 6-8, 2007
- 3. Not Important Important Source: Meyers Research and MVI, August 2004 Important considerations for shoppers when deciding where to shop How are these lifestyle changes affecting the shopper’s behavior? “ Shop-Ability” Impacts Where Consumers Decide to Shop First to offer new products Store brand/private label items Quality name brand products Best selection of products for me Special deals or promotions Convenient location Broad product assortment Easy to shop Fast checkout Products always in stock Good customer service Shopper Insights
- 6. Need States – Large Dollar Rings $110 Average spending per shopping trip 19% Percentage of grocery shopping trips Care for Family Driven to do the best they can for their families “ I buy what people ask for and what I think will please them, but I always make a decision that ensures it’s good for them.” Efficient Stock-Up Laying in supplies to minimize the number of times they have to go to the store “ I don’t like to grocery shop, so on my major trips, I buy everything I can $95 13% Smart Budget- Shopping Want to do the right thing for the family, but saving money is important in their decisions “ I’m laying in supplies for the long term. I want the store to make it easy for me to find savings.” $93 15% Discovery Explorers hoping to find something new $90 7% “ I like to browse during my grocery shopping trips. Every trip is a little different. I look for new ideas, new recipes, new foods—& non-grocery products like clothes.” Source: “The World According to Shoppers” Shopper Insights
- 7. Need States – Medium Dollar Rings $57 13% $60 11% $58 8% Bargain-Hunting Among Stores Specific Item Reluctance “ I just don’t want to be here. I’d rather have somebody else do my shopping or go online.” Focus first and foremost on one or two urgently needed items “ I need something right away; a specific food, ingredient, prescription medicine, or alcoholic beverage. If it’s not on the shelf, I’m likely to go to the next store.” Don’t want to grocery shop and seek as little involvement as possible Look for tactical bargains on specific items as opposed to overall savings “ I take pride in what I do. I like to tell my friends about the deals I find.” Advanced Shopper Insights Source: “The World According to Shoppers” Average spending per shopping trip Percentage of grocery shopping trips Shopper Insights
- 8. Need States – Small Dollar Rings Small-Basket Grab & Go Want to get in, grab a short list of items, and get out in a hurry “ Bread, milk, bananas, and beer. In and out in 10-minutes. That’s what I’m here for.” $41 Average spending per shopping trip 9% Percentage of grocery shopping trips Immediate Consumption “ I’m thirsty, I’m hungry, or I need cigarettes.” Seek to satisfy a craving $32 5% Source: “The World According to Shoppers” Shopper Insights
- 9. Two Need States Indexing High for Non-Alcoholic Beverages (%) = Frequency of purchase (#) = Frequency of purchases in need state/avg. frequency of purchases across all need states. Source: “The World According to Shoppers” $32 Average spending per shopping trip 5% Percentage of grocery shopping trips $110 19% Care for Family Immediate Consumption Fresh prepared food (162) Cigarettes (143) Magazines (113) Imported cheese (157) Fresh fish (163) Refrigerated prepared food (158) Fresh baked goods (152) Non-alcoholic beverage (152) High Indexing Products Snacks/candy/gum (39%) Non-alcoholic beverage (26%) Dairy (26%) Produce (22%) Frozen Food (21%) Dairy (72%) Produce (70%) Packaged food (66%) Frozen food (64%) Fresh meat (60%) Top 5 Categories Purchased Shopper Insights
- 10. 8 Beverage Categories 40 Retail Customers 7 Channels 50 DMAs across the U.S. Methodology Size One of the largest surveys we have ever conducted Breadth Unprecedented cross channel view Depth Deep view of customers never done before 60,000 online respondents, 1,200 in-store interviews 115,000+ shopping occasions Shopper Insights
- 11. Connecting with the Shoppers’ Needs and Motivation helps Builds Loyalty and Sales It all begins with the NEEDS of the SHOPPER CONSUMPTION Grocery, Clubs, Supercenters, Drug, CR, Mass; Value PURCHASE CHOICE SHOPPING EXPERIENCE OCCASION BASED CHANNEL CHOICE SHOPPING NEED Shopper Insights
- 12. Cleanliness, Selection and Convenience are Very Important in Store Choice Cleanliness and neatness of the store Source: Landmark Study, October 2005 Is close to where I live or work Freshness of produce and meats Does not run out of stock of products I want 38% 40% 22% 20% Source: Landmark Shopper Shopper Insights
- 13. Health & Wellness Focus is critical Across a Variety of Areas Q55. For each statement please indicate how much you agree or disagree that the statement describes you and your household. Source: Landmark Shopper Study, October 2005 = over index 120+ = under index of at least 80 25% of Shoppers are Extremely Mindful of Health & Wellness when making choices of foods, beverages, and level of physical activity Shopper Insights
- 14. Shoppers are Pressed for Time across all shopping segments Supermarkets have the opportunity to satisfy time starved grocery shoppers by ensuring high household penetration and high purchase frequency products are in stock on shelf and display and these categories are easy to shop. Q55. For each statement please indicate how much you agree or disagree that the statement describes you and your household. Source: Landmark Shopper Study, October 2005 = over index 120+ = under index of at least 80 Shopper Insights
- 15. The Grocery Channel Satisfies a Variety of Functional Needs for Shoppers Q27. What needs were you trying to satisfy when you went to [store] on this occasion? Source: Landmark Shopper Study, October 2005 = over index 120+ = under index of at least 80 Shopper Insights
- 18. Insights to Action Shopper Insights Actions Insights Retailer focus on “shop-ability” will help attract and maintain loyal shoppers. As consumers grow more time-starved, we are seeing changes in their preferences and behaviors. Utilize in-store messaging to help consumers effectively navigate categories and store. Cleanliness, Selection and Convenience are very important in Store Choice. Shoppers feel strongly that there is not enough time in the day to meet all their commitments. Emphasize perimeter selections and fast checkouts. Shopper Insights
- 19. Shopper Insights Market Evaluation Pricing & Promotion Analysis Financial Analysis Category Insights Space Management Efficient Assortment Advanced Merchandising
- 20. Clear Segments CSD MILK BEER JUICE POWDERED DRINKS INSTANT COFFEE TEA Treat, Fun Nutrition Relax Perk Up Social Reward Cheap for Kids Breakfast 1984 Now - Many New “Categories” and Further Segmenting BEER Spirits Diet MILK Reg. JUICE Juice Drinks Bottled Water Flavored Milk Energy Drinks Sports D ri nks Mixers Tap Water Purified Water INSTANT COFFEE Herbal Teas Café Coffee Flavored Coffees 2007 Flavored Sparkling Water Diet Flavored Mineral Water Yogurt Drinks Premium Wine TEA Fruit Teas Fresh Coffee CSD Regular Imported Light Imported Light Soy Drinks Powdered Drinks 2% Skim Consumers Have More Beverage Choices Than Ever Before Category Insights
- 21. Share Of Stomach – Total U.S. Reflects consumption rates and importance of categories Source: Beverage Digest Fact Book 2007, BD/Maxwell CSD 27.9 (-.4) Tea 3.9 (+.1) Juices 4.4 (-.3) Bottled Water 11.5 (+.8) Coffee 8.9 (-.1) Milk 10.7 (-.3) Beer 11.9 (+.2) Sports Drinks / Energy 2.6 (+.3) Wine 1.3 (+.1) Tap Water 14.8 (-.5) Share (Share chg. vs. Prior) 155 Total Annual Gallons per Person = 54oz. Per Day Category Insights
- 22. CSD 56.5 (-0.7%) The Size and Value of the Nonalcoholic Beverage Category in all measured channels is growing >$2.3B +6.0% Category Value (Dollar) Share / Dollar % Change Source: Nielsen All Measured Channels Total US 12 months ending 3/31/2007 Sports Drinks 10.0 (+6.8%) Single Serve Water 14.7 (+14.1%) Energy Drinks 8.5 (+30.3%) RTD Tea Bottle/Can 4.3 (+19.6%) RTD Coffee 1.5 (+14.4%) Juice & Drinks 4.4 (-1.4%) Total Nonalcoholic Beverages = $39B, of which $22B is CSD Category Insights
- 23. The Beverage Category is very Important: More Consumers say they drink CSDs Daily or Weekly than any other non-tap Water Beverage Source: USA BevCAT 2005 Survey Beverage Category Consumption Frequency Category Insights
- 24. Carbonated Soft Drinks Total U.S. Corporate Share and Brand Rankings Retail / Fountain / Vending Channels Source: Beverage Digest Fact Book 2007 Includes Retail, Fountain and Vending Channels Coca-Cola Pepsi-Cola Dr Pepper / Cadbury Cott National Beverage All Other Corporate Share Category Insights
- 26. Nonalcoholic Beverage Categories can be grouped into four Consumer Need States Performance Beverages Functional CSDs and Refreshing Alternatives Convenient Refreshment “ Enjoyable Refreshment” CSDs “ Healthy Refreshment” Fruit Drinks (<10% Juice) “ Versatile Refreshment” RTD Teas “ Refreshing Alternatives” Shelf Stable Juices & Drinks ( > 10% Juice) Sports Drinks Sports Hydration Energy Drinks Water Hydration On-the-Go Single-Serve Water: At Home Gallons Enhanced Sparkling Purified Spring Imported Juice/Drink Shelf Stable Health & Wellness Youth Family Adult Shelf Stable Juices & Drinks (>10% Juice) Category Insights
- 27. Clear Organization and Messaging helps Drive Shopper Conversion within the Need States CSDs Water Performance Beverages Convenient Refreshment Hydration Functional “ Navigating the store and simply finding the desired product easily becomes a more important consideration” - MVI Sports Drinks, Sports Hydration, and Energy Drinks Purified, Spring, Imported, and Enhanced Sparkling Juice / Juice Drink Health & Wellness Shelf Stable Juices & Drinks (>10% Juice) Category Insights
- 28. Enjoyment Today Feel Good Today Feel Good Tomorrow Hunger & Digestion Sensory Pleasure & Food Enhancement Having a Good Time Confidence & Individuality Energy / Stimulation Active Replenishment Mental Renewal Health, Beauty & Nutrition Comfort & Relaxation Routine Refreshment Power Opportunity White Space Top Coca-Cola Brands in each need state Coca-Cola’s Innovation Strategy Is Focused On Meeting Consumption Need States Of Your Consumers Category Insights
- 29. Insights to Action Category Insights Actions Insights Armed with Advanced Shopper Insights, Retailers can evolve with Consumers. Consumer need states and occasions drive beverage tastes, preferences and consumption. Non-Alcoholic Beverages can be organized into Consumer Need States. Each beverage need state is unique, serving different consumer needs. Clear messaging provides navigation, information and drives Shopper Conversion. Consumer needs are evolving with more beverage choices than ever before. Category Insights
- 30. Shopper Insights Market Evaluation Pricing & Promotion Analysis Financial Analysis Category Insights Space Management Efficient Assortment Advanced Merchandising
- 33. Soft Drinks are an Important Component to “Center Store” Profitability $3,449 $3,539 $2,560 $1,896 $2,314 $1,839 $1,754 $1,472 $1,469 $1,081 Based on Weekly Sales, Soft Drinks rank second in Adjusted Gross Profit. Source: Bishop Consulting (3) Chain Average Super Study – (Adjusted Gross Profit = GP – Trade & Terms) Soft Drinks Bread Cookies & Crackers RTE Cereal Salty Snacks Candy Shelf Stable Juice Soup Bottled Water Coffee Top Ten Center Store Categories Center Store Adjusted Gross Profit Adjusted Gross Profit= Gross Profit + Terms + Trade Dollars Financial Analysis
- 34. Soft Drinks are One of the Most Productive Categories in “Center Store” Source:2005 WBC Super Study: *AGMROII:Adjusted Gross Profit (Gross Profit+Terms+Trade dollars) / Avg Inventory $ on Hand (Adjusted Gross Margin Return on Inventory Investment) $11.92 $12.59 $17.41 $20.82 $25.81 $27.66 $34.30 $62.48 $63.67 $72.85 Coffee Candy Cookies & crackers Soup Ready-To-Eat Cereals Shelf stable juice Salty snacks Soft Drinks Bottled water Bread AGMROII Top Ten $ Categories Financial Analysis
- 35. Insights to Action Financial Analysis Actions Insights Add value to make center store easier to shop with relevant product information and convenience features. Evaluate store real estate dedicated to products with high Gross Margin Return on Investment. Leverage the strength of Soft Drinks to drive traffic to Center Store. “ Center Store” contributes significantly to results and is critical to Supermarket Profit. Source:2005 WBC Super Study: Soft Drinks are an Important Component to “Center Store” Profitability. “ Center Store” departments deliver 65% of Adj. Gross Profit. Financial Analysis
- 36. Shopper Insights Market Evaluation Pricing & Promotion Analysis Financial Analysis Category Insights Space Management Efficient Assortment Advanced Merchandising
- 38. Promotional Planning Modeler 12pk Cans Retail Price Package Planning Tool linked to Sales Forecasting System for developing a Retailer Promotional Plan by Package versus Prior Data Source: KAEP – Key Account Event Planning Pricing & Promotion Analysis
- 39. Nielsen Based Elasticity Model Retail Price Package Planning Tool for Evaluating and Analyzing Elasticity over time Data Source: Nielsen Pricing & Promotion Analysis
- 40. Nielsen Volume Throw Model Retail Price Package Planning Tool for Analyzing Volume lifts by price point across time Data Source: Nielsen Pricing & Promotion Analysis
- 41. Expanding Category Sales and Profits are mutually beneficial It is not about dividing the pie between . . . It is about growing the total pie Zero Sum Game Win – Win Game Manufacturer Retailer Retailer Manufacturer Pricing & Promotion Analysis
- 42. Together We Can Improve Category Profitability, even in a rising cost environment Traffic Driving Packages Profit Packages Creating Value for the Retailer Our Packages Play Various Category Roles in Balancing Traffic Building and Profit Generation Pricing & Promotion Analysis
- 43. Insights to Action Pricing & Promotion Analysis Actions Insights Utilize Soft Drinks to maintain and grow trips, as well as increase basket size. Soft Drink pricing is an important factor in driving shoppers to the store. Set pricing and profitability goals and measure performance against them. 76% of shoppers believe mid priced Soft Drinks are reflective of total store pricing. Total Basket Price Image is Closely Aligned with Soft Drink Price Image. Use tools like RPA to jointly develop Profitable Retail Price Package Plans. Pricing & Promotion Analysis
- 44. Shopper Insights Market Evaluation Pricing & Promotion Analysis Financial Analysis Category Insights Space Management Efficient Assortment Advanced Merchandising
- 45. The Shopper Segmented Merchandising Opportunity Shopper Segmented Merchandising: Delivering beverage solutions matched to each store’s DNA Store A’s “Shopper DNA” Each store serves a different mix of Shoppers, Occasions & Needs Each store has a unique DNA Market Evaluation
- 48. Shopper Segmented Merchandising Methodology 5 0 1 1 Store 4 7 12 7 7 Store 5 7 2 13 4 Store. . . 9 3 14 2 Store 6 15 2 1 Segment … 0 6 5 Segment 3 3 6 5 Segment 2 3 Store 3 12 Store 2 10 Store 1 Segment 1 110K+ Households . .clustered into 59 Beverage Purchase Segments 90,000 stores are scored on 59 Beverage Segments Stores with similar scores are grouped together to form 5 Store Clusters Water Sports Drinks Segments are based on beverage Purchase Drivers and demographics Scoring is based on demographic fit between store shoppers and beverage Purchase Drivers Dynamic Clustering: Grouping together stores with similar beverage opportunities Nielsen panel households Beverage Segments SS Juice Energy Tea Beverage Segments 90,000 stores in Spectra database: Grocery, Mass, Club, Drug, and Dollar formats 2 3 4 5 59 SSD 90,000 store profiles Utilizing Nielsen’s new Dynamic Clustering Model , Shopper Purchase Segments are mapped to Store Clusters to drive store-level changes Store level changes Market Evaluation
- 50. How Can Beverage Assortment Differ by Segment? Deliver “Store Level” Merchandising and Marketing Solutions C luster 3: Suburban Upscale C luster 5: Urban Flavor Right Brands Right Packages Right Occasions Urgent Items HH Stock-up Speedy Fill-in JIT Meals HH Stock-up Everyday Savings Right Brands Right Packages Right Occasions Market Evaluation
- 51. Beverage Emphasis by Cluster In Coca-Cola Section Flavor Emphasis Rural Diet Sparkling Emphasis Regular Sparkling Emphasis 13% 11% 17% 28% 31% Urban Ethnic Urban Upscale Suburban Upscale Mainstream % of Stores Market Evaluation
- 54. Insights to Action Market Evaluation Actions Insights Convert Shopper knowledge into information in action, information focused on results (i.e., Store tailored planograms to maximize sales and reduce out of stocks). Each store has a unique DNA (Shoppers, Occasions & Needs). Extensive shopper research & insights drive store level assortment changes. Segment shoppers based on their beverage purchases with five actionable store clusters. Segment shoppers in a way that would lead to meaningful & actionable changes at a store level. Develop smaller shopper segments and tailor solutions to these segments. Implement merchandising solutions that reflect these differences. Market Evaluation
- 55. Shopper Insights Market Evaluation Pricing & Promotion Analysis Financial Analysis Category Insights Space Management Efficient Assortment Advanced Merchandising
- 56. Supermarket visits are focused on today’s needs Source: 2005 Coca-Cola RFID PathTracker Study Note: Visuals do not represent only traffic pattern by visit segment. Visuals represent examples of types of visits. 20 Minute+ Trips (42% of all visits) 88% of these trips visit more than 1/4 of the store 58% of Trips Are Less Than 20 Minutes 10-20 Minute Trips (21% of all visits) 28% of these trips visit more than 1/4 of the store <10 Minute Trips (37% of all visits) 1% of these trips visit more than 1/4 of the Store Advanced Merchandising
- 68. Traditional “New Age” Sections are a Hodge-Podge of DSD Items Advanced Merchandising
- 74. Insights to Action Advanced Merchandising Actions Insights Shoppers spend a significant amount of time in the back perimeter, shopping aisles from back to front. Display new products, Cross-Merchandising category tie-ins, and utilize Promotional messaging . Message to the shopper’s needs and Cross-promote with center store or higher margin perimeter categories. Engage the shopper early - Merchandise high frequency items to make them easy to find and purchase. The First Third of the Supermarket Shopping Trip provides exposure to the most shoppers - Higher Traffic and Slower Shop Times. Shoppers shop in a dominant, counter-clockwise pattern, shopping aisles from back to front. Traditional “New Age” Sections are a Hodge-Podge of DSD Items. Redefine Categories Based on Consumer Need States and Segmentation. Advanced Merchandising
- 75. Shopper Insights Market Evaluation Pricing & Promotion Analysis Financial Analysis Category Insights Space Management Efficient Assortment Advanced Merchandising
- 76. Efficient Assortment (Too Many SKUs, Limited Space) In-Store Space In Supermarkets Has Not Expanded As Quickly As SKUs CPG Manufacturers Have Responded With A Record Number Of New SKU(s) Expansion of Coca-Cola SKU(s) From 1986 to 2006 Impact Of Inventory-to-Sales and Assortment On System Value Chain Efficient Assortment
- 79. Insights to Action Efficient Assortment Actions Insights Assess new products and positioning. Brand and Package innovation - Increasing SKU proliferation. Perform comprehensive analyses & interpretation of category performance. Evolving brands - missed sales and revenue opportunity to reach full potential. Initiate and execute efficient assortment process. Consumer demand for variety may lead to “Variety Confusion”. Efficient Assortment
- 80. Shopper Insights Market Evaluation Pricing & Promotion Analysis Financial Analysis Category Insights Space Management Efficient Assortment Advanced Merchandising
- 82. Space Management (Principles: Art and Science) ART Space Management
- 83. C:/data/customer/ACFS/ACFS2 6/4/99 ( ) Space Management (Principles: Art and Science) Data Sources Store Specific or Cluster POG Measures SCIENCE ADD / DELETE Days of Supply Space to Sales GP/LINEAR FT. CROSS POG ANALYSIS NEW ITEM PLACEMENT EFFICIENT ASSORTMENT VALIDATION Space Management
- 84. Space Management (Getting “IT” Right at the Shelf) EIA Space Management
- 85. Insights to Action Space Management Actions Insights Sales / Category / Space analysis. Pressure on permanent space and effective inventory levels. Continuous Assessment of each SKU performance. Exciting new CSD category innovation has “Squeezed” core CSD brand space. Tight Space has stunted core CSD brand growth and expansion opportunities. Develop and implement a course of action for product introductions. Space Management
Editor's Notes
- There is no doubt that consumers are facing greater pressures than ever before. One of the pressures that has the most impact on their shopping behavior is the speed of life. As the speed of life increases, time has a greater influence on shoppers’ definitions of value and convenience. As a result, a HH’s grocery shopping is not limited to a single channel, but rather spans many channels.
- Shop-ability (identified here as fast checkout & easy to shop) clearly impacts the shopper’s decision as to where to shop. Given the losses in shopping trips that supermarket retailers have experienced, it’s extremely important retailers deliver on this shopper need.
- Shop-ability is so important because shoppers are making more of their decisions while they are in the store 60% of supermarket purchase decisions are completely unplanned 53% of Mass Merchandiser shopping decisions are completely unplanned Given this, imagine how much of a shopper’s time can be wasted or saved, depending on how shopable it is...
- Need states are critical in understanding the needs of the shopper. It all begins with the shopper.
- Although most beverage categories index high for heavy grocery shopping trips, the % of purchase incidence is much greater on CSDs and juice/drinks.
- Consumer needs and preferences are evolving and changing rapidly. The beverages available in 1984 have expanded into new segments and choices that are available today.
- 1. Dr Pepper/7Up corporate growth rate is highest for 2nd consecutive year. 2. Corporate Coke’s lead vs corporate Pepsi increases 4th consecutive year. 3. National Beverage and Double Cola down mainly from private label incursions.
- Beverages are important to your shoppers. Soft Drinks, Coffee, Juice and Bottled Water are all in the top 10 in shopper purchase behavior. Soft Drinks in particular are very important to shoppers as shoppers spend more on this category than any other and buy it more frequently than any other UPC’d category outside of Bread & Baked Goods. Purchase Frequency: Average number of Shopping Trips that included the purchase of a soft drink Buying Rate: Category $ per HH Of the 95% of all households buying soft drinks they average buying 19 times per year which is only surpassed by bread within key categories 28% of the shopping trips include the purchase of a soft drink Additionally, on these 19 trips soft drink consumers spend more annually than they spend on other categories.
- This chart illustrates the Beverage Categories that meet the Consumer Need States.
- Navigation - Shoppers said: “ Help me to find the beverage aisle” “ Help me to find my brand and package” “ Help me find what my family needs/wants” “ Help me get in and get out quicker” Information Price New products/packages Nutritional information Meal/snack solutions and occasions planning Inspiration Deliver call to action Focus on product/occasions imagery Key into Mom’s instinct to care for family Source: Beverage Landscape Operating Plan
- As we look across needs states, obviously we consider which categories we have experience in and where we have brands that either currently compete, or could stretch their equities to compete more broadly in other need states.
- This chart shows weekly adj gross profit for key categories within center store. Soft drinks are a key driver in center store profit performance ranking second only to bread in weekly adj gross profit. Adj GP = GP – Trade & Terms)
- Using AGMROII (adj gross profit return on inventory investment) Soft drinks are very productive ranking third out of top ten categories in center store. The payment terms and inventory turn of national brand soft drinks are key drivers of this productivity. Make the point here that even though water may have a higher margin the category measures we have discussed such as frequency, household penetration and purchase incidence drive a higher turn rate for Soft Drinks that impacts this important financial productivity measure of Adjusted Gross Profit Return on Inventory Investment. Along with the other category benefits that have been discussed thus far this AGMROII number can help dispel the myth that supermarket retailers are better off focusing on water and/or isotonics vs. Soft Drinks for display space. As this chart shows Soft Drinks are just as productive in AGMROII as water and much more productive vs. other categories that get significant display support. A key driver of AGMROII is inventory turns. Soft Drinks inventory turns on average 84 times per year. This compares to these other categories as follows: Bread-78.7; Bottled Water-49.9; Salty Snacks-28.1; Shelf Stable Juice-25.3; Ready-To-Eat-Cereals; Soup-26.3; Cookies & Crackers-15.6; Candy-16.8; Coffee-13.1
- Another finding from this recent consumer study is the very intuitive finding that Soft Drink pricing plays a key role in the category’s ability to draw shoppers to your store. However, it’s not the top reason. The top reason Soft Drinks drive shoppers to the store is that shoppers are simply out of Soft Drinks at home. This is a more important driver for Soft Drinks than other categories given the frequency with which shoppers buy the category. Additionally, the Soft Drink category’s ability to drive traffic isn’t just about price. The brand preference for Soft Drinks is evident when you see that a top reason Soft Drinks drive people to the store is that a family member asked for a specific item. Since an important motivator for home category managers is to care for her family, the opportunity is to help her meet this need and provide the brands her family is asking for. Finally, it’s disproportionately important for shoppers to see Soft Drinks in the ad compared to other categories.
- The goal is to increase the overall size and value of the category
- Together we can utilize the strategic role of each package to create a balance between driving traffic and transactions with generating the margin goals of the category.
- The opportunity that I’d like to share with you today is that of Shopper Segmented Merchandising. We know that each of your stores serve a different combination of shoppers, occasions & needs. You know your stores better than anyone so you see this every day. Since each store is different and basically has a different “Shopper DNA,” the opportunity I want to talk to you today about is that of implementing merchandising solutions that reflect these differences – ultimately, bringing the right products to the right shoppers in the right store.
- Why is Shopper Segmented Merchandising more important now than it has ever been? Shoppers are changing and are demanding what they want when they want and where they want it – they’re in control. Additionally, the shopper base is fragmenting with fewer “traditional families,” more women in the workforce, and segments of the population, like Hispanics, becoming a huge economic force. Finally, shoppers want what they want when they want it and, as a result, we know that you need to reduce out of stocks to make sure shoppers get what they want.
- (REPLACE STORE PICTURE WITH IMAGE OF CUSTOMER’S STORE, IF POSSIBLE) So what is Shopper Segmentation? It means that, instead of trying to create one solution for everyone or a unique solution for every shopper, group shoppers together into segments and tailor solutions to these segments. Ultimately, the goal is to drive store level changes that deliver the right brand, package, price and occasion in the right store.
- So here we outline the specifics of our Shopper Segmented Merchandising Methodology. Our goal was to segment shoppers in a way that would lead to meaningful & actionable changes at a store level. Therefore, we started with the shopper, segmented shoppers based on their beverage purchases, mapped these beverage segments to 90,000 stores and ended up with 5 actionable store clusters. Each cluster represents groups of stores serving shoppers with similar beverage needs.
- What are our Beverage Clusters? There are 5 clusters with varying beverage needs. Shoppers living near Cluster 1 stores are less likely to adopt new beverage categories early on compared to other shoppers. These shoppers also give a much greater share of their beverage dollars to sparkling soft drinks compared to other categories. They are more inclined to buy citrus sparkling beverages as well as larger pack sizes such as 24 pack cans. We have very detailed overviews of how shoppers in these clusters differ that we can share with you at a later date when appropriate.
- So are there meaningful changes in beverage assortment by cluster? Yes – here are two examples of how the beverage assortment emphasis would change based on whether you’re in a cluster 3 store or a cluster 5 store.
- So what are the high-level beverage emphasis recommendations by cluster? Starting with the Coca-Cola Sparkling section, here are examples of the top emphasis areas in 3 clusters. In cluster 1 stores, these shoppers are better served with an emphasis on regular or sugar sparkling soft drinks. That change is reflected in the size of the “red” block in the shelf set picture below. Cluster 3 shoppers are better served with a Diet Sparkling Emphasis as is reflected in the larger silver block below. And Cluster 5 Shoppers would prefer to see a greater emphasis on Flavor Sparkling drinks, as is reflected in the bigger green and orange sections. Why are we looking at the shelf in color blocks? Our research shows that, in the sparkling soft drink aisle, shoppers use familiar brands and colors as visual cues to find the products they’re looking for. Therefore, a color block aids in presenting those visual cues.
- Shopper Segmented Merchandising is only successful when it is successfully implemented at store level. The process for leveraging these shopper insights to drive store level changes is outlined here.
- We do have some experience with Shopper Segmented Merchandising both globally and in the U.S. For example, in Latin America, our shopper segmented merchandising efforts drive an 8.5% increase in sales. In the U.S., we’ve had several successful segmented merchandising tests.
- We discussed that consumers today are struggling with time pressures which focuses them on getting in and out of the store as quickly as possible. Through the Coca-Cola RFID Path Tracker Study trips have been both mapped and timed. 58% of all trips are less than 20 minutes. The impact of this is that only 1% of 10 minute or less trips are visiting more than 25% of the store and less than a third of the trips that are 10-20 minutes are visiting more than 25% of the stores. Trips that are 20 minutes plus result in 88% of shoppers visiting more than 25% of the store. But even with these longer trips consumers are not shopping up and down all the aisles.
- The rear of the store is also another key area, in that it has high traffic. From this point, shoppers tend to shop the aisles from back to front. Aisle messaging that is designed to be seen from the rear perimeter stands a far greater chance of being effective. Given that the back of the store is also the most likely path that a shopper will take to get to the beverage aisle, we need to think about how we can merchandise displays in this area so they don’t merely cannibalize sales volume that would have otherwise come from the gondola.
- In our RFID research, we were able to identify the areas of the store that had the highest shopper density, which is a function of: Shopper traffic throughout the store; and How much time shoppers spent in each section What we learned from this is that the earliest part of the trip provides the most exposure to shoppers. However, from other research we also learned that this is also a point in the trip where shoppers are adjusting to the retail environment and may not yet be in “shopping mode.” This would suggest that the role of the lobby display may be better suited to inform shoppers and not necessarily drive the purchase from the display at this point. More investigation is needed in this area.
- Taking an integrated, total view of the store is something that needs to happen if we are to excel at shopper marketing. This means that we will need to think of what role each section of the store plays: Merchandise each section based on the shopper’s needs that drove the trip; and Activate each section based on the attitudes and values shoppers bring with them into the store. At the end of the day, what we will end up with is a holistic view of the store, where each part is designed to resonate with certain shoppers, and the combined whole is more shopable and relevant. Some of our early work in this area has already been used to shape 2006 programs. The Landmark study will help us further understand shoppers, and how we can best connect our brands with them throughout the store, section by section.
- Near the entry of the store is where you will find the highest shopper traffic. This is also an area where behavior is difficult to categorize, as shoppers may not yet be in active shopping mode after entering the store. Characteristics of location: Shopper Traffic: Very High Decision-Making Time: None-Fast Shopper Trip Types: Quick-Long Stage in Trip Progression: Very Early Illustrative Opportunities: Generate excitement & awareness – shoppers want relevant information Key promotions “ New news” Engage the shopper early – get on their mental shopping list
- The right rear section of the store is a very attractive part of the store: Shopper Traffic: High Decision-Making Time: Slow Shopper Trip Types: Medium & Long Stage in Trip Progression: Early Illustrative Opportunities: Message to the shopper’s needs – make the connection with the HCM Cross-promote center store or high margin perimeter categories – create incremental value for the shopper and retailer Showcase new products and variety (brand & pkg.) – high traffic means a high rate of impressions to drive awareness, trial and unplanned purchases Communicate information (e.g. product benefits or details) –Total store shoppers will be more willing to consume information early on in their trip rather than later
- Our RFID work identified that quicker trips tend to show highest traffic & density in the front end of the store, where decision times tend to be made very quickly. The front end before the checkout typically has the following characteristics: Shopper Traffic: High Decision-Making Time: Fast Shopper Trip Types: Quick-Medium Stage in Trip Progression: Late Based on these characteristics, there are many opportunities to connect with shoppers with front endcaps. Some general examples include: Merchandising high frequency items to make them easy to find and purchase Cross-merchandising items frequently purchased in combination Communicating promotional information (e.g. hot pricing) to capture unplanned purchases – this is important because shoppers rarely shop the entire store and may not have awareness of the deal Emphasizing convenience benefits of packages
- When shoppers reach the checkout, they have reached a transition period. The primary goal at this stage is completing the transaction and getting out of the store. Effectively reaching shoppers at this stage requires laser focus. The checkstand typically has the following characteristics: Shopper Traffic: Very High Decision-Making Time: Very Fast Shopper Trip Types: Quick - Long Stage in Trip Progression: Very Late These characteristics reveal some marketing opportunities: Inspiring impulse purchases with call-to-action messaging & bold imagery – it is critical to “break through the clutter” and be noticed Stimulating trial of new products with trial-sized packages –Impulsive, low-involvement, & trial products make sense at the checkout because there is high traffic and fast shopper decision-making times. Merchandise to her needs first – The solo female trip is the most common; merchandising and messaging needs to her consumption & usage needs.
- Rear endcaps may be more well-positioned for: Longer trip, larger basket shoppers, to: Communicate pricing and sale-promoted brands and packages Remind them to visit the beverage aisle Introduce new products Provide product or promotional information Tie-in/cross-promote items in adjacent sections What makes them well-suited for this purpose : High % of larger basket shoppers that are likely to shop or consider shopping the bev. aisle Shoppers’ dominant, counter-clockwise pattern, tendency to shop aisles from back to front Slower decision-making times vs. front of store End aisle displays are used by shoppers to: Check prices (43%) Locate/purchase items on sale (29%) Serve as reminder to purchase beverages in the aisle (26%) Discover new products (18%) Actions to Consider : Occasion-based messaging and visuals Product information and/or cross-promotion details HCM-relevant call-to-action messaging Easily-visible pricing information Incremental space for new products (to drive awareness and satisfy discovery shoppers)
- From our RFID studies, we learned that about 1 in 3 shoppers visits the CSD aisle. Beverages are also a high penetration category, which makes the aisle a very important place to connect with shoppers. From our work with retail agencies and understanding of shoppers, we identified three important functions of effective messaging: 1) Navigation (where is it?) 2) Information (what is it, what makes the product unique?) 3) Inspiration (why should I buy it?). These insights were built into our beverage aisle landscape messaging solutions that you see pictured. Given its high visit rate, another role we discovered for the beverage aisle is to connect the shopper with other beverage opportunities, particularly IC. Through analysis of shopper card data, we learned that IC beverage incidence for our brands was more than 3x higher when an FC package was also purchased. Given that the beverage aisle is one of our last points of availability before the checkout, messaging the IC occasion in the beverage aisle gives us an opportunity to drive higher awareness and IC incidence. This is why our IC3 messaging has a beverage aisle component, since nearly 1 in 4 shoppers is not aware of the opportunity to buy IC beverages. As we mine Landmark data in 2006, we will be able to further explore the ways we can use this section of the store more strategically.
- Taking an integrated, total view of the store is something that needs to happen if we are to excel at shopper marketing. This means that we will need to think of what role each section of the store plays: Merchandise each section based on the shopper’s needs that drove the trip; and Activate each section based on the attitudes and values shoppers bring with them into the store. At the end of the day, what we will end up with is a holistic view of the store, where each part is designed to resonate with certain shoppers, and the combined whole is more shopable and relevant. Some of our early work in this area has already been used to shape 2006 programs. The Landmark study will help us further understand shoppers, and how we can best connect our brands with them throughout the store, section by section.
- This shows the Performance Beverages segmentation starting with Regular Sports Drinks, followed by Sports Hydration, and Enhanced Sports Drinks and ending with Energy Drinks. The images of products are examples are what can be found within each segment.
- This shows the Water segmentation starting with Enhanced, Sparkling, Imported, Purified, Spring and Gallons. The images of products are examples are what can be found within each segment.
- If there are Under stock, there will also be Overstock not only affects KO, also affects retailer