Olympian Capital Mgmt. LLC
•
1 like•180 views

The US economic recovery has been the weakest in over 50 years with little growth in wages or disposable income. However, exports have increased more than previous recoveries due to continued global growth around 4%. While uncertainty remains from Europe, US corporations have benefited from exports and global sales. Investors should focus on downside protection, globally competitive large companies, and income strategies.

Recommended
Recommended
More Related Content
What's hot
What's hot (19)
Viewers also liked
Similar to Olympian Capital Mgmt. LLC
Similar to Olympian Capital Mgmt. LLC (20)
Olympian Capital Mgmt. LLC
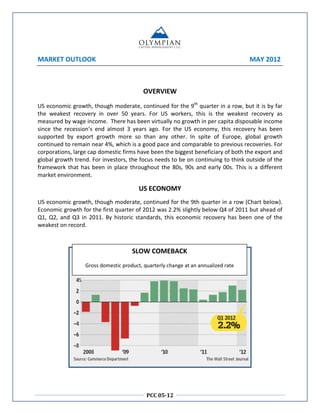
- 1. MARKET OUTLOOK MAY 2012 OVERVIEW US economic growth, though moderate, continued for the 9th quarter in a row, but it is by far the weakest recovery in over 50 years. For US workers, this is the weakest recovery as measured by wage income. There has been virtually no growth in per capita disposable income since the recession’s end almost 3 years ago. For the US economy, this recovery has been supported by export growth more so than any other. In spite of Europe, global growth continued to remain near 4%, which is a good pace and comparable to previous recoveries. For corporations, large cap domestic firms have been the biggest beneficiary of both the export and global growth trend. For investors, the focus needs to be on continuing to think outside of the framework that has been in place throughout the 80s, 90s and early 00s. This is a different market environment. US ECONOMY US economic growth, though moderate, continued for the 9th quarter in a row (Chart below). Economic growth for the first quarter of 2012 was 2.2% slightly below Q4 of 2011 but ahead of Q1, Q2, and Q3 in 2011. By historic standards, this economic recovery has been one of the weakest on record. SLOW COMEBACK Gross domestic product, quarterly change at an annualized rate PCC 05-12
- 2. Almost all previous recoveries saw growth rates that exceeded 5% for a period of time following a recession. This one has not. ECONOMIC RECOVERIES CURRENT RECOVERY Source: Bloomberg For workers, this is by far the weakest recovery when measured by wage income as there has been virtually no income growth since the recession’s end almost 3 years ago. Since the end of the recession in June 2009, per capita disposable income has grown by only 0.7% (Chart below). The average of the four previous recoveries has been 6 %. In 1975 disposable income grew by 10.5%, while at the low end, in 1991, disposable income grew by 4.0% PER CAPITA DISPOSABLE INCOME (Inflation Adjusted) Source: Wall Street Journal PCC 05-12
- 3. US BENEFITS FROM GLOBAL GROWTH However, the US has been a growing beneficiary of stronger global growth (Chart above right). This recovery has seen exports of goods and services rise by 25% since the 2008/09 recession. This is better than each of the previous recoveries in 2001 and 1991 and much better than the 1980 and 1975 recoveries. EXPORTS OF GOODS AND SERVICES (Inflation Adjusted) Source: Wall Street Journal By one measure of manufacturing activity (Chart below), growth remains positive across the global economy, excluding Europe. Despite very negative headlines in Europe and some negative headlines in the US, global manufacturing growth is positive in Eastern Europe, the Far East, South Africa, South America and North America. China is sending mixed signals. US Corporations have been major beneficiaries of both the US export and global growth themes. PCC 05-12
- 4. The 50 largest US corporations, as measured by market capitalization, generate an average of 43% of their sales from non-US markets (Chart below). For those companies that are generating above market growth rates, such as Qualcomm, Caterpillar, Pfizer, Kraft, and IBM, international sales are well over 60%. Not surprisingly, many of these same names are outperforming the broader market. Source: Bloomberg For markets, near term the correction which began ‘in early April has continued through mid May’. With the situation in Greece continuing to worsen and Europe potentially entering a recession again, macro uncertainties are again overshadowing bottom up fundamentals. We expect bipolar environment to continue, with downside and upside risk being about equal. The US election cycle, debt ceiling debate, and potential tax hikes set for 2013, will only heighten the uncertainty. PORTFOLIO CONSIDERATIONS Investors need to continue thinking outside of the framework that has been in place throughout the 80s, 90s and early 00s. This is a different market environment. Key themes to focus on include a dedication to downside protection, aka insurance. Whereas all individuals have insurance for their lives, houses, medical needs and cars, it is surprising how few have similar protections inside their investment portfolios. Opportunities for return include large capitalization firms with global brands and strong balance sheets, many of whom generate stable cash flows and pay healthy dividends. Areas for capital preservation include income generating strategies that can control downside risk and reduce or eliminate most equity market exposure. Additionally, for now, staying out of certain Euro-zone asset classes seems prudent. OLYMPIAN CAPITAL MANAGEMENT PCC 05-12
- 5. DISCLAIMER This Commentary should not be construed by anyone as the rendering of personalized investment advice (or an offer thereof) for compensation. This Commentary, and any information and research contained therein, do not represent a recommendation of investment advice to buy or sell stocks or any financial instrument nor is it intended as an endorsement of any security or investment. This Commentary is for informational purposes only and represents the writer’s or provider’s own investment opinions, and should not be construed as personalized investment advice. Olympian cannot assess, verify, or guarantee the suitability of any particular investment to any personal situation and the reader of this Commentary bear complete responsibility for its own investment research and should seek the advice of a qualified investment and/or tax professional prior to making any investment decisions. Olympian may only transact business or render personalized advice, and offers of service can only be made, in those states or international jurisdictions where Olympian is registered or where an exemption or exclusion from registration is available. Nothing herein is an offer of any service that is not legal for offer into any particular jurisdiction with Olympian’s current licensure (if any). OLYMPIAN, ITS AFFILIATES, AND THEIR OFFICERS, DIRECTORS, PRINCIPALS, AGENTS AND EMPLOYEES MAKE NO RECOMMENTARYS OR WARRANTIES, EXPRESS OR IMPLIED, REGARDING THE SUITABILITY OR OTHER CHARACTERISTICS OF THE INFORMATION AND MATERIALS CONTAINED IN ORPRESENTED THROUGH THIS COMMENTARY. ALL SUCH INFORMATION AND MATERIALS ARE PROVIDED “AS IS”, WITHOUT ANY WARRANTY OF ANY KIND. OLYMPIAN HEREBY FURTHER DISCLAIMS ALL WARRANTIES AND CONDITIONS WITH REGARD TO SUCH INFORMATION AND MATERIALS, INCLUDING ALL IMPLIED WARRANTIES AND CONDITIONS OF MERCHANTABILITY, FITNESS FOR A PARTICULAR PURPOSE TITLE, NON-INFRINGEMENT AND AVAILABILITY. IN NO EVENT SHALL OLYMPIAN, ITS AFFILIATES, OR THEIR OFFICERS, DIRECTORS, PRINCIPALS, AGENTS AND EMPLOYEES BE LIABLE FOR ANY CLAIMS. LIABILITIES, LOSSES, COSTS OR DAMAGES, INCLUDING DIRECT, INDIRECT, PUNITIVE, INCIDENTAL, SPECIAL, CONSEQUENTIAL DAMAGES (INCLUDING BUT NOT LIMITED TO, LOST PROFITS OR TRADING LOSSES), OR DAMAGES OF ANY KIND WHATSOEVER ARISING OUT OF OR IN ANY WAY CONNECTED WITH THIS COMMENTARY (INCLUDING WITHOUT LIMITATION, THE CONTENT, INFORMATION, MATERIALS OR RESEARCH INCLUDED THEREIN) WHETHER BASED ON THEORIES ARISING IN CONTRACT, TORT, STRICT LIABILITY OR OTHERWISE. SUCH LIMITATIONS APPLY EVEN IF OLYMPIAN, ITS AFFILIATES, OR ANY OF THEIR OFFICERS, DIRECTORS, PRINCIPALS, AGENTS OR EMPLOYEES HAVE BEEN ADVISED OF THE POSSIBILITY OF DAMAGES PCC 05-12