Outrunning the Tsunami of Change
•
0 likes•648 views

Leadership in an age of uncertainty. How to lead your own movement

Recommended
Recommended
More Related Content
More from GomindSHIFT
More from GomindSHIFT (20)
Recently uploaded
Recently uploaded (20)
Outrunning the Tsunami of Change
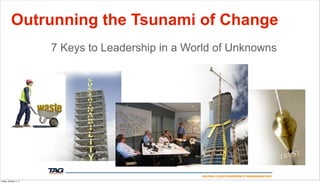
- 1. Outrunning the Tsunami of Change 7 Keys to Leadership in a World of Unknowns HELPING CLIENTS EXPERIENCE TRANSFORMATION Friday, October 7, 11
- 2. it is 2000 HELPING CLIENTS EXPERIENCE TRANSFORMATION Friday, October 7, 11
- 3. HELPING CLIENTS EXPERIENCE TRANSFORMATION Friday, October 7, 11
- 4. Value: i.e. Warren Buffett HELPING CLIENTS EXPERIENCE TRANSFORMATION Friday, October 7, 11
- 5. 2005 switches strategies HELPING CLIENTS EXPERIENCE TRANSFORMATION Friday, October 7, 11
- 6. april 2008 HELPING CLIENTS EXPERIENCE TRANSFORMATION Friday, October 7, 11
- 7. HELPING CLIENTS EXPERIENCE TRANSFORMATION Friday, October 7, 11
- 8. $1 = $.50 $1 = $1000 HELPING CLIENTS EXPERIENCE TRANSFORMATION Friday, October 7, 11
- 9. 2 years of income in lost wealth HELPING CLIENTS EXPERIENCE TRANSFORMATION Friday, October 7, 11
- 10. HELPING CLIENTS EXPERIENCE TRANSFORMATION Friday, October 7, 11
- 11. what did he see? HELPING CLIENTS EXPERIENCE TRANSFORMATION Friday, October 7, 11
- 12. the rules changed HELPING CLIENTS EXPERIENCE TRANSFORMATION Friday, October 7, 11
- 13. why? HELPING CLIENTS EXPERIENCE TRANSFORMATION Friday, October 7, 11
- 14. aspergers syndrome HELPING CLIENTS EXPERIENCE TRANSFORMATION Friday, October 7, 11
- 15. HELPING CLIENTS EXPERIENCE TRANSFORMATION Friday, October 7, 11
- 16. HELPING CLIENTS EXPERIENCE TRANSFORMATION Friday, October 7, 11
- 17. tour guide framework HELPING CLIENTS EXPERIENCE TRANSFORMATION Friday, October 7, 11
- 18. 2011 Economic Score Card •Construction & Real Estate •renovation up 25% •public sector flat •private sector off 40% •@17% vacancy in Denver •8,000,000 jobs lost •100,000 jobs/month to keep even •Estimated 10 years to climb back to pre-2008 levels •GDP @$14.5 trillion 2008 - 2011 •Companies are profitable but holding cash •Government dysfunction creates uncertainty •European uncertainty •Our banking system is weak •Financial industry has returned to pre-2008 behavior HELPING CLIENTS EXPERIENCE TRANSFORMATION Friday, October 7, 11
- 19. 2011 Summary of Score Card •Low Demand •More Output with Less •Uncertainty •Old Behaviors •Lack of Confidence in Leadership HELPING CLIENTS EXPERIENCE TRANSFORMATION Friday, October 7, 11
- 20. Friday, October 7, 11
- 21. Eras of Rule Change Oral Age Print Age Broadcast Age Digital Age Prin%ng Press Television Internet 1455 1950 1992 Ancient Modern Era Contempory Post Modern Authority Kings Elected Visionaries Grass Roots CRISIS CRISIS CRISIS Credentials Position Credentials Appeal Community Influence Elders Experts Influentials Creatives Commerce Agriculture Factory Service Federation Friday, October 7, 11
- 22. 7 Mega-Shifts 1.Turbulence and Uncertainty 2.Low Trust 3.Smaller Footprint 4.Generation Tsunami 5.Digital Natives 6.Mobility 7.Death of the Industrial Mindset HELPING CLIENTS EXPERIENCE TRANSFORMATION Friday, October 7, 11
- 23. Different Seas Different Ships The New Normal Friday, October 7, 11
- 24. HELPING CLIENTS EXPERIENCE TRANSFORMATION Friday, October 7, 11
- 25. Silents: 1925 - 1942 (86-69) Boomers: 1943 - 1960 (68-51) GenX’rs: 1961 - 1981 (50-30) Millennials: 1982 - 2000 (29-11) New Silents: 2001 - HELPING CLIENTS EXPERIENCE TRANSFORMATION Friday, October 7, 11
- 26. Friday, October 7, 11
- 27. 2011 Boomer 55% Millennials 12% GenX 33% Friday, October 7, 11
- 28. Friday, October 7, 11
- 29. 2018 Millennials 48% GenX Boomers 24% 28% Friday, October 7, 11
- 30. Digital Immigrants Digital Natives Friday, October 7, 11
- 31. Print Linear, Sequential, Rational, Hierarchical, Autonomous Broadcast Fluid, Fragmented, Emotional, Flat, Isolated Digital/Interactive Holistic, Non-linear, Whole-Brain Systems Thinkers, Interconnected, Self-Organizing Friday, October 7, 11
- 32. What does it mean to have an organization of mobile knowledge workers? Friday, October 7, 11
- 33. Friday, October 7, 11
- 34. HELPING CLIENTS EXPERIENCE TRANSFORMATION Friday, October 7, 11
- 35. Friday, October 7, 11
- 36. What is the Real Crisis? HELPING CLIENTS EXPERIENCE TRANSFORMATION Friday, October 7, 11
- 37. Friday, October 7, 11
- 38. Sutter Health Past Experience Friday, October 7, 11
- 39. Results of a Broken System • $300-$500 billion annual WASTE (buildingSmartAlliance) • 50%+ Waste in the System (buildingSmartAlliance and Lean Construction Institute) • 70% Over Budget and Late (Egan report) • 48% of Green House Gases (Energy Info Admin Statistics and Pew Climate report) Friday, October 7, 11
- 40. Uncovering the Hidden Waste • Labor = 50% @ 30% efficiency = 35% waste • Materials = 40% @ 70% efficiency = 12% waste • QTO = up to10% of the cost • Change orders between 2-10% of the cost • Contingencies up to 7% • Team Learning Curve = 5%+ • 3-7% is lost in project cost reduction by not maximizing Construction Tax Planning HELPING CLIENTS EXPERIENCE TRANSFORMATION Friday, October 7, 11
- 41. 7 Keys to Leading A Movement 1.Motive: Adventure, Fear or Fed-Up 2.Find Like-Minded Souls 3.Get Cover 4.Study the Outliers 5.Connect the Dots 6.Create Proof of Concept 7.Be the Change You Want to See HELPING CLIENTS EXPERIENCE TRANSFORMATION Friday, October 7, 11
- 42. HELPING CLIENTS EXPERIENCE TRANSFORMATION Friday, October 7, 11
- 43. Who we are so far… Friday, October 7, 11
- 44. Built-In Sustainability Aardex - Signature Center Golden, Colorado LEED Platinum $3/sqft less than conventional 21% lease premium - 45% Tenants reported increased productivity HELPING CLIENTS EXPERIENCE TRANSFORMATION Friday, October 7, 11
- 45. Sutter Health Now Experience Now Before Friday, October 7, 11
- 46. GSA Edith Green Wendell Wyatt HS Wright/Balfour & SERA 500,000 square feet CMc 47 months Save 15 - 27 months of design Zero energy HELPING CLIENTS EXPERIENCE TRANSFORMATION Friday, October 7, 11
- 47. Improvements •Tools Alone - 5% - 7% •Principles Alone - 10% - 15% •Principles AND Tools - 15% - 30%+ HELPING CLIENTS EXPERIENCE TRANSFORMATION Friday, October 7, 11
- 48. HELPING CLIENTS EXPERIENCE TRANSFORMATION Friday, October 7, 11
- 49. HELPING CLIENTS EXPERIENCE TRANSFORMATION Friday, October 7, 11
- 50. 10,400 out of 4.7 million HELPING CLIENTS EXPERIENCE TRANSFORMATION Friday, October 7, 11
- 51. Energy Savings Improvement 35% 26 Year Payback 30% (38%) 25% EMPIRE STATE BUILDING 20% 8.8 Year Payback 15% 11 Year Payback (21.5%) (23%) 10% 12.2 Year Payback BEACH (15.8%) CHICAGO BALTIMORE NEWPORT 5% 0 3 6 9 12 15 18 21 24 27 30 NAIOP study results* * NAIOP results under 25% improvements and average a 10 year payback HELPING CLIENTS EXPERIENCE TRANSFORMATION Friday, October 7, 11
- 52. A Brown Process Can Not Create a Green Solution HELPING CLIENTS EXPERIENCE TRANSFORMATION Friday, October 7, 11
- 53. HELPING CLIENTS EXPERIENCE TRANSFORMATION Friday, October 7, 11
- 54. Holy Grail Workplace Performance HELPING CLIENTS EXPERIENCE TRANSFORMATION Friday, October 7, 11
- 55. 2.0 HELPING CLIENTS EXPERIENCE TRANSFORMATION Friday, October 7, 11
- 56. Performance and Resilience 1.Cultural Alignment 2.Engagement 3.Well-Being 4.Work Flow 5.Health & Safety 6.Tools 7.Teams HELPING CLIENTS EXPERIENCE TRANSFORMATION Friday, October 7, 11
- 57. 7 Keys to Leading A Movement 1.Motive: Adventure, Fear or Fed-Up 2.Find Like-Minded Souls 3.Get Cover 4.Study the Outliers 5.Connect the Dots 6.Create Proof of Concept 7.Be the Change You Want to See HELPING CLIENTS EXPERIENCE TRANSFORMATION Friday, October 7, 11
- 58. Call To Action •Shirtless Dancer? - Michael Burry •First Follower? - Mindshift •Wait Until there is a Crowd? - Green Movement •Sit and Watch? Friday, October 7, 11
- 59. HELPING CLIENTS EXPERIENCE TRANSFORMATION Friday, October 7, 11
- 60. www.rexmiller.net www.thecrerevolution.com twitter: @mrmiller HELPING CLIENTS EXPERIENCE TRANSFORMATION Friday, October 7, 11