1. Political Issues in the UK
Electoral Systems, Voting
and Political Attitudes
Exam questions in this section tend to concentrate on one of two themes; either a
comparison of First Past The Post versus another voting system, or a question on the
factor which has the greatest influence on voting behaviour.
NOTE: First past the post is also often referred to the Simple Majority System
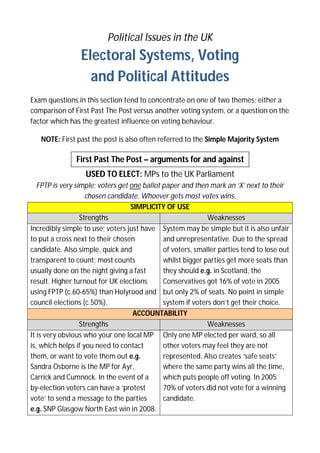
First Past The Post – arguments for and against
USED TO ELECT: MPs to the UK Parliament
FPTP is very simple; voters get one ballot paper and then mark an ‘X’ next to their
chosen candidate. Whoever gets most votes wins.
SIMPLICITY OF USE
Strengths
Weaknesses
Incredibly simple to use; voters just have System may be simple but it is also unfair
to put a cross next to their chosen
and unrepresentative. Due to the spread
candidate. Also simple, quick and
of voters, smaller parties tend to lose out
transparent to count; most counts
whilst bigger parties get more seats than
usually done on the night giving a fast
they should e.g. in Scotland, the
result. Higher turnout for UK elections
Conservatives got 16% of vote in 2005
using FPTP (c.60-65%) than Holyrood and but only 2% of seats. No point in simple
council elections (c.50%).
system if voters don’t get their choice.
ACCOUNTABILITY
Strengths
Weaknesses
It is very obvious who your one local MP Only one MP elected per ward, so all
is, which helps if you need to contact
other voters may feel they are not
them, or want to vote them out e.g.
represented. Also creates ‘safe seats’
Sandra Osborne is the MP for Ayr,
where the same party wins all the time,
Carrick and Cumnock. In the event of a
which puts people off voting. In 2005
by-election voters can have a ‘protest
70% of voters did not vote for a winning
vote’ to send a message to the parties
candidate.
e.g. SNP Glasgow North East win in 2008.
2. STRONG GOVERNMENT
Strengths
FPTP usually delivers strong, stable
government e.g. 7/8 elections since 1979
using FPTP have resulted in a majority
government. This allows the government
to do the job they were elected for e.g.
in 2005 Labour were elected with a
majority of 66 MPs.
Weaknesses
FPTP does not always produce an overall
winner e.g. Conservative/Lib Dem
coalition in 2010. It is also undemocratic
if a government is elected with less than
half the vote, as usually happens e.g. the
2005 Labour government had a majority
of 66 MPs but only got 35% of the vote.
Single Transferable Vote – arguments for and against
USED TO ELECT: Local councillors in Scotland
In STV elections voters get one ballot paper. They rank chosen candidates in order of
preference (1,2,3, etc). All the ‘1’ votes are then counted; if no candidate is elected
the bottom candidate drops out and their ‘2’ votes counted until there is a winner.
SIMPLICITY OF USE
Strengths
Weaknesses
Whilst it might be slightly more difficult
Can be seen as complex. Voters have to
to use the ultimate result it gives is
rank candidates with numbers, instead
closer to the wishes of the electorate
of putting an ‘X’ next to one name; this
than FPTP. 2007-2012, 2/32 Scottish
may put people off e.g. in 2007 there
councils had a majority party; 2012were tens of thousand of spoiled ballot
2017, 6/32 councils have a majority
papers when STV was introduced. Low
party. This is in line with voters who do
turnout in 2012 elections (32%) suggests
not, as a majority, back any single party. voters put off too.
ACCOUNTABILITY
Strengths
Weaknesses
Voters have a great deal of choice about There is more than one representative
which candidates they vote for, unlike
for each ward (3 or 4), this can create
FPTP e.g. you rank candidates 1,2,3 so
confusion e.g. who is your local
can select multiple parties and
councillor that you know to contact?
candidates. In Glasgow in 2012, Labour
Also leads to ‘donkey voting’ where
and the SNP stood multiple candidates in voters simply vote for candidates from
each ward; voters could choose to vote
the same party 1,2,3 in alphabetical
for some or all of them. This forces
order, rather than choosing best
councillors to work hard for votes.
candidate; SNP Adams beats SNP Wilson!
2
3. STRONG GOVERNMENT
Strengths
STV produces coalitions which are more
representative of what people want,
rather than government being elected by
less than half the population. It is also
more representative because it ensures
that more parties are elected, rather
than one or two dominating under FPTP
e.g. Glasgow council 2012-2017, six
different political parties represented
Weaknesses
STV elections almost always result in
coalitions; this is undemocratic as noone votes for a coalition and can lead to
secret deals being made being between
parties after elections e.g. 2012-2017,
Edinburgh Council run by SNP/Labour.
Can give smaller parties too much power
by making them the ‘king makers’ who
get to choose which party runs council.
Additional Member System – arguments for and against
USED TO ELECT: MSPs to the Scottish Parliament
In AMS elections voters get two ballot papers. The first is for the Constituency and
works the same as a FPTP election. The second is for the Region and here they vote
for a political party. Parties receive List MSPs based on their total Regional vote.
SIMPLICITY OF USE
Strengths
Weaknesses
Only slightly more complex than FPTP;
Sometimes accused of being more
caused no problems in 1999, 2003 and
confusing than FPTP, because it has two
2011 elections. Results in voters being
ballot papers. Massive confusion in 2007
better represented; they have 8 MSPs to when STV was introduced alongside
choose to contact (1 constituency, 7
AMS, resulting in thousands of spoiled
Regional) e.g. Ayr’s MSP is John Scott but papers.
there are 7 South of Scotland MSPs too
ACCOUNTABILITY
Strengths
Weaknesses
Two votes give voters more choice; they Gives power to parties; voters choose a
can vote for one party in their
party but parties decide who becomes a
constituency and a different party on the List MSP; hard to remove unpopular List
Regional List. Results in more parties
MSPs. Leads to ‘unelected’ MSPs; if a List
being elected and represented e.g. 1999- MSP resigns they are just replaced by the
2011, various smaller parties (Scottish
next List candidate e.g. Lib Dem Andrew
Socialists and Senior Citizens Party) and
Arbuckle became MSP overnight after
independents were elected.
Keith Raffan resigned.
3
4. STRONG GOVERNMENT
Strengths
Outcome is more in line with what public
want e.g. 1999-2011, coalition or
minority government were public’s
choice; 2011, SNP won a majority.
Coalition or minority government a good
thing; means more viewpoints listened
to, which is a good thing if no one party
gets more than half the vote.
Weaknesses
AMS tends to result in coalitions or
minority governments; this can be
undemocratic as no-one votes for a
coalition and it leads to secret deals e.g.
Labour/Lib Dem coalition, 1999-2007.
SNP minority government, 2007-2011
was often defeated by other political
parties e.g. minimum alcohol pricing.
Party List – arguments for and against
USED TO ELECT: MEPs to the European Parliament
In Party List elections voters get one ballot paper. They put an ‘X’ next to their
chosen political party. All votes in Scotland are then counted together and parties
given MEPs based on share of the vote e.g. if you get 1/3 of vote, you get 2/6 MEPs
SIMPLICITY OF USE
Strengths
Weaknesses
Simple to use and the fairest (most
Simple to use but takes power away
representative) of all voting systems e.g. from voters e.g. all voters can do is
in Scotland in 2009, SNP got 30% of vote choose a party; they cannot decide
and 33% of MEPs, Conservatives got 16% which candidate they want elected.
of vote and 17% of MEPs. This means the Parties too powerful. Can be harder to
end result is closest to what the public as get unrepresented groups elected e.g.
a whole wants.
only one female MEP in Scotland out of
six; no ethnic minorities
ACCOUNTABILITY
Strengths
Party List ensures a much wider range of
parties and views get elected, in line with
public wishes e.g. out of six Scottish
MEPs, there are four different parties
represented. Also helps smaller parties
get elected e.g. the UK has a Green MEP
and UKIP MEPs too
Weaknesses
Takes away the voter/ constituency link;
MEPs are not directly elected to
represent a specific area e.g. Scotland
elects six MEPs for whole country. This
makes it hard for voters to get rid of an
unpopular MEP.
4
5. STRONG GOVERNMENT
Strengths
Coalitions are most likely outcome; this
is a good thing as it is closer to what the
public wants than a minority vote party
winning the election on its own e.g.
forces parties from across Europe to join
together in voting groups to best
represent what European voters want.
Weaknesses
Much more likely to result in coalitions;
this can be undemocratic as no-one
votes for a coalition and it leads to secret
deals after the elections. Coalitions
unstable and can fall apart e.g. UK
Conservative MEPs left EU Conservative
Group over disagreements.
This next section will examine the different voting influences which exist. It will
discuss long-term factors i.e. things that generally don’t change over time such as
race, gender, class, etc. It will also look at short-term factors which can be different
at each election i.e. issues, the media and the party’s campaigns/personalities.
Voting influences – Long terms factors
SOCIAL CLASS
Arguments for
Arguments against
Traditionally the main voting influence in Since 1970s class has become less
the UK; working class = Labour, middle/
relevant in society and so less important
upper class = Conservative. ABC1 voters to party support (dealignment). More
still most likely to vote Conservative,
people now floating voters (willing to
C2DE voters still most likely to vote
change between elections). In 2010
Labour e.g. in 2010 election, 44% of AB
election biggest share of C2 women
men voted Conservative, 45% of DE
voted Conservative (41%).
women voted Labour
GENDER
Arguments for
Arguments against
Traditionally women most likely to vote
Class, not gender, important. Poor
Conservative; in 2010 men and women
women most likely to vote Labour e.g.
were most likely to vote Tory (38% and
45% of DE women voted Labour in 2010.
36% respectively). Parties have also
Rich women more likely to vote
spent huge amounts of money targeting Conservative e.g. 39% of C1 in 2010.
specific women e.g. ‘School Gate Mum’
Variations depending on age too e.g.
(working mums with responsibilities)
most 25-34 year old women vote Labour.
5
6. RACE
Arguments for
Arguments against
Ethnic minorities only worth about 5% of Race is really class; EMs tend to be
vote but often concentrated in certain
poorer, which is the group most likely to
constituencies, making it important. EMs vote Labour. Differences between
most likely to vote Labour (party usually specific EM groups e.g. in 2005, rich
promoted pro-EM laws e.g. Race
Asians (Group AB) most likely to vote
Relations Act). In 2005 56% of EM voted Conservative; 80% of British African EMs
Labour, only 19% voted Conservative.
voted Labour.
GEOGRAPHY
Arguments for
Arguments against
Clear link between area and voting;
Labour/Conservative divide caused by
Labour strong in cities, north of England two-horse nature of FPTP. Actually about
and Scotland; Conservative strong in
class; areas which are most likely to vote
south east England e.g. 41/59 Scottish
Labour (Scotland, north England) are
MPs are Labour. Well-off constituencies traditionally poorer and have industrial
vote Labour too e.g. Jim Murphy MP
background; Conservative areas usually
(Labour) elected in rich East
richer e.g. Conservatives won wealthy
Renfrewshire constituency.
Richmond constituency, even though this
is in north of England.
Voting influences – Short terms factors
THE MEDIA
Arguments for
Media is the main way that public finds
out about politics, parties spend millions
developing their media image e.g. spin
doctors. Newspapers often back political
parties e.g. since 1979 whichever party
The Sun has backed has won most MPs.
Newspapers are read by more than half
the population each day and are often
biased e.g. Daily Mail supports the
Conservatives, Daily Record backs Labour
Arguments against
Media’s influence can be overstated; the
fact that there are so many safe seats in
the UK shows people vote on class,
gender, etc and don’t change their vote.
Many people also buy a paper based on
which party they support; they don’t
change their vote because of what they
read. Also TV news (where most people
watch politics) by law has to be neutral,
so this can’t influence them either.
6
7. CAMPAIGNS/PERSONALITY
Arguments for
Arguments against
UK elections moving towards a more
Role of leader can be overstated e.g. in
presidential system in recent years,
2005 Tony Blair’s Labour won most MPs
focus on party leaders and their
yet 61% of people thought Blair was
background/personality. e.g. Web
untrustworthy! Media is a big issue;
Cameron internet site. Huge part of SNP most focus goes on Labour/Conservative,
Holyrood success because of Alex
so they win most seats. In 2011 The Sun
Salmond’s famous profile, compared to
backed Alex Salmond as First Minister
Labour’s anonymous Iain Gray.
and the SNP won a Holyrood majority.
ISSUES
Arguments for
Arguments against
Important issues change between
Other factors such as class, gender, etc
elections e.g. in 2005 health and
also important; they don’t change
education were top issues, in 2010 it was between elections. Issues can be
unemployment and MPs expenses. This
overstated e.g. Iraq War regularly given
supports rise of floating voters who
as a big issue in elections yet war started
change vote each time. Scotland a good in 2003 and Labour re-elected in 2005.
example; Labour wins most MPs in UK
Media ultimately key; big issues in 2010
elections, SNP gets most MSPs in
were MPs expenses and trust, all
Scottish Parliament elections.
because of the Daily Telegraph story.
Voting influences – The Media
NEWSPAPERS
Arguments for
Over half of adults read a newspaper
each day, this has a huge influence e.g.
since 1979 The Sun has backed the party
which won most MPs. The Sun backed
Alex Salmond as First Minister when the
SNP won a Holyrood majority in 2011.
Many newspapers are biased e.g. Daily
Record backs Labour, etc. Social
scientists W. Miller found most people
were influenced by newspaper coverage.
Arguments against
Number of safe seats in the UK shows
people vote on class, gender, etc and
don’t change their vote. Many people
also buy a paper based on which party
they already support; they don’t change
their vote because of what they read. In
2005 only 10% of people said they
thought their vote was influenced by
newspaper coverage; people are aware
of bias so consider this when reading.
7
8. TELEVISION
Arguments for
Parties spend huge amounts on TV
media training for leaders. TV is the way
most adults get political news e.g. during
elections 2/3 of adults say they have
seen TV election coverage. Parties will
fight to get equal coverage e.g. SNP took
court action to try and get Alex Salmond
onto 2010 UK leaders’ TV debate.
Arguments against
By law TV political coverage has to be
balanced; they cannot take sides and
must give all parties their say. Most
voters (70%) say they have decided who
to vote for before TV election coverage
even starts. Like newspapers, TV
coverage may also reinforce opinions
already held. Many people get bored and
switch off TV political coverage anyway.
INTERNET/NEW MEDIA
Arguments for
Arguments against
New media e.g. sites like You Tube and
Only about 1% of people say internet is
Facebook are the fastest growing type of their main source of political news e.g.
media. Public finds out news instantly
most read newspapers, watch TV.
and can even directly communicate with Reinforcement here e.g. Labour voters
politicians e.g. Twitter messages. Parties read Labour websites, same for the SNP,
spend a lot of money on websites and
etc. Voters are aware of lies and
online campaigns, especially to try and
inaccuracy on the internet so don’t let it
engage younger voters.
influence them. Younger people most
likely to use Twitter, least likely to vote.
8
9. Electoral Systems, Voting and Political Attitudes
Past Paper questions
2012
To what extent is media the most important factor affecting voting
behaviour?
2011
“Some factors affecting voting behaviour are more important than
others.” Discuss.
2010
“The Single Transferable Vote electoral system provides for better
representation than First Past the Post.” Discuss.
2009
Critically examine the view that the media is the most important
influence on voting behaviour.
2008
Assess the influence of social class on voting behaviour.
2007
“The Additional Member System gives voters more choice and better
representation than does First Past The Post.” Discuss.
9