10.1 reinf ditstance_time%20_graph
- 1. NAME DATE CLASS
10.1 Measuring Motion and Speed REINFORCEMENT
Chapter 3 Use with Text Pages 318-324
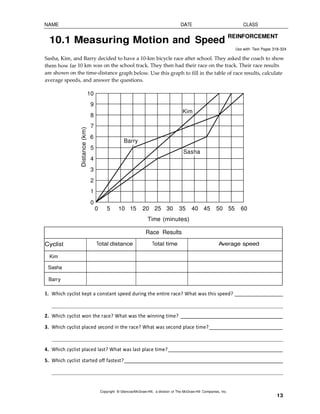
Sasha, Kim, and Barry decided to have a 10-km bicycle race after school. They asked the coach to show
them how far 10 km was on the school track. They then had their race on the track. Their race results
are shown on the time-distance graph below. Use this graph to fill in the table of race results, calculate
average speeds, and answer the questions.
10
9
Kim
8
7
Distance (km)
6
Barry
5
Sasha
4
3
2
1
0
0 5 10 15 20 25 30 35 40 45 50 55 60
Time (minutes)
Race Results
Cyclist Total distance Total time Average speed
Kim
Sasha
Barry
1. Which cyclist kept a constant speed during the entire race? What was this speed?
2. Which cyclist won the race? What was the winning time?
3. Which cyclist placed second in the race? What was second place time?
4. Which cyclist placed last? What was last place time?
5. Which cyclist started off fastest?
Copyright © Glencoe/McGraw-Hill, a division of The McGraw-Hill Companies, Inc.
13