

Recommandé
Contenu connexe
Tendances
Tendances (20)
En vedette
Similaire à Population
Similaire à Population (20)
Population
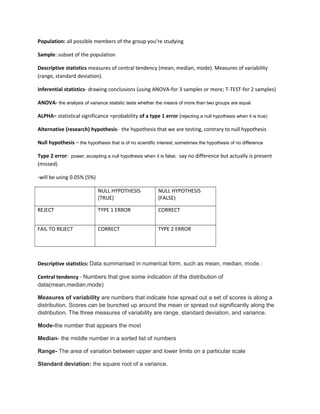
- 1. Population: all possible members of the group you’re studying Sample: subset of the population Descriptive statistics measures of central tendency (mean, median, mode). Measures of variability (range, standard deviation). Inferential statistics- drawing conclusions (using ANOVA-for 3 samples or more; T-TEST-for 2 samples) ANOVA- the analysis of variance statistic tests whether the means of more than two groups are equal ALPHA= statistical significance =probability of a type 1 error (rejecting a null hypothesis when it is true) Alternative (research) hypothesis- the hypothesis that we are testing, contrary to null hypothesis Null hypothesis – the hypothesis that is of no scientific interest; sometimes the hypothesis of no difference Type 2 error: power; accepting a null hypothesis when it is false; say no difference but actually is present (missed) -will be using 0.05% (5%) NULL HYPOTHESIS NULL HYPOTHESIS (TRUE) (FALSE) REJECT TYPE 1 ERROR CORRECT FAIL TO REJECT CORRECT TYPE 2 ERROR Descriptive statistics: Data summarised in numerical form, such as mean, median, mode.: Central tendency - Numbers that give some indication of the distribution of data(mean,median,mode) Measures of variability are numbers that indicate how spread out a set of scores is along a distribution. Scores can be bunched up around the mean or spread out significantly along the distribution. The three measures of variability are range, standard deviation, and variance. Mode-the number that appears the most Median- the middle number in a sorted list of numbers Range- The area of variation between upper and lower limits on a particular scale Standard deviation: the square root of a variance.
- 2. Variance- how far values lay from the mean; the square of standard deviation Directional Hypothesis – one tailed test; results in one sample will be higher than the other. A n alternative hypothesis that predicts that the results of one condition will be greater (or less) than another, rather than a prediction that they will simply differ. Non-directional hypothesis – two tailed test; results will differ in some way (could be negative or positive) Correlated samples- testing same individuals at different times; within subject ( all participants are exposed to every treatment or condition.) Independent samples- testing across individuals (groups) ; between subject Non Empirical Authority: -Source of expert info/advice (God, government, parents) -Can be wrong despite their convictions -Plays diminished role in science Logic: -System/mode of reasoning -Logical argument (deductive) if A+B are true= C follows -Useful as statements/ arguments they’re based upon -important to science, does not substitute for empirical evidence Intuition: -Spontaneous perception/ judgments (first impression) -Common sense (shared attitudes, standard change over time, location) Characteristics of science: -Empirical (based on experiences) -Objective (knowledge through observations; allows replication) -Self-correcting (new evidence corrects previous beliefs) Assumptions of Sciece:
- 3. -Realism: physical objects exist independently -Rationality -Regularity: world conforms to same universal laws nothing about human behavior falls outside of laws nature -Discoverability: belief that it’s possible to answer any questions through use of scientific methods -Causality: belief all events are caused (determinism VS. free will) -Discovery of regularities: describing phenomena; discovering laws 1) Law- statement that certain events are regularly associated w each other in an orderly way 2) Does not necessarily imply cause-effect; searching for causes Development of theories: 1) Theory- statement explaining 1 or more laws: -typically use at least 1 concept -concept: thought/notion; not observed directly. 2) Theories must be falsifiable Role of Theories: 1) Organize knowledge/ explain laws - Good theories explain a large # of events + laws 2) Predict new laws -discovery in one area opens up doors to others 3) guide research 4) Prediction + control Hypothesis- statement assumed to be true for purpose of testing its validity Operationalism- belief that scientific concepts must be defined in terms of observable observations. - Concept must be tied to something that can be observed/ experienced directly - Operational definition: precise description of a procedure used to empirically test a theoretical concept
- 4. • Collect a few different measures when performing an experiment to be more accurate. • Be able to manipulate the variable – better for accuracy • Self report measures + observe the participants • When measuring don’t generalize be specific • Be very detailed in writing- to counteract questionable situations + repetition of experiment/research Chapter 5 Variables- an aspect of testing condition that changes w different conditions - Operationalize theoretical concepts: a) Concepts = intangible (abstract) [anger, happiness, hunger] b) Variables = tangible [exam answers, level presses, # of customers served Variable types: 1. Independent variables (IV) – condition manipulated (or selected) by experimenter to determine its’ effects on behavior. Researcher must be able to control variable -must have minimum 2 different levels (values) -all other variables held constant -subject variable -typically used in correlational studies 2. Dependent variable (DV)- measure of subjects’ behavior that reflects the IVs’ effects. Can be measured across several dimensions. - Frequency: the # of times behavior is performed - Rate: frequency relative to time (MPH, WPH) -Duration: the # of time behavior lasts -Latency: time btw instruction and initiation of behavior -Topography: shape/style of behavior
- 5. -Force: intensity/ strength of behavior -Locus: where the behavior occurs in the environment Confounded Variable – one whose effects cannot be separated from the supposed IV Covarying factors- can’t easily separate effects out Other Variable Types: • Quantitative: varies in amount ( age, # of lever presses) • Categorical: varies in kind (college major, gender) • Continuous: falls along continuum (not limited to a certain number of values; weight, height) • Discrete: falls into separate “bins” (no intermediate values possible; murders committed, guests served) Measurement: Process of assigning numbers to events or objects according to a set of rules. Types of measurement scales: 1. Nominal: divides into categories 2. Ordinal: ranks in order of magnitude (one category, different options) 3. Interval: differences btw numbers are meaningful 4. Ratio: has a meaningful zero • Reliability- getting the same result across repeated measures of the same behavior -Test-retest reliability: degree to which the same test score would be obtained on separate occasions (SAT, GRE) -Internal consistency: degree to which various items on a test measure the same thing (GRE, sports trivia) • Validity- the extent to which the experiment measures what it is supposed to -measure should be reliable before it is valid -Construct validity:
- 6. Does the test measure the theoretical constructs it’s supposed to and no others? -Face validity: Does the test appear to measure what it’s supposed to? -Types of validity: 1) Content Validity: Does the test sample the range of behavior represented by the concept being tested? 2) Criterion Validity: Does the test correlate w other measures of the same construct? How well does our test correlate with others? 3) Measurement error: -Random error (aka error variance): Variability associated with a consistent bias. Ensure that all groups/conditions are equally affected by it, if it cannot be eliminated. Total Variance (DV) = tx Variance (IV) + Relevant/Confound Variable (RV) +Random Error (always alpha 0.05%) Ex: Strength of connection = cable/router modem + # of devisec; distance; interferer + .05%