WBC Composite Histogram Interpretation
•Télécharger en tant que PPT, PDF•
106 j'aime•39,398 vues

This document provides information about interpreting histograms generated by hematology analyzers when performing complete blood count (CBC) tests. It includes histograms showing normal and abnormal patterns for red blood cells, white blood cells, and platelets. Abnormal indicators are described that may indicate issues like schistocytes, transfusion, autoagglutination, microcytosis, macrocytosis, nucleated red blood cells, atypical lymphocytes, and more. The document emphasizes the importance of correlating histogram findings with peripheral blood smear examination to make an accurate diagnosis.

Recommandé
Contenu connexe
Tendances
Tendances (20)
Similaire à WBC Composite Histogram Interpretation
Similaire à WBC Composite Histogram Interpretation (20)
Plus de Narmada Tiwari
Plus de Narmada Tiwari (16)
Dernier
Dernier (20)
WBC Composite Histogram Interpretation
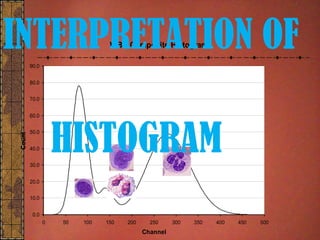
- 1. WBC Composite Histogram 0.0 10.0 20.0 30.0 40.0 50.0 60.0 70.0 80.0 90.0 0 50 100 150 200 250 300 350 400 450 500 Channel Count INTERPRETATION OF HISTOGRAM
- 2. Histograms are graphic representation of cell frequencies verses size. Histogram provide information about erythrocytes ,leukocytes and platelet frequency and distribution as well as presence of subpopulation. Shift in one direction or another can be of diagnostic importance.
- 3. Produced from thousands/millions of signals generated by the cells passing through detector where they are differentiated by: Their size Frequency of occurrence in the population
- 4. 3-part differential usually cont Granulocytes or large cells Lymphocytes or small cells Monocytes(mononuclear cells) or (middle cells) 5-part classify cells to Neutrophils Eosinophils Basophils Lymphocytes Monocytes
- 5. A sixth category designated “large unstained cells” include cells larger than normal and lack the peroxidase activity this include ◦ Atypical lymphocytes ◦ Various other abnormal cells. Other counters identifies 7 categories including ◦ Large immature cells(composed of blasts and immature granulocytes) ◦ Atypical lymphocytes(including blast cells).
- 6. Hematology analyzer provide mathematical results obtained by electrical and light signals generated when blood cells pass through sensing zone of the machine. Two method- 1- electrical impedance counting 2- light scatter method.
- 7. Cell counting Coulter Principle Dilution Vacuum and pressure Electrical impedance Reagent systems
- 8. Sensing Zone Red Blood Cell The Coulter PrincipleThe Coulter Principle A red cell passes through RBC aperture Oscilloscope
- 9. Sensing Zone Neutrophil Oscilloscope The Coulter PrincipleThe Coulter Principle A white cell passes through WBC aperture
- 10. Before adding lysing reagent After Cell diameter in μm fl Neutrophils 10 - 15 120 - 250 Basophils 9 - 14 70 - 130 Eosinophils 11 - 16 80 - 140 Monocytes 12 - 20 60 - 120 Lymphocytes 7 – 12 30 - 80
- 11. Discriminations thresholds Platelet- with a volume of 8-12 fl are counted from 2-30 fl. RBC- with volume of 80-100 fl is detected from 30 -250 fl. WBC- RBC are lysed by lytic reagent .the different WBC discriminator set at different levels between the ranges of 30-450 fl.
- 12. Normal Histogram Threeparts differential whitebloodcells: 30 to 125µ3 : lymphocytes 125 to 160µ3 : monocyte 160 to 450 µ3 : granulocytes
- 13. WBC Composite Histogram 0.0 10.0 20.0 30.0 40.0 50.0 60.0 70.0 80.0 90.0 0 50 100 150 200 250 300 350 400 450 500 Channel Count
- 14. Eos Baso Coulter WBC Histogram Lymphs 30 – 90 fL Monos 90 -160 fL Neuts 160 - 450 fL
- 17. RBC HISTOGRAM FRAGMENTS, MICROCYTIC RBCs, Giant PLTRAGMENTS, MICROCYTIC RBCs, Giant PLTDI RBCsDI RBCs MACROCYTIC, TARGET CELLS, DI RMACROCYTIC, TARGET CELLS, DI RB COLDAGGLUTININCOLDAGGLUTININ Post TransfusionPost Transfusion
- 19. PLT HISTOGRAMS Giant Platelets Small Platelets
- 20. WBC HISTOGRAMS ImmNE2 Eosinophilia ImmNE1 & ImmNE2 Blasts Lymphocytosis ImmNE1 = band forms ImmNE2 = immature neutrophils :
- 21. WBC WBC Adults 4-10 x 103/μl Childs till 12 x 103/μl Newborns till 15 x 103/μl
- 22. Lymph. Adults -25-40 % Childs, Newborns- till 70 % MXD - Adults 3-13 % Neutro. - Adults 50-70 %
- 23. Red Blood Cell Count RBC Men 4.6-6.2 x 10⁶/μl Women 4.2-5.4 x 10⁶/μl HGB Men 14-18 g/dl Women 12-16 g/dl HCT Men 43-49 % Women 36-46 %
- 24. MCV- 85-95 fl MCH -27-33 pg MCHC- 32-36 g/dl RDW-SD 37-46 fl (Width in 20% of the Peak hight) RDW-CV 11-16 % (calc. width of the 68 % Peak hight)
- 25. PLATELET PLT 150-400 x 103/μl x 109/l PDW 9-14 fl (Width in 20% of the Peak hight) MPV 8-12 fl P-LCR 15-35 %
- 26. Anemia is not yet apparent MCV still is in the normal range Peripheral Smearshows mild Anisocytosis BUT RDWis increased (Earliest Indicator) Histogramis Unimodal but is wider Increased RDWcombined with normal RBC values (MCV , Hb , Hct ) distinguishes
- 27. Anemia is present, MCV is very low, and the smearis very abnormal RDWis abnormally high; Histogram remains abnormal. The diagnosis is easily made at this point, but earlier identification would improve management
- 28. The red cell count is increasing, MCV is not yet normal, and Two populations of red cells are seen-preexisting microcytes, and newly formed normocytes. Thetwo populations are distinguishedeasilyonthe redcell histogrambut not so easilyontheperipheral bloodsmear.
- 29. EARLY FOLATE DEFICIENCY- • The MCV is still normal RBC count and Hb slightly reduced but • RDW is clearly increased , even before apparent anemia. SEVERE FOLATE DEFICIENCY – • RBC Count is low. • MCV is high. •RDW is increased
- 30. Normocytic recovery a small peakof cells in the normal range • RDWis higherthan untreated megaloblastic anemia due to two cell population contributing to the heterogeneity. Microcytic recovery Two Cell population is clearly seen in this histogram– old macrocytes and newly produced microcytes . Concomitant iron deficiency has been unmasked. RDWis markedly increased..
- 31. Case - 12 yrold boy with purpura, marked pallor, fever •Pancytopenia •MCV 100.5, RDW15.9% •RBC histogram skewed to right •WBC histogram: lymphocyte peak, faint dome of neutrophils •PLT histogram- abn shape,descending slope not touching baseline •BMBx confirmed AA
- 32. Case - WBC LYM% MXD% NEUT% + 23.8 x 10⁹/L 8.1% 7.9% 84.0%
- 34. Case - WBC 7.9 x 10⁹/L LYM% + 64.7% MXD% 15.8% NEUT% – 19.5%
- 36. Case WBC 7.7 x 10⁹/L LYM% F1 * 13.2% MXD% F2 * 37.7% NEUT% 49.1%
- 38. Case WBC 4.3 x 10⁹/L LYM% 18,3% MXD% + 62,2% NEUT% 19.5%
- 39. Case -
- 40. Case WBC 2.3 x 10⁹/L LYM% 39.7% MXD% 32.2% NEUT% 28.1%
- 42. Case -6 RBC 4.48 x10¹²/L HGB 8.8g/dl HCT 29.3% MCV 65.4fl MCH 19.6pg MCHC 30.0g/dl RDW-CV 18.2%
- 47. Anisocytosis
- 49. Poikilocytosis
- 51. Giant platelet
- 52. Although the wide distribution on the PLT histogram suggests the appearance of large platelets, the distribution curve intersects the discrimination line at a high point
- 53. Case WBC LYM% MXD% NEUT % PLT PDW MPV P-LCR 6.0 x10⁹/L 27.5% 7.9% 64.4% 86 x109/L 18.6fl 12.8fl 43.7%
- 55. Platelet Aggregation The smear clearly shows that platelets are aggregating. The WBC histogram shows a peak in the ghost area ( ) , PLT histogram shows a wide distribution. Although these large particles usually affect the leucocyte counts, the leukocytes distribution of case 1 is well separated from the ghost area on the WBC histogram, probably without any effect of small particles in the ghost area. There is no WL Alarm given .
- 57. Cold Agglutinins
- 58. Incubation 30 min RBC HGB HCT MCV MCH MCHC RDW 4.35 x10¹²/L 14.5g/dl 43.5% 100.0fl 33.3pg 33.3g/dl 14.7fl
- 60. Because in this case erythrocytes have passed through the detector as clusters of several cells, the RBC, HCT,MCH, MCV, MCHC and RDW values are abnormal. The RBC histogram shows a second peak. After the clusters have been dissolved by incubation, all erythrocytes aredetected as single cells. Therefore the second peak on the RBC histogram doesnot appear and the RBC, HCT, MCV, MCH, MCHC and RDW values are
- 62. Insufficient Lysing of Erythrocytes
- 63. The histogram show On the WBC histogram the distribution curve intersects the WBC lower discrimination line at an abnormally high point.
- 64. This is frequently seen with blood samples taken from hepatic disease patients or newborns. These problems are solved by diluting the sample or replacing plasma with cellpack. The smear photo shows large platelets and acantocytes, suggesting hepatic diseases
- 66. RL: Abnormal height at lower discriminator of RBC Histogram (LD) RU: Abnormal height at upper discriminator of RBC Histogram (UD) MP: Multiple peaks: Distinguish ?? of two RBC Populations DW:The distribution (RDW) can not be detected because the Histogram does not cross the 20 % limit twice
- 67. WL: Abnormal height at lower discriminator of WBC Histogram (LD) WU: Abnormal height at upper discriminator of WBC Histogram (UD) T1: Valley 1 not found T2: Valley 2 not found F1, F2, F3: Abnormal height at the points T1 or T2; adjacent fractions are marked
- 68. PL: Abnormal height at lower discriminator of PLT Histogram (LD) PU: Abnormal height at upper discriminator of PLT Histogram (UD) MP: Multiple Peaks found DW:The distribution (PDW) can not be detected because the Histogram does not cross the 20 % limit twice
- 69. Mark “ RL “, abnormal height at lower discriminator Possible causes: • Giant Platelets • Micro-Erythrocytes • Platelet Clumps
- 70. Mark “ RU “, abnormal height at the upper discriminator Possible causes: Cold Agglutinins (check MCHC > 40 g/dl) Erythroblasts / Normoblasts
- 71. MP “, multiple peaks found Possible causes: Iron deficiency in therapy Infection or Tumor Anemia (visceral iron deficiency) Transfusions
- 72. “DW “, abnormal histogram distribution Distribution curve does not cross 20% level twice. The overall height of the curve is always 100 %. The width is calculated on the 20 % height of the curve. Hint for extreme Aniso- or. Poikilocytosis
- 73. Thrombocyte-Histogram MPV (mean PLT volume) Ref range: 8 - 12 fl P-LCR (ratio of large platelets) Ref range: 15 - 35 % Increase could be a sign for: • PLT Clumps • Giant PLT • Microerythrocytes
- 74. PDW, (platelet distribution width at 20 % of peak height Ref range: 9 - 14 fl Increase could be a sign for: PLT Clumps Microerythrocytes Fragments
- 75. Mark “ PL “, abnormal height at lower discriminator Possible cause: High blank value Cell fragments
- 76. Mark “ PU “, abnormal height at upper discriminator Possible Cause : • PLT Clumps EDTA-Incombatibility Clotted sample • Giant Platelets • Microerythrocytes
- 77. Mark “ MP “, Multi Peaks found Possible Cause: Platelet transfusion
- 78. Mark “ DW “, Distribution With The distribution can not be detected because the Histogram does not cross the 20 % limit twice. • This curve in only an example but could also show another course. • The overall height of the curve is always 100 %. The width is calculated on the 20 % height of the curve.
- 79. Leukocyte-Histogram Flag “ WL “, Curve does not begin at the basis line Possible causes : • PLT Clumps EDTA- Incombatibility coagulated Sample • high osmotic resistant (Erythrocytes not lysed) • Erythroblasts • cold agglutinate
- 80. RBC Histogram ABN / INDICATOR PROBABLE CAUSE COMMENT Left of curve does not touch baseline Schistocytes and extremely small red cells Review smear CBC and Platelet histogram Bimodal peak Transfused cells, therapeutic response Review Smear Right portion of curve extended Red cell autoagglutination Review CBC & Smear Left shift of curve Microcytes Review smear & CBC Right shift of curve Macrocytes Review smear & CBC
- 81. WBC Histogram ABN / INDICATOR PROBABLE CAUSE COMMENT Trail extending downward at extreme left, or lymph peak not starting at baseline NRBC, Plt clumping, unlysed RBC, cryoproteins, parasites Review smear and correct WBC for NRBC Peak to the left of lymph peak or widening of lymph peak towards left NRBC Review smear & correct WBC for NRBC Widening of lymph peak to right Atypical lymphs, blasts, plasma cells, hairy cells, eosinophilia, basophilia Review smear Wider mono peak Monocytosis, plasma cells, eosinophilia, basophilia, blasts Review smear
- 82. WBC Histogram ABN / INDICATOR PROBABLE CAUSE COMMENT WBC histogram (lymph peak) does not start at baseline Giant platelets, NRBC, Plt clumping Review smear, correct WBC for NRBC Elevation of left portion of granulocyte Left Shift Review smear Elevation of right portion of granulocyte peak Neutrophilia Review smear
- 83. Platelet Histogram ABN / INDICATOR PROBABLE CAUSE COMMENT Peak or spike at left end of histogram (2- 8 fl) Cytoplasmic fragments Review smear Spike towards right end of histogram Schistocytes, microcytes, giant platelets Review smear + CBC ( MCV & RDW) ( MPV & PDW) Bimodal peak Cytoplasmic fragments Review smear
- 84. R1- RBC precursors, Giant or clumped platelets, cryoglobulins. R2- Blast, basophilia, eosinophilia, monocytosis,plasma cells and abnormal size lymphocytes. R3-eosinophilia and immature granulocytes. R4-absolute granulocytosis.
- 85. CONCLUSION Histogram in conjunction with absolute counts give valuable information about the abnormality of the sample & the need for follow up peripheral blood examination.Histogram should be used as quality check but not diagnostic for any pathological condition.The manual blood film remains the definitive tool for complete haematological analysis.
- 86. Take home messages Shapes of histograms identified pathology before the blood smear could be examined. Newer parameter like RDW and PDW have added new dimension to understand blood cells and classify there abnormality. The manual blood film remains the definitive tool for complete haematological analysis.
- 87. Histograms Interpretation LYMPH% 31,2 % MXD% 6,8 % NEUT% 62,0 % LYMPH# 1,8 x10³ /µl MXD# 0,4 x10³ /µl NEUT# 3,6 x10³ /µl 250 RBC RDW-SD 40,0 fl 40 PLT PDW 13,1 fl MPV 10,4 fl P-LCR 28,1 % WBC 300THANYOU SPEAKER- DR NARMADA PRASAD TIWARI
- 88. Known interfering substance RBCs • High WBCs esp if RBCs is low → ↑RBCs • Agglutinated RBCs → ↓ RBCs Hb Turbidity of the blood sample → ↑ Hb • Elevated WBCs • Elevated lipids • Fetal bloods
- 89. MCV Red cell agglutination ↑ number of large platelets HT Red cell agglutination RDW Agglutination of RBCs Nutritional deficiency Blood transfusion
- 90. WBCs interferring subs. Normoblasts → ↑ WBCs Unlysed RBCs → ↑ WBCs MM → ↑ WBCs (ppt protein) Hemolysis → ↑ WBCs (red cell stroma) Leukemia → ↓ WBCs (↑ cell fragility) → In CLL small lymph not counted Cryoglobulin → ↑ all parameters of blood
- 91. Platelets RBCs fragments → ↑ plat (microcytes) WBCs fragments → ↑ plat (microcytes) Chemotherapy → ↓ plat (↑ plat. fragments) Hemolysis → ↑ Plat (red cell strom) ACD blood → ↓ plat (plat. Aggregation) RBCs inclusion → ↑ plat. (Malaria, H.j bodies) Plat. agglutination → ↓ plat
- 92. Lymphocytes Nucleated RBCs → ↑ lymph Parasites → ↑ lymph Resistent RBCs → ↑ lymph Monocytes ↑ in large lymphocytes, atypical lymph, blasts and basophils Granulocytes ↑ in eosinophilia, blasts, promyelo, myelo,
Notes de l'éditeur
- Moderator- DR. SHALIENDRA SINGH THAKUR
- When automation was first introduced, the Coulter principle was the first mechanism to be put into widespread use. The Coulter principle is based on the following: Particles suspended in an isotonic diluent, when drawn through an aperture which has an electric current flowing through it will cause a measurable drop in voltage which is proportional to the size of the particle passing through the aperture. The pulses produced can then be counted and if the flow through the aperture is constant the particles can be quantified per unit volume. This is also called electrical impedance. This is the mechanism employed in most hematology analyzers in one way or another. Most analyzers use a combination of high and low vacuum and pneumatic pressure to push and pull the sample through the analyzer.
- What results is a histogram. This is an example of a NORMAL WBC histogram. The lymphocytes, being the smallest cell fall to the far left of the histogram. The lymphocytes are followed by the Basos, Monos Eos and Neutrophils. Have you ever wondered why basophils, which when you look through the microscope appear to be about the same size as a neutrophil or eo appear between the lymphs and monos?? Well…basophilic granules are water soluble and try as hard as we might to create the “perfect” isotonic solution, you still lose some of the granules when the basophils are put in solution. When this happens, the cell cytoplasm shrinks down around the nucleus and the few remaining granules and makes the cell appear smaller than it is in vivo.
- This is an example of a NORMAL RBC histogram. Most RBCs fall between 80 and 100 fl. The histogram should start at the baseline on the left and a small “tail” may be evident on the right. This represents doublets and triplets (cells that go through the aperture in twos and threes). These are excluded from the RBC MCV by algorithms but may be seen on the histogram.
- These are a variety of examples of abnormal RBC histograms but certainly does not represent all the possibilities. Like the WBC histogram, RBCs do not always follow the “textbook” so some of the things represented here may look different with different specimens.
- This is a NORMAL PLT histogram. The PLT histogram has two curves. One is the curve created from the directly measured PLT count and the other is Coulter’s patented curve fitting process which allows an accurate PLT count without interference from microcytic RBC or RBC fragments.
- Here are a couple of examples of abnormal PLT histograms. One represents the presence of large or giant PLTs. Note how the directly measured curve (blue line) does not come back down to the baseline at 20 fl. The instrument then extrapolates this curve to eliminate any interference but account for the large or giant PLTs still out on the far right hand edge. The other histogram indicates a patient with small PLTs (small MPV). Note there is no need for the curve fitting process in this case as the PLTs all fall withing the directly measured region.
- These are examples of other WBC histograms and the corresponding suspect flag. Keep in mind, these are examples of the most common scenarios and unfortunately, cells do not always follow the “textbook” so occasionally you may see a certain suspect flag and it may not be exactly the same as the examples noted here depending on what is going on with the patient.
- SPEAKER- DR NARMADA PRASAD TIWARI