
Recommandé
Contenu connexe
Similaire à WCPSS Calendar Survey Results
Similaire à WCPSS Calendar Survey Results (16)
Dernier
Dernier (20)
WCPSS Calendar Survey Results
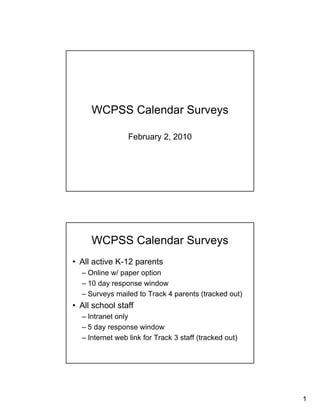
- 1. WCPSS Calendar Surveys February 2, 2010 WCPSS Calendar Surveys • All active K-12 parents – Online w/ paper option – 10 day response window – Surveys mailed to Track 4 parents (tracked out) • All school staff – Intranet only – 5 day response window – Internet web link for Track 3 staff (tracked out) 1
- 2. Parent Survey Results Who responded? Parent Survey Results Who responded? Parents of 39,611 students (28% of district) 2
- 3. Survey Participation by Race/Ethnic Am Ind, 0.3% Asian, 6.7% Black/AA, Am Ind 14.6% Asian Hispanic, 5.7% Black/AA Hispanic Multi, 4.5% White, 68.2% Multi White Race/Ethnic Makeup in WCPSS Am Ind, 0.3% Asian, 6.1% Am Ind Black/AA, Asian 26.1% Black/AA White, 50.9% Hispanic Hispanic, Multi 11.9% White Multi, 4.8% Survey Participants by Calendar Type Modified, 2.1% Modified Traditional, Year Round, Traditional 45.3% 52.6% Year Round Assignment to Calendar Type WCPSS Modified, 2.5% Year Round, 31.5% Modified Traditional Year Round Traditional, 66.1% 3
- 4. Survey Participation by School Level Alternative, High, 12.5% 0.1% Elementary Middle, 22.3% Middle High Elementary, Alternative 65.2% Students by School Level, WCPSS Alternative, 0.3% High, 28.4% Elementary Elementary, Middle 48.8% High Alternative Middle, 22.5% Respondent Characteristics Parent Survey Respondents WCPSS All 39,611 100.0% 141,224 100.0% Modified 825 2.1% 3,489 2.5% Traditional 17,936 45.3% 93,316 66.1% Year Round 20850 52.6% 44,419 31.5% Male 19,746 49.8% 71,923 50.9% Female 19,865 50.2% 69,301 49.1% 4
- 5. Respondent Characteristics Parent Survey Respondents WCPSS All 39,611 100.0% 141,224 100.0% Elementary 25,811 65.2% 68,858 48.8% Middle 8,816 22.3% 31,835 22.5% High 4,960 12.5% 40,094 28.4% Alternative 24 0.1% 437 0.3% Respondent Characteristics Parent Survey Respondents WCPSS All 39,611 100.0% 141,224 100.0% Am. Indian 105 0.3% 390 0.3% Asian 2,640 6.7% 8,591 6.1% Black/Af. Am. 5,789 14.6% 36,882 26.1% Hispanic/Lat. 2,251 5.7% 16,773 11.9% Multi-racial 1,798 4.5% 6,743 4.8% White 27,028 68.2% 71,845 50.9% 5
- 6. Respondent Characteristics Parent Survey Respondents WCPSS All 39,611 100.0% 141,224 100.0% FRL 5,839 14.7% 44,260 31.3% Not FRL 33,772 85.3% 96,964 68.7% LEP 1,796 4.5% 12,608 8.9% Not LEP 37,815 95.5% 128,616 91.1% SWD 3,808 9.6% 17,708 12.5% Not SWD 35,803 90.4% 123,516 87.5% AIG 9,122 23.0% 25,501 18.1% Not AIG 30,489 77.0% 115,723 81.9% Parent Survey Results What did they say? 6
- 7. How satisfied are you with this child's school w/o regard to the calendar? 70.0% 58.8% 60.0% 50.0% 40.0% 35.7% Series1 30.0% 20.0% 10.0% 4.1% 1.1% 0.3% 0.0% Very Satis Satisfied Dissatisfied Very Dissat No response How satisfied are you with your experience so far with the calendar for this school? 70.00% 58.76% 60.00% 50.00% 40.00% 29.99% Series1 30.00% 20.00% 10.00% 6.85% 4.07% 0.33% 0.00% Very Satis Satisfied Dissatisfied Very Dissat No response 7
- 8. How satisfied were you with this child's school assignment at the time he/she was placed at this school? 70.00% 63.72% 60.00% 50.00% 40.00% 26.60% Series1 30.00% 20.00% 10.00% 5.79% 3.26% 0.63% 0.00% Very Satis Satisfied Dissatisfied Very Dissat No response How satisfied were you with this child's school calendar at the time he/she was placed at this school? 70.00% 58.99% 60.00% 50.00% 40.00% 29.58% Series1 30.00% 20.00% 7.03% 10.00% 3.87% 0.54% 0.00% Very Satis Satisfied Dissatisfied Very Dissat No response 8
- 9. Between these two types of calendars, which do you prefer for this child? 60.00% 48.80% 50.00% 44.75% 40.00% 30.00% Series1 20.00% 10.00% 6.17% 0.29% 0.00% Traditional Year Round No Prefer No Response Would you still prefer the type of calendar in Question 6...if convenient transportation could not be guaranteed? 80.00% 67.53% 70.00% 60.00% 50.00% 40.00% Series1 30.00% 18.14% 20.00% 13.61% 10.00% 0.72% 0.00% Yes No Not Sure No Response 9
- 10. Would you still prefer this calendar if this child had a sibling assigned to a different track/school with a different calendar type? 50.00% 46.58% 40.00% 35.44% 30.00% Series1 20.00% 17.20% 10.00% 0.77% 0.00% Yes No Not Sure No Response Would you still prefer this calendar if the nearest school was 0-5 miles from your home? 120.00% 95.75% 100.00% 80.00% 60.00% Series1 40.00% 20.00% 1.67% 2.58% 0.00% Yes No No Response 10
- 11. Would you still prefer this calendar if the nearest school was 6-10 miles from your home? 80.00% 67.89% 70.00% 60.00% 50.00% 40.00% Series1 27.19% 30.00% 20.00% 10.00% 4.93% 0.00% Yes No No Response Would you still prefer this calendar if the nearest school was 10 or more miles from your home? 70.00% 60.00% 57.32% 50.00% 40.00% 36.70% Series1 30.00% 20.00% 10.00% 5.98% 0.00% Yes No No Response 11
- 12. Please rate Y-R Calendar Track 1 according to how acceptable it would be for this child. 35.00% 29.35% 30.00% 26.88% 24.73% 25.00% 20.00% 12.41% Series1 15.00% 10.00% 6.63% 5.00% 0.00% le pt e e e ns bl bl ab e ta ta cc po pt ep p na es ce ce cc U R Ac Ac na y o r y N Ve U r Ve Please rate Y-R Calendar Track 2 according to how acceptable it would be for this child. 40.00% 35.83% 35.00% 30.00% 24.52% 25.00% 19.94% 20.00% Series1 15.00% 11.99% 7.72% 10.00% 5.00% 0.00% le pt e e e ns bl bl ab e ta ta cc po pt ep p na es ce ce cc U R Ac Ac na y o r y N Ve U r Ve 12
- 13. Please rate Y-R Calendar Track 3 according to how acceptable it would be for this child. 35.00% 31.74% 30.00% 26.35% 25.00% 19.89% 20.00% 14.38% 15.00% Series1 7.64% 10.00% 5.00% 0.00% e t e e e ep ns bl bl bl ta ta ta cc po p ep p na es ce ce cc U R Ac Ac na y o r y N Ve U r Ve Please rate Y-R Calendar Track 4 according to how acceptable it would be for this child. 37.82% 40.00% 35.00% 30.00% 27.02% 25.00% 18.52% 20.00% Series1 15.00% 9.76% 6.87% 10.00% 5.00% 0.00% e t e e e ep ns bl bl bl ta ta ta cc po p ep p na es ce ce cc U R Ac Ac na y o r y N Ve U r Ve 13
- 14. Would you still desire a year-round calendar for this child if he/she could not have the track that you wanted? 45.00% 40.18% 40.00% 36.48% 35.00% 30.00% 25.00% 21.88% Series1 20.00% 15.00% 10.00% 5.00% 1.46% 0.00% Yes No DO NOT WANT No Response Assuming that your child were to stay at his/her current school, would you prefer to keep the same calendar or change to another type? 100.00% 80.90% 80.00% 60.00% Series1 40.00% 18.04% 20.00% 1.06% 0.00% Keep Change No Response 14
- 15. If your child's school converted to a calendar different from the one it now has, how likely would you be to try to move your child to another school? 35.00% 29.61% 30.00% 27.87% 25.00% 22.90% 18.83% 20.00% Series1 15.00% 10.00% 5.00% 0.80% 0.00% Very Likely Likely Unlikely Very No Unlikely Response Have you ever tried to move your child to another school specifically to have a year-round calendar? 90.00% 79.09% 80.00% 70.00% 60.00% 50.00% Series1 40.00% 30.00% 20.11% 20.00% 10.00% 0.80% 0.00% Yes No No Response 15
- 16. If your child attended a WCPSS school before high school, what type of calendar did this child experience in elementary school? 70.00% 58.41% 60.00% 50.00% 40.00% Series1 30.00% 16.31% 17.16% 20.00% 10.00% 4.86% 3.45% 0.00% Traditional Year Round Both NA No Response If your child attended a WCPSS school before high school, what type of calendar did this child experience in middle school? 70.00% 60.34% 60.00% 50.00% 40.00% Series1 30.00% 21.25% 20.00% 6.67% 9.19% 10.00% 2.54% 0.00% Traditional Year Round Both NA No Response 16
- 17. If your child attended a year-round WCPSS elementary school before high school, were you satisfied with the experience? 60.00% 56.29% 50.00% 40.00% 32.38% 30.00% Series1 20.00% 8.69% 10.00% 2.64% 0.00% Yes No No YR No Response If your child attended a year-round WCPSS middle school before high school, were you satisfied with the experience? 60.00% 50.12% 50.00% 40.00% 35.75% 30.00% Series1 20.00% 6.67% 7.46% 10.00% 0.00% Yes No No YR No Response 17
- 18. Other Results • Response rates by school • Survey responses by: – Level (elem/ms/high/alt) – Calendar type (trad/mod/yr) – Individual school • Crosstabulations of selected survey items Staff Survey Results Who responded? 18
- 19. Staff Survey Results Who responded? 7377 staff members (46% of district) Which of the following most closely describes your job? Job title N Percent Core Area Teacher 2760 37.57% Special Subject Teacher 1035 14.09% Special Education Teacher 730 9.94% Other Certified Staff 732 9.96% Administrator 204 2.78% Support Staff 1689 22.99% Other 197 2.68% 19
- 20. Staff Survey Results What did they say? Rank the following calendar types in the order of where you would prefer to work. Year- Traditional Round Modified Most Preferred 3486 2788 1055 Somewhat Preferred 1657 1469 3558 Least Preferred 1983 2685 2120 20
- 21. How important is the school calendar type in your decision about where to work? Option N Percent Very important 3605 49.03% Important 2690 36.59% Unimportant 921 12.53% Very unimportant 136 1.85% Would you still prefer your first choice of calendar if you had a child assigned to a different track or a different calendar? Option N Percent YES 3070 42.05% NO 2407 32.97% NOT SURE 1824 24.98% 21
- 22. Would you still prefer your 1st choice of calendar if the nearest school with this calendar was 10 or more miles from home? Option N Percent YES 4609 66.26% NO 2347 33.74% If your first choice is YR, would you still want this calendar if you could not have the track you want? Option N Percent YES 3225 46.66% NO 1019 14.74% DO NOT WANT YR 2668 38.60% 22
- 23. Assuming that you continue to work at your current school, would you prefer that the school keep the same calendar or change to another type? Option N Percent Keep Calendar 5778 78.96% Change Calendar 1540 21.04% If your school converted to a different calendar, how likely would you be to try to get a job at another school? Option N Percent Very Likely 1433 19.62% Likely 1530 20.94% Unlikely 2617 35.82% Very Unlikely 1725 23.61% 23