SlideShare une entreprise Scribd logo
1  sur  9
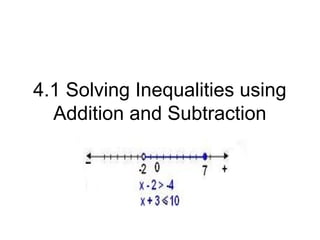
4.1 Solving Inequalities using
  Addition and Subtraction
Vocabulary:
• inequality: a mathematical sentence
  formed by placing an inequality symbol
  between two expressions.
• graph of an inequality: is the set of points
  that represent all solutions of the
  inequality.
• equivalent inequalities: inequalities that
  have the same solution.
Graphing:
• x>1       greater than        open dot

• x<1       less than           open dot

• x ≤1   less than or equal     solid dot

• x ≥ 1 greater than or equal
  solid dot
Example 1:Write and graph an inequality
         that describes the situation
1.)The speed limit on the road is 45 miles
  per hour.


2.) A child must be taller than 40 inches to
  get on Space Mountain.
Example 2     Write inequalities from graphs

Write an inequality represented by the graph.

a.


SOLUTION
The shading includes all numbers to the right of
(greater than) – 6.5.

ANSWER
An inequality represented by the graph is x > – 6.5.
Example 2    Write inequalities from graphs

Write an inequality represented by the graph.

b.


SOLUTION
The shading includes 4 and all numbers to the left of
(less than) 4.

ANSWER
An inequality represented by the graph is x ≤ 4.
Example 3     Solve an inequality using subtraction

Solve 9 ≥ x + 7. Graph your solution.

      9 ≥ x +7             Write original inequality.


                           .
Example 3 continue
Solve the inequality. Graph your solution.
  – 2 < y + 15
Try on your own!!

Solve the inequality. Graph your solution.
7. y + 5 > 6

ANSWER         y >1


8. x + 7 ≥ – 4

ANSWER         x ≥ –11

Contenu connexe

Tendances

Math (Algebra)
Math (Algebra) Math (Algebra)
Math (Algebra)
schwa2aj
 
1.6 solving linear inequalities
1.6 solving linear inequalities1.6 solving linear inequalities
1.6 solving linear inequalities
swartzje
 
February 3, 2015
February 3, 2015February 3, 2015
February 3, 2015
khyps13
 
Percentages
PercentagesPercentages
Percentages
msnancy
 
Chapter3.6
Chapter3.6Chapter3.6
Chapter3.6
nglaze10
 
1.7 linear inequalities
1.7 linear inequalities1.7 linear inequalities
1.7 linear inequalities
hisema01
 
Inequalities 1
Inequalities 1Inequalities 1
Inequalities 1
jsimpson35
 
Interesting Calculation Elephant
Interesting Calculation ElephantInteresting Calculation Elephant
Interesting Calculation Elephant
John Williams
 

Tendances (20)

+2 model ii 2014
+2 model ii 2014+2 model ii 2014
+2 model ii 2014
 
Solving add-subtract equations
Solving add-subtract equationsSolving add-subtract equations
Solving add-subtract equations
 
Math (Algebra)
Math (Algebra) Math (Algebra)
Math (Algebra)
 
1.6 solving linear inequalities
1.6 solving linear inequalities1.6 solving linear inequalities
1.6 solving linear inequalities
 
Solving linear inequalities
Solving linear inequalitiesSolving linear inequalities
Solving linear inequalities
 
February 3, 2015
February 3, 2015February 3, 2015
February 3, 2015
 
Percentages
PercentagesPercentages
Percentages
 
Solving One Step Equations
Solving One Step Equations Solving One Step Equations
Solving One Step Equations
 
exponent properties
 exponent properties exponent properties
exponent properties
 
Remainder theory
Remainder theoryRemainder theory
Remainder theory
 
1 ESO - UNIT 08 - PERCENTAGES. PROPORTIONALITY.
1 ESO - UNIT 08 - PERCENTAGES. PROPORTIONALITY.1 ESO - UNIT 08 - PERCENTAGES. PROPORTIONALITY.
1 ESO - UNIT 08 - PERCENTAGES. PROPORTIONALITY.
 
Chapter3.6
Chapter3.6Chapter3.6
Chapter3.6
 
Lecture 7 (inequalities)
Lecture 7 (inequalities)Lecture 7 (inequalities)
Lecture 7 (inequalities)
 
1.7 linear inequalities
1.7 linear inequalities1.7 linear inequalities
1.7 linear inequalities
 
Inequalities 1
Inequalities 1Inequalities 1
Inequalities 1
 
Linear Inequality
Linear InequalityLinear Inequality
Linear Inequality
 
Interesting Calculation Elephant
Interesting Calculation ElephantInteresting Calculation Elephant
Interesting Calculation Elephant
 
CBSE Class XI Maths Linear inequalities
CBSE Class XI Maths Linear inequalitiesCBSE Class XI Maths Linear inequalities
CBSE Class XI Maths Linear inequalities
 
November 2, 2015
November 2, 2015November 2, 2015
November 2, 2015
 
Solving an-equation-is-like-unwrapping-a-present
Solving an-equation-is-like-unwrapping-a-presentSolving an-equation-is-like-unwrapping-a-present
Solving an-equation-is-like-unwrapping-a-present
 

En vedette

Pyramids (GROUP 2)
Pyramids (GROUP 2)Pyramids (GROUP 2)
Pyramids (GROUP 2)
asita warda
 
Reviewjeopardychapter1
Reviewjeopardychapter1Reviewjeopardychapter1
Reviewjeopardychapter1
nglaze10
 
Chapter2.3
Chapter2.3Chapter2.3
Chapter2.3
nglaze10
 
Chapter4.4
Chapter4.4Chapter4.4
Chapter4.4
nglaze10
 
Sca Financial Planner Benchmark Study 2010
Sca   Financial Planner Benchmark Study 2010Sca   Financial Planner Benchmark Study 2010
Sca Financial Planner Benchmark Study 2010
Jason Pond
 

En vedette (20)

Balloon stampede
Balloon stampedeBalloon stampede
Balloon stampede
 
Cricket World Cup Final 2011
Cricket World Cup Final 2011Cricket World Cup Final 2011
Cricket World Cup Final 2011
 
Social Media ROI
Social Media ROISocial Media ROI
Social Media ROI
 
Licence to Play interactive E-brochure
Licence to Play interactive E-brochureLicence to Play interactive E-brochure
Licence to Play interactive E-brochure
 
Crown tank-co 6-1
Crown tank-co 6-1Crown tank-co 6-1
Crown tank-co 6-1
 
K soft corporate
K soft corporateK soft corporate
K soft corporate
 
Meysemek
MeysemekMeysemek
Meysemek
 
Plan
PlanPlan
Plan
 
Smart Remarketing for Maximum Returns
Smart Remarketing for Maximum ReturnsSmart Remarketing for Maximum Returns
Smart Remarketing for Maximum Returns
 
Pyramids (GROUP 2)
Pyramids (GROUP 2)Pyramids (GROUP 2)
Pyramids (GROUP 2)
 
Internet of Things
Internet of ThingsInternet of Things
Internet of Things
 
Reviewjeopardychapter1
Reviewjeopardychapter1Reviewjeopardychapter1
Reviewjeopardychapter1
 
11.4
11.411.4
11.4
 
AdvisorVault Overview
AdvisorVault OverviewAdvisorVault Overview
AdvisorVault Overview
 
9.2
9.29.2
9.2
 
A Bridge Too Far? Risk Appetite, Governance and Corporate Strategy (Whitepaper)
A Bridge Too Far? Risk Appetite, Governance and Corporate Strategy (Whitepaper)A Bridge Too Far? Risk Appetite, Governance and Corporate Strategy (Whitepaper)
A Bridge Too Far? Risk Appetite, Governance and Corporate Strategy (Whitepaper)
 
Week 6
Week 6Week 6
Week 6
 
Chapter2.3
Chapter2.3Chapter2.3
Chapter2.3
 
Chapter4.4
Chapter4.4Chapter4.4
Chapter4.4
 
Sca Financial Planner Benchmark Study 2010
Sca   Financial Planner Benchmark Study 2010Sca   Financial Planner Benchmark Study 2010
Sca Financial Planner Benchmark Study 2010
 

Similaire à 4.1 notes(8th grade)

November 30, 2015
November 30, 2015November 30, 2015
November 30, 2015
khyps13
 
Graphing inequalities edmodo 10 16-2012
Graphing inequalities edmodo 10 16-2012Graphing inequalities edmodo 10 16-2012
Graphing inequalities edmodo 10 16-2012
shumwayc
 
October 16
October 16October 16
October 16
khyps13
 
Inequalities mathematics grade nine igcse.ppt
Inequalities mathematics grade nine igcse.pptInequalities mathematics grade nine igcse.ppt
Inequalities mathematics grade nine igcse.ppt
MisterTono
 
Tutorial linear equations and linear inequalities
Tutorial linear equations and linear inequalitiesTutorial linear equations and linear inequalities
Tutorial linear equations and linear inequalities
khyps13
 
Solving and Graphing Inequalities.ppt
Solving and Graphing Inequalities.pptSolving and Graphing Inequalities.ppt
Solving and Graphing Inequalities.ppt
SultanTomasII
 
Clark S Final Project
Clark S Final ProjectClark S Final Project
Clark S Final Project
gleen15
 
Solution of linear equation & inequality
Solution of linear equation & inequalitySolution of linear equation & inequality
Solution of linear equation & inequality
florian Manzanilla
 
Math Project 2ppt
Math Project 2pptMath Project 2ppt
Math Project 2ppt
guest7461b8
 
November 6th, 2014
November 6th, 2014November 6th, 2014
November 6th, 2014
khyps13
 

Similaire à 4.1 notes(8th grade) (20)

November 30, 2015
November 30, 2015November 30, 2015
November 30, 2015
 
Graphing inequalities edmodo 10 16-2012
Graphing inequalities edmodo 10 16-2012Graphing inequalities edmodo 10 16-2012
Graphing inequalities edmodo 10 16-2012
 
4.4 notes
4.4 notes4.4 notes
4.4 notes
 
October 16
October 16October 16
October 16
 
Inequalities mathematics grade nine igcse.ppt
Inequalities mathematics grade nine igcse.pptInequalities mathematics grade nine igcse.ppt
Inequalities mathematics grade nine igcse.ppt
 
Quarter 2 Week 1 Math 8 Danao.pptx
Quarter 2 Week 1 Math 8 Danao.pptxQuarter 2 Week 1 Math 8 Danao.pptx
Quarter 2 Week 1 Math 8 Danao.pptx
 
Solving and graphing inequalities lecture
Solving and graphing inequalities lectureSolving and graphing inequalities lecture
Solving and graphing inequalities lecture
 
Solving and graphing inequalities lecture 1
Solving and graphing inequalities lecture 1Solving and graphing inequalities lecture 1
Solving and graphing inequalities lecture 1
 
Tutorial linear equations and linear inequalities
Tutorial linear equations and linear inequalitiesTutorial linear equations and linear inequalities
Tutorial linear equations and linear inequalities
 
Lesson 4 Simple Linear Equations
Lesson 4   Simple Linear EquationsLesson 4   Simple Linear Equations
Lesson 4 Simple Linear Equations
 
Resolver inecuaciones 2009.pdf
Resolver inecuaciones 2009.pdfResolver inecuaciones 2009.pdf
Resolver inecuaciones 2009.pdf
 
Solving and Graphing Inequalities PRESENTATION
Solving and Graphing Inequalities PRESENTATIONSolving and Graphing Inequalities PRESENTATION
Solving and Graphing Inequalities PRESENTATION
 
Solving and Graphing Inequalities.ppt
Solving and Graphing Inequalities.pptSolving and Graphing Inequalities.ppt
Solving and Graphing Inequalities.ppt
 
Clark S Final Project
Clark S Final ProjectClark S Final Project
Clark S Final Project
 
Solution of linear equation & inequality
Solution of linear equation & inequalitySolution of linear equation & inequality
Solution of linear equation & inequality
 
Math Project 2ppt
Math Project 2pptMath Project 2ppt
Math Project 2ppt
 
(7) Lesson 6.3
(7) Lesson 6.3(7) Lesson 6.3
(7) Lesson 6.3
 
(7) Lesson 6.2
(7) Lesson 6.2(7) Lesson 6.2
(7) Lesson 6.2
 
November 6th, 2014
November 6th, 2014November 6th, 2014
November 6th, 2014
 
6-6 Inequalities Add _ Subtract PPT.pptx
6-6 Inequalities Add _ Subtract PPT.pptx6-6 Inequalities Add _ Subtract PPT.pptx
6-6 Inequalities Add _ Subtract PPT.pptx
 

Plus de nglaze10 (20)

add and subtract decimals
add and subtract decimals add and subtract decimals
add and subtract decimals
 
3 3 i can add and subtract decimals
3 3 i can add and subtract decimals 3 3 i can add and subtract decimals
3 3 i can add and subtract decimals
 
Integers day 2 hour 1
Integers day 2 hour 1Integers day 2 hour 1
Integers day 2 hour 1
 
New week 6
New week 6New week 6
New week 6
 
New week 5
New week 5New week 5
New week 5
 
New week 4
New week 4New week 4
New week 4
 
New week 3
New week 3New week 3
New week 3
 
Newweek2
Newweek2Newweek2
Newweek2
 
10.3
10.310.3
10.3
 
New week 1
New week 1New week 1
New week 1
 
New week 10
New week 10New week 10
New week 10
 
New week 9
New week 9New week 9
New week 9
 
11.6
11.611.6
11.6
 
11.5
11.511.5
11.5
 
New week 8
New week 8New week 8
New week 8
 
11.1
11.111.1
11.1
 
New week 6
New week 6New week 6
New week 6
 
9.9
9.99.9
9.9
 
9.8
9.89.8
9.8
 
9.5
9.59.5
9.5
 

4.1 notes(8th grade)

  • 1. 4.1 Solving Inequalities using Addition and Subtraction
  • 2. Vocabulary: • inequality: a mathematical sentence formed by placing an inequality symbol between two expressions. • graph of an inequality: is the set of points that represent all solutions of the inequality. • equivalent inequalities: inequalities that have the same solution.
  • 3. Graphing: • x>1 greater than open dot • x<1 less than open dot • x ≤1 less than or equal solid dot • x ≥ 1 greater than or equal solid dot
  • 4. Example 1:Write and graph an inequality that describes the situation 1.)The speed limit on the road is 45 miles per hour. 2.) A child must be taller than 40 inches to get on Space Mountain.
  • 5. Example 2 Write inequalities from graphs Write an inequality represented by the graph. a. SOLUTION The shading includes all numbers to the right of (greater than) – 6.5. ANSWER An inequality represented by the graph is x > – 6.5.
  • 6. Example 2 Write inequalities from graphs Write an inequality represented by the graph. b. SOLUTION The shading includes 4 and all numbers to the left of (less than) 4. ANSWER An inequality represented by the graph is x ≤ 4.
  • 7. Example 3 Solve an inequality using subtraction Solve 9 ≥ x + 7. Graph your solution. 9 ≥ x +7 Write original inequality. .
  • 8. Example 3 continue Solve the inequality. Graph your solution. – 2 < y + 15
  • 9. Try on your own!! Solve the inequality. Graph your solution. 7. y + 5 > 6 ANSWER y >1 8. x + 7 ≥ – 4 ANSWER x ≥ –11