World quality infographic 2013 - 2014
•
0 j'aime•231 vues

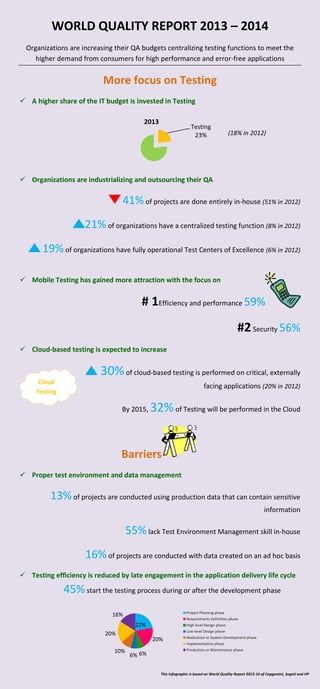
I've made this infographic based on World quality report 2013-2014, published by HP, Capgemini, Sogeti, which reflects the higher focus of organizations placed on Testing.
Recommandé

Recommandé
Contenu connexe
Tendances
Tendances (20)
Similaire à World quality infographic 2013 - 2014
Similaire à World quality infographic 2013 - 2014 (20)
Dernier
Dernier (20)
World quality infographic 2013 - 2014
- 1. WORLD QUALITY REPORT 2013 – 2014 Organizations are increasing their QA budgets centralizing testing functions to meet the higher demand from consumers for high performance and error-free applications More focus on Testing A higher share of the IT budget is invested in Testing 2013 Testing 23% (18% in 2012) Organizations are industrializing and outsourcing their QA 41% of projects are done entirely in-house (51% in 2012) 21% of organizations have a centralized testing function (8% in 2012) 19% of organizations have fully operational Test Centers of Excellence (6% in 2012) Mobile Testing has gained more attraction with the focus on # 1Efficiency and performance 59% #2 Security 56% Cloud-based testing is expected to increase 30% of cloud-based testing is performed on critical, externally Cloud Testing facing applications (20% in 2012) By 2015, 32% of Testing will be performed in the Cloud Barriers Proper test environment and data management 13% of projects are conducted using production data that can contain sensitive information 55% lack Test Environment Management skill in-house 16% of projects are conducted with data created on an ad hoc basis Testing efficiency is reduced by late engagement in the application delivery life cycle 45% start the testing process during or after the development phase Project Planning phase 16% Requirements Definition phase 22% 10% High level Design phase Low level Design phase 20% 20% 6% 6% Realization or System Development phase Implementation phase Production or Maintenance phase This Infographic is based on World Quality Report 2013-14 of Capgemini, Sogeti and HP