SlideShare une entreprise Scribd logo
1  sur  31
Télécharger pour lire hors ligne
Impression management and retrospective sense-making in corporate
                    narratives: A social psychology perspective


    Doris M. Merkl-Davies*, Niamh M. Brennan** and Stuart J. McLeay***
    ∗
        Bangor University; ** University College Dublin; *** University of Sussex.

          (Paper published in Accounting, Auditing and Accountability Journal,
                                 24(3)(2011): 315-344)


Correspondence should be addressed to Doris Merkl-Davies, Bangor Business School, Bangor
University, Bangor, Gwynedd LL57 2DG, Great Britain. Tel.: 0044-(0)1248-382120; d.m.merkl-
davies@bangor.ac.uk


                                                                                             i
Impression management and retrospective sense-making in corporate
                  narratives: A social psychology perspective

Abstract

Purpose – Prior accounting research views impression management predominantly
though the lens of economics. Drawing on social psychology research, we provide a
complementary perspective on corporate annual narrative reporting as characterised
by conditions of ‘ex post accountability’ (Aerts, 2005, p. 497). These give rise to (i)
impression management resulting from the managerial anticipation of the feedback
effects of information and/or to (ii) managerial sense-making by means of the
retrospective framing of organisational outcomes.

Design/methodology/approach – We use a content analysis approach pioneered by
psychology research (Newman et al., 2003) which is based on the psychological
dimension of word use to investigate the chairmen’s statements of 93 UK listed
companies.

Findings – Results suggest that firms do not use chairmen’s statements to create an
impression at variance with an overall reading of the annual report. We find that
negative organisational outcomes prompt managers to engage in retrospective sense-
making, rather than to present a public image of organisational performance
inconsistent with the view internally held by management (self-presentational
dissimulation). Further, managers of large firms use chairmen’s statements to portray
an accurate (i.e., consistent with an overall reading of the annual report), albeit
favourable, image of the firm and of organisational outcomes (i.e., impression
management by means of enhancement).

Research limitations – The content analysis approach adopted in the study analyses
words out of context.

Practical implications – Corporate annual reporting may not only be understood
from a behavioural perspective involving managers responding to objectively
determined stimuli inherent in the accountability framework, but also from a symbolic
interaction perspective which involves managers retrospectively making sense of
organisational outcomes and events.

Originality/value – Our approach allows us to investigate three complementary
scenarios of managerial corporate annual reporting behaviour: (i) self-presentational
dissimulation, (ii) impression management by means of enhancement, and (iii)
retrospective sense-making.

Keywords: Impression management; Retrospective sense-making; Chairmen’s
statements; Social psychology.

Paper type: Research paper


                                                                                     ii
1. INTRODUCTION
Prior research focusing on impression management in a corporate reporting context is
often either explicitly or implicitly based on economics-based theories, particularly
agency theory (Merkl-Davies and Brennan, 2007). Managers are assumed to act
rationally to maximise their utility by exploiting information asymmetries to mislead
investors about financial performance and prospects. This manifests itself in reporting
bias, i.e., the emphasis of positive organisational outcomes and the obfuscation of
negative organisational outcomes in corporate narrative documents. What is more,
managerial behaviour tends to be regarded as only minimally affected by social
relations (Letza et al., 2008). However, we argue that managerial narrative disclosure
decisions are affected by the social constraints arising from the (imagined) presence
of the recipients of corporate reports who use the information in their decision-
making.

Psychological factors thus may provide a richer explanation of managerial impression
management than economic factors. For this reason, we adopt a social psychology
perspective, which complements the narrow concept of economic rationality by
viewing managerial behaviour as subject to social biases arising from the (imagined)
presence of others whose behaviour management is trying to anticipate (Allport,
1954, p. 5). Accounting research can thus benefit from insights from social
psychology which regards impression management as driven by social relations
characterised by an anticipation of an evaluation of conduct (Frink and Ferris, 1998).

Users of corporate narrative documents have been shown to be susceptible to
behavioural effects including a variety of cognitive and social biases. This prevent
them from assessing reporting bias arising from the manipulation of the presentation
and disclosure of information in corporate narrative documents (for example, Baird
and Zelin 2000; Courtis 2004b; Elliott 2006; Frederickson and Miller 2004; Krische
2005).

However, the information communicated in corporate narrative documents impacts
not only on the behaviour of the information recipients, but also on the behaviour of
the information providers in the sense that they anticipate the potential undesirable
consequences of information releases in the form of unfavourable analyst reports,
credit ratings, or news reports (Prakash and Rappaport, 1977). If corporate narrative
documents are regarded as a description of the decision behaviour of the firm’s
management and thus reflect managerial performance (Prakash and Rappaport, 1977,
p. 35), then managers may be prompted to engage in impression management with the
expectation that shareholders and stakeholders may respond in less undesired ways.
Alternatively, the process of anticipating the reactions of information recipients to
managerial disclosures may prompt managers to engage in ‘retrospective sense-
making’ (Aerts, 2005, p. 496) which involves retrospectively framing organisational
outcomes.

1.1 Definition and scope
This paper constitutes an empirical, interdisciplinary study of managerial impression
management focusing on the less researched ‘social’ dimension of corporate narrative
reporting. It is interdisciplinary in the sense that it draws on theoretical insights from
social psychology and uses a content analysis approach developed by social
psychology research to analyse impression management in 93 UK chairmen’s


                                                                                        3
statements of listed firms. We regard impression management as a social bias which
involves “controlling or manipulating the attributions or impressions” (Tedeschi and
Riess, 1981, p. 3) of others with the aim of being perceived favourably
(Hooghiemstra, 2000, p. 60). Further, as the presence of shareholders/stakeholders
impacts on the way managers think, feel and express themselves, corporate narrative
documents contain psychological information which can be extracted by means of
content analysis.

1.2 Importance of studying narrative disclosures
Driven by the realisation that fundamentals only explain a small fraction of share
price movements (Cenesizoglu and Timmermann, 2008), accounting researchers have
increasingly turned to the study of corporate narratives. They are either regarded as a
means of providing incremental useful information to improve decision-making or,
alternatively, as a means of providing biased information to mislead investors (Merkl-
Davies and Brennan, 2007). If they are used opportunistically, this may result in
capital misallocations and unfair wealth transfers from shareholders to managers (for
example, in the form of increased compensation via share options). Impression
management thus constitutes an important corporate governance and regulatory issue.
The seriousness of this issue for both firms and shareholders is demonstrated by
Rogers et al.’s (2009) finding that optimistic tone in earnings announcements is
significantly associated with shareholder litigation. This suggests that corporate
narrative documents may contain reporting bias and that investors are unable to assess
this bias in the short term.

1.3 Motivations, objectives and contribution of the paper
In archival accounting research, psychology theories have been found to be useful to
make predictions and interpret results (Koonce and Mercer, 2005). However, most
prior research does not sufficiently use social psychology theories to provide insights
into managerial impression management. This is particularly paradoxical, considering
that this is the discipline in which impression management research originates. Our
objective is to add richer explanations of impression management motivations and
strategies using insights from psychology research. We also consider the possibility
that the conditions of ‘ex post accountability’ (Aerts, 2005, p. 497) which characterise
corporate annual reporting, may not only give rise to impression management, but
also to the retrospective framing of organisational outcomes.

We introduce a method for uncovering impression management pioneered by
psychology research (Newman et al., 2003). Unlike prior studies, which focus on
specific impression management strategies (see Merkl-Davies and Brennan, 2007),
we focus on the linguistic indicators of the psychological processes involved in
managers submitting to an inquiry by shareholders and stakeholders who evaluate
organisational and managerial performance.

Our results from an empirical application of this method based on a sample of 93 UK
chairmen’s statements of listed companies suggest that firms do not use corporate
annual report documents to portray a public image of organisational performance
inconsistent with the view internally held by management (self-presentational
dissimulation). Rather, corporate narratives are used to portray an accurate (i.e.,
consistent with an overall reading of the annual report), albeit favourable, view of


                                                                                      4
organisational outcomes and to retrospectively provide explanations of organisational
outcomes and events.

Section 2 discusses the theoretical assumptions underlying prior research. Section 3
introduces a social psychology perspective of corporate annual reporting. Section 4
outlines the research questions, hypotheses and the research method. Section 5
discusses the results and Section 6 concludes the paper.

2. THEORETICAL BASIS OF PRIOR RESEARCH
Prior research regards managers as rational, self-interested decision-makers and social
interaction with firm outsiders by means of corporate reporting is regarded solely in
terms of market exchange (Mouck, 1995). Impression management entails managers
opportunistically taking advantage of information asymmetries. Managers use the
discretion inherent in corporate narrative reporting by means of manipulating the
presentation and disclosure of information in order to “distort readers’ perceptions of
corporate achievements” (Godfrey et al., 2003, p. 96). Similar to earnings
management, impression management is viewed as constituting an inconsistency
between the managerial view of organisational performance and the view conveyed
publicly in corporate narrative documents (Healy and Wahlen, 1999, p. 368).
Corporate narrative documents are considered to be potential impression management
vehicles which can be used by managers to present a self-interested view of corporate
performance (Bettman and Weitz, 1983; Staw et al., 1983; Abrahamson and Park,
1994; Beattie and Jones, 2000; Clatworthy and Jones, 2006; Mather et al., 2000).
Impression management involves emphasising positive organisational outcomes
(enhancement) or obfuscating negative organisational outcomes (concealment), for
example, by including (more favourable) pro forma earnings numbers in corporate
narratives or by displaying positive organisational outcomes more prominently than
negative organisational outcomes (e.g., by means of positioning or highlighting). As
negative organisational outcomes give rise to conflicts of interest between managers
and shareholders, managers are assumed to be prompted to manipulate outsiders’
perceptions of and decisions on financial performance and prospects, i.e., to engage in
impression management (Aerts, 2005). Managerial motives may include benefitting
from increased compensation, particularly via managerial stock options (Adelberg,
1979; Rutherford, 2003; Courtis, 2004a).

Some impression management studies are either explicitly or implicitly based on a
social psychology perspective. Impression management is viewed as a self-serving
bias entailing, for example, the attribution of positive organisational outcomes to
internal factors (taking responsibility for good performance) and of negative
organisational outcomes to external circumstances (assigning blame for bad
performance) (Aerts, 1994, 2001; Clatworthy and Jones, 2003). Self-serving bias is
explained by reference to attribution theory (Heider, 1958; Jones and Davis, 1965;
Kelley, 1967) which is concerned with people’s explanations of events. Research
suggests that, in an interactive context, people’s attribution of actions and events is
biased in the sense that they take credit for success and deny responsibility for failure
(Knee and Zuckerman, 1996). Although prior research often acknowledges the social
psychology roots of impression management in the form of performance attributions,
the analysis tends to be carried out within an economics-based framework with
managers acting as rational utility maximising individuals. We argue that self-serving
bias may constitute a social bias resulting from the accountability context inherent in


                                                                                       5
the corporate reporting process. What is more, prior research regards managerial
corporate reporting behaviour as characterised by prospective rationality. This means
that narrative disclosures are regarded as the result of purposeful, goal-directed
behaviour, either aimed at providing useful incremental information or at providing
misleading information (impression management). However, Aerts (2005) argues that
corporate annual reporting may be characterised by retrospective rationality which
involves making sense of actions and events that have already occurred.

3. A SOCIAL PSYCHOLOGY PERSPECTIVE OF CORPORATE ANNUAL
REPORTING
The social psychology literature regards impression management as consisting of two
different processes, namely impression motivation and impression construction
(Leary and Kowalski, 1990). Impression motivation is concerned with the
circumstances which motivate individuals to engage in impression management.
Impression construction entails “choosing the kind of impression to create” and
“deciding how [to] go about doing so” (Leary and Kowalski, 1990, pp. 35-36).

We first discuss the social factors impacting on impression motivation which we
regard as embedded in, and dependent on, social relations. As impression
management involves “the process by which people attempt to control the
impressions others form of them” (Leary and Kowalski, 1990, p. 34), it is social in
character. This means that the social ‘presence’ of others is an essential part of
impression management. Thus, the determinants of impression management
behaviour may be located externally in the social context, as well as internally within
managers. As impression management in a corporate reporting context occurs in the
(imagined) presence of outside parties, we regard it to be determined by the
accountability relationship between management and financial and non-financial
stakeholders.1

We then focus on impression construction which involves constructing public images
that are either (i) a reflection of one’s self-image or (ii) images which are inconsistent
with one’s self-concept (Leary and Kowalski, 1990, p. 40). The former entails
managers using corporate annual documents to present an accurate (i.e., consistent
with an overall reading of the annual report), but favourable view of organisational
outcomes, whereas the latter entails “presenting images that are…not accurate”
(Leary et al., 1994, p. 461). This is referred to as self-presentational dissimulation
(Leary and Kowalski, 1990, p. 40). In a corporate annual reporting context, it entails
the managerial construction of public images of managerial actions and events that are
inconsistent with the way management may view these actions and events. We
introduce a new content analysis approach pioneered by psychology research which
focuses on the linguistic indicators of the psychological processes underlying
involved in self-presentational dissimulation.

3.1 Accountability, impression motivation, and retrospective sense-making
Schlenker et al. (1994, p. 634) defines accountability as “the condition of being
answerable to audiences for performing up to certain standards, thereby fulfilling

1
  This implies a wide concept of accountability which views firms as reacting to the concerns of all
external parties (Stanton and Stanton, 2002).


                                                                                                  6
responsibilities, duties, expectations, and other charges”. On the one hand,
accountability entails the obligation of one party to provide explanations and
justifications for its conduct to another party. On the other hand, it involves the first
party’s behaviour being subject to the scrutiny, judgment and sanctioning of the
second party.

According to Schlenker (1997), accountability involves three components which
affect judgement and decision-making in different ways, namely (1) the inquiry
component, (2) the accounting component, and (3) the verdict component. The
inquiry component entails anticipating or submitting to an inquiry by an audience who
evaluates one’s actions and decisions in relation to specific prescriptions. The
accounting component involves presenting one’s version of events. This gives the
individual the opportunity to describe, document, interpret, and explain relevant
information with the purpose of constructing a personal account of events and
providing reasons for their occurrence. The verdict component entails the audience
delivering a verdict. This comprises both a judgment of the individual and the
application of either social and material rewards or sanctions. Thus, the experience or
anticipation of an evaluative appraisal is crucial to the concept of accountability.

Frink and Ferris (1998), who apply the concept of accountability in organisational
research, establish the link between accountability and impression management. They
argue that, in an accountability context, individuals engage in impression management
in anticipation of an evaluation of their conduct. Impression management thus
constitutes a way of influencing the impressions and decisions of relevant parties in
order to win rewards and avoid sanctions. Thus, conditions of accountability foster
impression management.

Managerial behaviour in the corporate reporting process can also be analysed in the
context of an accountability framework. Managers are accountable to outside parties
for their decisions and actions, with the annual report serving as an accountability
mechanism to react to the concerns of external parties (Stanton and Stanton, 2002, p.
492). Thus, impression management can be conceptualised as arising from the inquiry
component of corporate reporting with managers engaging in impression management
in anticipation of an evaluation of their actions and decisions (primarily) by
shareholders. Managers are assumed to engage in impression management to
counteract undesirable consequences of information releases.2 Figure 1 illustrates the
role of corporate narrative reporting in the accountability process.


2
  These take the form of unfavourable analyst reports and credit ratings, and ultimately, negative share
price movements on the one hand; and loss of stakeholder support and social legitimacy on the other
hand. As corporate reporting takes place in a social context, it is influenced by social norms and rules.
This requires a shift to substantive rationality which is concerned with ideals, goals and ends which are
pursued for their own sake, such as equality, justice, and freedom (Weber, 1968). Substantive
rationality addresses mainly social and environmental issues, such as fair trade, equality in the
workplace, and pollution. Substantive rationality is a rationality of ends which involves applying
appropriate reason to achieve these ends. Thus, impression management is regarded as a managerial
attempt to gain or restore social legitimacy by aligning the company’s norms and values with those of
society by decoupling or symbolic management. In this case, impression management constitutes an
inconsistency between the firm’s actual and professed norms and values.


                                                                                                       7
Figure 1: Role of corporate narrative reporting in the accountability process

                                                         3 Delivery of
                                                       judgement/verdict
                                                  e.g. Buying / selling shares
                                                  Restoring social legitimacy


                     Individual                                                                  Jury
                                                  2 Accounting: presenting                  (Shareholders
                   (Management)                    one’s version of events                  & Stakeholders)


                                                   Impression management /
                                                  Retrospective sense making


                                                    Anticipation of inquiry
                                                  (information inductance)
                Key:
                       Represents the direction of influence (i.e. either from management to shareholders or
                       from shareholders to management).
                ___ Represents the direction of influence conceptualised in the mainstream view of the
                       corporate reporting process, i.e. the interaction between firm insiders and outsiders by
                       means of market exchange.
                ------ Represents the unobservable psychological processes underlying impression management
                       resulting from the (imaged) presence of (primarily) shareholders, the recipients of the
                       annual report.


The process of anticipating the reactions of information recipients to managerial
disclosures is referred to as ‘information inductance’ (Prakash and Rappaport 1977).
Impression management can thus be regarded as resulting from the behavioural
impact of information on managers who aim to control the feedback effects of
reported information by means of altering it before it is released. Alternatively, Aerts
(2005) argues that the accountability context of corporate annual reporting prompts
managers to engage in retrospective sense-making. This concept originates in Weick’s
(1995) work on organisational sense-making and refers to the interpretation of events
that have already occurred. Managers may thus use corporate annual report
documents to proactively shape shareholders’ and stakeholders’ perceptions of
organisational outcomes and events (impression management) and/or to
retrospectively provide an account of events (retrospective sense-making).
Retrospective sense-making is contrary to the goal-seeking perspective of economic
rationality which is generally assumed to drive managerial behaviour and thus
corporate narrative reporting. The conditions of ‘ex post’ accountability in corporate
annual reporting, which is characterised by managers anticipating readers’ reactions,
may give rise to impression management and/or retrospective sense-making.
Impression management may take the form of presenting an inaccurate view of
organisational outcomes (self-presentational dissimulation) and/or an accurate, but
favourable, view of organisational outcomes (enhancement). Whereas self-
presentational dissimulation entails “creat[ing] an impression at variance with an
overall reading of the [annual] report” (Stanton et al., 2004, p. 57), impression
management by means of enhancement involves creating an impression consistent
with an overall reading of the annual report. Figure 2 illustrates the impact of
accountability on managerial corporate annual reporting behaviour as impression
management and/or retrospective sense-making.


                                                                                                                  8
Figure 2: The impact of accountability on managerial corporate annual reporting behaviour


                                                                         Accountability


                                      (i) Impression                                               (ii) (c) Retrospective
                                       management                                                      sense-making


       Constructing an inaccurate               Constructing an accurate, but
      impression of organisational                favourable, impression of
                outcomes                           organisational outcomes
       (at variance with an overall              (consistent with an overall
      reading of the annual report)             reading of the annual report)


         (a) self-presentational                           (b) Enhancement
                 dissimulation                           (emphasis of positive
        (obfuscation of negative                       organisational outcomes)
          organisational outcomes)


 3.2 Impression construction, self-presentational dissimulation and the
psychological dimension of word use
We assume that the concerns of information providers about the consequences of the
information recipients’ actions will manifest themselves verbally. We focus on the
linguistic indicators of the psychological processes underlying the construction of
images which are inconsistent with one’s self-concept. Previous studies have focused
on specific impression management strategies adopted to obfuscate negative
organisational outcomes, thereby constructing an impression of organisational
outcomes at variance with an overall reading of the annual report, in particular
reading ease manipulation and rhetorical manipulation (Merkl-Davies and Brennan,
2007).

Social psychology is a discipline that uses scientific methods “to understand and
explain how the thoughts, feelings and behaviours of individuals are influenced by the
actual, imagined or implied presence of other human beings” (Allport, 1954, p. 5).
The underlying assumption is that unobservable processes, such as thoughts, feelings,
and beliefs are the psychological dimension of social behaviour and that these can be
inferred from behaviour. Behaviour includes actions and non-verbal behaviour, such
as body language, facial expressions, gestures, and language.

The method of analysis chosen is based on the assumption that the way people
express themselves conveys psychological information (Pennebaker et al., 2003).
Language is viewed as a psychological marker which can be analysed by counting the
occurrence of specific words and word categories which capture the way content is
expressed (Newman et al., 2003). It involves word counts of grammatical features,


                                                                                                                            9
such as personal pronouns (e.g., I, my, mine) and conjunctions (e.g., and, but,
although) or psychologically derived linguistic dimensions, such as emotion words
(e.g., wonderful, exciting) or achievement-related words (e.g., try, goal, win). Word
count strategies “are based on the assumption that the words people use convey
psychological information over and above their literal meaning and independent of
their semantic context” (Pennebaker et al., 2003, p. 550).

Pennebaker et al., (2003) observe that three classes of word categories are implicated
in deception (what we call self-presentational dissimulation) – pronoun use, emotion
words and markers of cognitive complexity (e.g., exclusive words). Newman et al.,
(2003) find a relatively consistent linguistic profile for deception, based on five word
categories: (1) first person singular pronouns (liars avoid statements of ownership,
disassociate themselves from the text), (2) third person pronouns, (3) negative
emotion words (arising from discomfort and guilt associated with lying), (4) exclusive
words (associated with cognitive complexity) and (5) motion verbs (negatively
associated with cognitive complexity) (liars tell less complex stories). Verbosity, i.e.,
the amount of words used, is also found to be a predictor of deception (lying is
associated with less detail, thus resulting in shorter communication) (DePaulo et al.,
2003; Burgoon et al., 2003; Vrij at al., 2000).

Following this research, we employ a content analysis approach which is based on the
linguistic indicators of self-presentational dissimulation in the form of six word
categories, namely (1) word count, (2) first person pronouns, (3) third person
pronouns, (4) positive emotion words, (5) negative emotion words, and (6) words
relating to underlying complex cognitive processes (Burgoon et al., 1996; 2003;
Newman et al., 2003; Pennebaker et al., 2003). These convey psychological
information on the underlying emotional state of individuals engaged in constructing
public images which are inconsistent with their self-concept. They “are the result of
anxiety, negative emotional states, and cognitive demand” (Carlson et al., 2004, p. 7)
which go hand-in-hand with conveying “messages and information knowingly
transmitted to create a false impression or conclusion” (Burgoon and Nunamaker,
2004, p. 1). The intention is to construct an instrument measuring the verbal
manifestations of managerial concern about the impact of narrative disclosures on
information recipients’ actions.

However, psychology research based on word use shows the content categories used
to analyse self-presentational dissimulation to be indicative of a variety of other
psychological processes and behaviour, including gender, and physical and emotional
health (Campbell and Pennebaker, 2003). What is more, pronouns and adjectives
(with both positive and negative connotations) are amongst the most commonly used
textual elements in content analysis (Macnamara, 2003, p. 17) to analyse a variety of
phenomena, including impression management. Baker and Kare (1992), Kohut and
Segars (1992), Rutherford (2003), Clatworthy and Jones (2006), and Li (2008) use
document length as a proxy for reading difficulty. Abrahamson and Park (1994),
Abrahamson and Amir (1996), Smith and Taffler (2000), Lang and Lundholm (2000),
Clatworthy and Jones (2003), Rutherford (2005), Henry (2006, 2008), Matsumoto et
al. (2006), and Davis et al. (2008) use positive and negative keywords as a proxy for
the enhancement of positive organisational outcomes (managerial optimism and
pessimism).


                                                                                      10
We therefore argue that the content categories used as proxies for self-presentational
dissimulation can also be interpreted as indicators of managerial enhancement of
positive organisational outcomes or managerial retrospective sense-making.
Bloomfield (2008) puts forward a similar argument in his discussion of Li’s (2008)
paper on impression management in the form of reading ease manipulation. He states
that word and sentence length and document length may be interpreted as indicators
of the complexity of the news to be described, rather than obfuscation by means of
reading difficulty, with negative financial performance requiring more complex and
detailed explanations than positive financial performance.

4. HYPOTHESES, DATA AND METHOD
This section discusses the research questions, the research method, including sample
selection, data sources used, measurement of the independent variables, and the
statistical methods applied in analysing the data.

4.1 Hypotheses
The use of impression management in a corporate reporting context has been found to
be causally linked to various firm characteristics, including organisational outcomes,
firm size, and industry sector classification. Research in social psychology suggests
that the strength of organisational actors’ motivations to engage in impression
management depends on (1) the goal-relevance of the impressions (including the
maximisation of social and material outcomes, the maintenance and enhancement of
self-esteem, and identity creation) (2) the value of the desired outcomes, and (3) the
discrepancy between one’s desired and current social image (Leary and Kowalski,
1990). Negative organisational outcomes can thus be regarded as a trigger for
organisational actors to engage in impression management. We expect firms with
negative organisational outcomes to be more likely to present a public image of
organisational performance which is inconsistent with the managerial view of
organisational performance than firms with positive organisational outcomes.
Therefore, we expect self-presentational dissimulation to be directly associated with
negative organisational outcomes.

H1a: Firms reporting negative organisational outcomes in their financial statements
     are more likely to engage in self-presentational dissimulation than firms
     reporting positive organisational outcomes.

However, managers may use corporate annual report documents to present an
accurate (i.e., consistent with an overall reading of the annual report), but favourable,
view of organisational outcomes (enhancement of positive organisational outcomes).
Thus, we expect managers to emphasise positive organisational outcomes, regardless
of their financial performance. We express this hypothesis in the null form.

H1b: There is no difference in impression management by means of enhancement of
     positive organisational outcomes between firms reporting positive
     organisational outcomes and firms reporting negative organisational outcomes
     in their financial statements.

What is more, the accountability context of corporate annual reporting may prompt
managers to engage in retrospective sense-making manifesting itself in “ex post
explanations or restatements of organizational outcomes and events” (Aerts, 2005, p.


                                                                                      11
497). Under conditions of ex post accountability, we thus expect an increase of
retrospective sense-making in the case of negative organisational outcomes.

H1c: Firms reporting negative organisational outcomes in their financial statements
     are more likely to engage in retrospective sense-making than firms reporting
     positive organisational outcomes.

The goal relevance of impressions also depends on the publicity of the individual’s
behaviour and on the individual’s dependency on others for valued outcomes.
Publicity is “a function of both the probability that one’s behavior will be observed by
others and the number of others who might see or learn about it” (Leary and
Kowalski, 1990, p. 38). If an individual depends on others for valued outcomes, the
impressions that individuals make on others become more important and the
individual’s motivation to engage in impression management becomes stronger. As
large firms are more in the public eye than small firms in the sense that they have a
higher analyst following and a wider media exposure, they may be more likely to
present a public image of organisational outcomes inconsistent with the managerial
view of organisational outcomes. Conversely, large firms are subject to greater
scrutiny and are therefore more likely to be found out and sanctioned for engaging in
self-presentational dissimulation and impression management (Abrahamson and Park,
1994). Therefore, we do not make any predictions concerning the direction of
association with firm size.

H2a: There is no difference in self-presentational dissimulation between firms of
     different sizes.
H2b: There is no difference in impression management by enhancement between
     firms of different sizes.
H2c: There is no difference in the sense-making activities of managers between firms
     of different sizes.

We further assume that there is no difference in the impression management
behaviour and the sense-making behaviour of firms belonging to different industries.

H3a: There is no difference in self-presentational dissimulation between firms in
     different industries.
H3b: There is no difference in impression management by enhancement between
     firms in different industries.
H3c: There is no difference in the sense-making activities of managers between firms
     in different industries.

4.2 Population and sample
The population from which the sample is selected comprises all UK domiciled
companies listed on the London Stock Exchange on 30 April 2004 (1,983 companies).
The aim of sample selection is to derive a sample comprising a variety of industries
and firm sizes. The companies were first grouped into sectors, based on the Dow
Jones Market Sector classifications. In order to generate a large enough sample, the
three sectors with the highest number of companies were selected for analysis
(Financial Services companies are excluded due to their unique features). The three
resulting sectors are Consumer Cyclical (CYC; n = 360), Technology (TEC; n = 193),


                                                                                     12
and Industrial (IDU; n = 331).3 An initial sample of 93 firms was then selected
comprising 31 companies from each of the three industries. The initial sample size of
93 was chosen as sufficiently large to permit statistical testing. These were selected
using systematic sampling to ensure heterogeneity of firm sizes. For this purpose, the
companies in each industry sector were ranked according to size (end of year market
capitalisation 2002 in £million) and sample companies were chosen at regular
sampling intervals throughout the size ranges. The sampling interval is the ratio N/n,
i.e., where N represents the population and n the desired sample size (i.e., 31) in each
industry sector. The full selection process is documented in Table 1.


    Table 1: Sample selection


                                                  Consumer      Technology       Industrial        Total
                                                   No. firms      No. firms       No. firms    No. firms
    Total population in sector                           360            193             331          884
    Eliminations
    Market capitalisation not available/large            (18)             (5)           (8)          (31)
    change in market capitalisation
    Missing values                                        (5)            (17)          (11)          (33)
    Non-calendar years                                    (3)              (7)           (7)         (17)
    Total final population in sector                     334              164           305           803

    Sample selected                                       31               31            31            93


The sample size of 93 firms is small. Other than Li (2008), most prior papers in this
field have small sample sizes, due to the labour-intensive process of collecting,
preparing and analysing textual data.

4.3 Data sources and textual analysis software
The annual report chairman’s statement is a tried and tested medium for the
investigation of impression management in narrative corporate report sections (Jones,
1988; Smith and Taffler, 1992a, 1992b, 1995, 2000; Clatworthy and Jones, 2001,
2006; Sydserff and Weetman, 2002; Courtis, 1998, 2004a). Its relatively short length
makes it particularly suitable for content analysis.

The chairmen’s statements were obtained by downloading the 2002 annual reports in
pdf format. These would have been the first annual reports post-Enron when financial
reporting and the quality of accounting information were the subject of considerable
public attention worldwide. After deleting photographs and their captions, images,
charts, graphs, tables, forms of address (Dear shareholder), and greeting (Yours
faithfully), the chairmen’s statements were converted into computer readable text
format.


3
  The industry classification Consumer Cyclical includes firms operating in the subsectors of
advertising, entertainment and leisure, publishing, clothing and fabrics, etc.; Industrial includes firms
operating in the subsectors of building materials, pollution control/waste management, electrical
components and equipment, etc.; Technology includes firms operating in the subsectors of aerospace
and defence, computers, office equipment, etc.


                                                                                                     13
We use Linguistic Inquiry and Word Count (LIWC), an automated text analysis
program developed by psychologists for the purpose of analysing linguistic style, to
measure self-presentational dissimulation. Its external validity has been extensively
tested (Pennebaker and Francis, 1996). The program analyses written samples of text
on a word-by-word basis and calculates the number of words that match pre-defined
word categories which are then hierarchically subdivided into 70–80 dimensions
(depending on the version of the software used) (see Pennebaker et al., 2007 for full
details of how the software operates).4 This program has been used in numerous
studies to examine linguistic manifestations of psychological processes and
behaviour, such as personality characteristics of US presidential candidates (Slatcher
et al., 2007), demographic differences, such as age and gender (Pennebaker and
Stone, 2003), emotional issues, such as bereavement and depression (Gill and
Oberlander, 2003; Pennebaker and King, 1999), and self-presentational dissimulation
(Newman et al., 2003; Burgoon et al., 2003; Hancock et al., 2008).

4.4 Measurement of dependent variables
Measurement of the three dependent variables in this research is presented below.

4.4.1 Self-presentational dissimulation
We adapt a content analysis approach based on the linguistic style associated with
self-presentational dissimulation developed by Newman et al. (2003). Research in
psychology finds the texts of individuals who engage in deception to show the
following linguistic characteristics: (1) They are shorter (DePaulo et al., 2003;
Burgoon et al., 2003; Vrij et al., 2000), (2) they contain fewer self-references
(Newman et al., 2003), (3) they contain fewer references to others (Newman et al.,
2003), (4) they contain more positive emotion words (Newman et al., 2003; Burgoon
et al., 2003; Zhou et al., 2004), (5) they contain more negative emotion words
(Newman et al., 2003; DePaulo et al., 2003), and (6) they contain fewer words
indicative of cognitive complexity (Newman et al., 2003). Deception goes hand-in-
hand with providing less detail in the account of events. As the use of self-references
in the form of first-person is a “subtle proclamation of one’s ownership of a
statement” (Newman et al., 2003, p. 666), individuals engaged in deception avoid the
use of self-references as a way of distancing themselves from their stories and to
avoid taking responsibility for their behaviour. The increased use of emotion words is
a reflection of the discomfort experienced when engaging in deception (Newman et
al., 2003, p. 666). Finally, deception consumes cognitive resources which results in
less complex stories (Newman et al., 2003, p. 666). This manifests itself, amongst
others, in a less complex sentence structure, less causation words (e.g., because,
cause, effect), and fewer words expressing the ability to think, learn and understand
(e.g., think, know, consider).

This is the first study applying Newman et al.’s (2003) content analysis approach in a
corporate reporting context. Gupta and Skillicorn (2006, p. 2), who use the approach
to analyse a large corpus of Enron email messages, find that “the model captures …
messages in which there seems to be a dichotomy between the overt meaning of the
email and the mindset of the sender”. They conclude that it captures ‘spin’, i.e., “the
attempt by authors to convey something they themselves do not (quite) believe”.

4
  For example, the word ‘optimistic’, falls into five of the 70-80 dimensions, namely ‘optimism’,
‘positive emotion’, ‘overall affect,’ ‘words longer than six letters’ and ‘adjective’.


                                                                                              14
Newman et al.’s (2003) content analysis approach is based on the behaviour of
individuals, whereas the content of corporate narrative documents is the result of
decision behaviour of a group of people, primarily the firm’s management (Clarke
and Murray, 2000). The assumption that the behaviour of individuals and groups of
individuals is the same is open to question.

For the six linguistic indicators of self-presentational dissimulation we make use of
four dimensions from LIWC, (1) Word count (LIWC: log word count5), (2) positive
emotion words (LIWC: positive emotion), (3) negative emotion words (LIWC:
negative emotion), and (4) cognitive complexity (LIWC: cognitive processes). We
then create custom dictionaries for the two remaining linguistic indicators, namely (5)
self-reference (this custom dictionary contains three word categories - first person
plural pronouns (i.e., we, us, our, ours, ourselves), the Group, and the respective
company name), and (6) reference to others (this custom dictionary contains four
words – industry, sector, competitor, and rival).6 Following Newman et al., (2003)
and Slatcher et al., (2007) the measures for each indicator are subsequently converted
to z scores. A z score is a standardised measure which is derived by considering the
distance in terms of standard deviation from the mean of the raw score. The individual
z scores are summed using the following algorithm:
Self-presentational dissimulation = – zWord Count – zSelf-reference – zReference to
others + zPositive Emotion + zNegative Emotion – zCognitive Complexity.7

We assume that the higher the score, the more likely it is that a company is portraying
a public image of organisational outcomes which is inconsistent with the managerial
view of organisational outcomes. Table 2 outlines the six linguistic indicators of self-
presentational dissimulation for chairmen’s statements, their abbreviation, examples
of their application in practice, data sources and measurement.


5
  Because of the skewness in the number of words across firms and some extreme values we use the
natural logarithm, rather than the raw word count.
6
  It is not meaningful to combine the output for all six indicators of self-presentational dissimulation
into a single score because first of all, they are on different scales, i.e., the Word Count measure is an
absolute measure and the remaining variables are percentage measures. What is more, their direction of
association is not in the same direction.
7
  Z-scores for each linguistic indicator are calculated by subtracting the sample mean (µx) from each
value (x) and then dividing by the standard deviation (σx), i.e. zx = (x - µx)/ σx.


                                                                                                      15
Table 2: Linguistic indicators of self-presentational dissimulation in chairmen’s statements


   Linguistic indicator                             Examples                      Data source         Measurement


   1. Word count                                    ----                          LIWC                log of total word
                                                                                                      count in text
   2. References to self                            1st person plural: we, us,    Custom dictionary   % of total word
                                                    our, ours, ourselves; the                         count in text
                                                    Group; name of the
                                                    company
   3. References to others                          Industry, sector,             Custom dictionary   % of total word
                                                    competitor(s), rival(s)                           count in text
   4. Positive emotion words                        Exciting, win                 LIWC: Positive      % of total word
                                                                                  emotion             count in text
   5. Negative emotion words                        Difficult, disappointing,     LIWC: Negative      % of total word
                                                    loss                          emotion             count in text
   6. Markers of cognitive                          Cognitive processes           LIWC: Cognitive     % of total word
   complexity                                                                     processes           count in text

   Note: LIWC: Linguistic Inquiry and Word Count, the content analysis program used in this study


           Table 3 provides the descriptive statistics for the six linguistic indicators and the
           summary z score for self-presentational dissimulation for our sample of UK
           chairmen’s statements. Its shows marked differences in mean values between positive
           emotion words (3.314%) and negative emotion words (0.857%). This suggests that,
           on average, chairman’s statements tend to contain four times as many positive
           emotion words (e.g., exciting, win) than negative emotion words (e.g., difficult,
           disappointing, loss). This has been referred to as the ‘Pollyanna effect’ (Hildebrandt
           and Snyder, 1981). However, only association tests can ascertain whether this
           prevalence to ‘enhance the story’ (Courtis, 2004a, p. 293) occurs regardless of
           financial performance.


Table 3: Descriptive statistics of linguistic indicators of self-presentational dissimulation


Variable                                     N      Mean      Median     StDev    Minimum Maximum              Q1         Q3
1. Word count (absolute total number)       93         823       806      1.876         161   3,801            530      1,278
1. Word count (natural log total words)     93       6.713     6.692      0.629       5.081   8.243          6.273      7.153
2. References to self (%)                   93       3.692     3.800      1.460       0.600   7.770          2.785      4.775
3. References to self others (%)            93       0.240     0.190      0.256       0.000   1.460          0.000      0.355
4. Positive emotion words (%)               93       3.314     3.340      1.117       1.060   7.720          2.480      3.985
5. Negative Emotion words (%)               93       0.857     0.730      0.572       0.000   3.180          0.460      1.125
6. Markers of Cognitive Complexity (%)      93       3.430     3.390      0.891       0.000   5.760          2.960      3.850
Self-presentational dissimulation z score   93      -0.002     1.541      2.668      -6.726   7.905         -1.565      1.485
Key: % = % of total word count in text


           4.4.2 Impression management by means of enhancement
           If managers use corporate narratives to provide useful incremental information, then
           positive organisational outcomes should be associated with the use of positive key


                                                                                                             16
words and negative organisational outcomes with the use of negative key words
(Abrahamson and Amir, 1996; Henry, 2006; Davis et al., 2008). However, if
managers use corporate annual report documents to enhance positive organisational
outcomes, then we expect to see no difference in the use of positive key words
between firms reporting positive organisational outcomes and firms reporting
negative organisational outcomes (Smith and Taffler, 2000; Rutherford, 2005). We
use the LIWC content categories of positive and negative emotion words which
capture words with positive and negative connotations.8

4.4.3 Retrospective sense-making
Sense-making is assumed to manifest itself in an increase in cognitive complexity and
document length. Bloomfield (2008) uses document length as a proxy for cognitive
complexity. We use both document length (word count) and the LIWC content
category ‘cognitive processes’ which is characterised by causation and insight words
(e.g., because, think, know).

The linguistic indicators used as proxies for self-presentational dissimulation,
impression management by means of enhancement, and retrospective sense-making
(dependent variables), and their expected direction of association with organisational
outcomes, are summarised in Table 4.


    Table 4: Dependent variable measures and predicted association with organisational outcomes


                                 Self-presentational   Impression management          Retrospective
                                   dissimulation           (enhancement)              sense-making
                                  (H1a, H2a, H3a)         (H1b, H2b, H3b)            (H1c, H2c, H3c)

    Association with negative
    organisational outcomes

    Linguistic indicator
    1. Word count                         -                 Not applicable                 +
    2. Self-reference                     -                 Not applicable           Not applicable
    3. Reference to others                -                 Not applicable           Not applicable
    4. Positive emotion words             +                 No difference            Not applicable
    5. Negative emotion words             +                       +                  Not applicable
    6. Cognitive complexity               -                 Not applicable                 +


4.5 Data for independent variables
Three independent variables are tested in this research: financial performance in terms
of organisational outcomes, firm size, and industry classification. The database
Thomson One Banker-Analytics is used to download all the financial variables from
1999 to 2002, including data for the financial performance variables (i.e., total assets,
total sales, income before taxation and interest, the firm size variable (i.e., end of year
market-capitalisation) and the Dow Jones industry classification.


8
 Alternatively, if managers use corporate annual report documents to obfuscate negative organisational
outcomes, then we expect to see no difference in the use of negative key words between firms reporting
positive organisational outcomes and firms reporting negative organisational outcomes.


                                                                                                   17
4.5.1 Organisational outcomes
Four different measures that distinguish positive and negative organisational
outcomes reported in the financial statements are used. Prior research predominantly
focuses on firm-specific and transitory aspects of financial performance, most
commonly positive/negative percentage change in earnings (Courtis, 1998;
Subramanian et al., 1993). In this study, two measures based on assets and sales
which capture more permanent aspects of financial performance in relation to the
firm’s competitive environment are also used.

Prior impression management research has used three categories of financial
performance measures, namely (1) accounting measures that are predominantly
percentage change in net income (Adelberg, 1979; Courtis, 1995, 1998, 2004a; Jones,
1988; Sydserff and Weetman, 2002; Rutherford, 2003; Li, 2008), (2) market-based
measures (Cassar, 2001), and (3) bankruptcy/survival measures (Smith and Taffler,
1992a, b). Following Subramanian et al. (1993), Courtis (2004a) and Smith and
Taffler (1992a, b), we treat financial performance as a dichotomous variable, i.e.,
either positive or negative organisational outcomes. We base these dummy variables
on four accounting measures which reflect different types of organisational outcomes.
These are summarised in Table 5.

Profit or Loss indicates whether the firm’s income (before interest and taxation) is
either positive or negative, taking the value of zero if an absolute net loss is reported
and a value of one otherwise. In this context, it is generally assumed that managers
normally seek to avoid reporting a loss (Hayn, 1995). Research in earnings
management has provided substantial evidence concerning such benchmark beating in
firms. In this study it is assumed that managers engage in self-presentational
dissimulation and retrospective sense-making when expectations cannot be achieved.

Earnings Increase or Decrease indicates whether the change in earnings between the
two years in question (2001 and 2002) is either positive or negative. In this case,
managers are assumed to seek to report results that improve upon last year’s
performance (Burgstahler and Dichev, 1997; Degeorge et al., 1999). The variable
takes a value of zero if there is a decrease in earnings, and a value of one otherwise.

Annual earnings may be influenced by a number of non-contemporaneous factors.
These would include corrections to past valuations and the prudent recognition of
current value-increasing activities whose income effect is deferred until its eventual
certain realisation in future periods. Therefore, we also consider a broader accounting-
based indicator of performance that provides a global measure of current activities,
i.e., sales. Revenue is a key measure of a firm’s economic activity. In prior research,
firm performance has been operationalised as sales growth rate relative to its industry
(Powell, 1996; Covey et al., 2006). Investment analysts use revenue to proxy the
entity’s current level of economic activity relative to past levels, and with its
competitors as part of their assessment of the firm’s financial performance. In this
context, it is assumed that negative sales growth and lower sales growth than the
firm’s competitors represent missed targets. Sales growth rate is reflected in the
dummy variable Relative Sales Increase or Decrease, which is an indicator of either
positive or negative growth in the total sales of a firm from 2001 to 2002, relative to
the rate of change in output in the overall industry. The variable takes a value of zero
if the percentage change in Sales is below the industry average, and one otherwise.


                                                                                      18
Finally, Relative Firm Growth captures the longer-term growth of a firm relative to its
industry by averaging the growth in both sales and total assets over a four year period
(1999-2003) and then adjusting for the industry mean. This is also treated as a 0,1
indicator, in this case taking the value of zero if firm growth is below the industry
average and one otherwise.


  Table 5: Measurement of organisational outcomes


  Proxy measure            Definition                                              Prior research
  (1) Profit / Loss        1 EBIT ≥ 0 in Year 1;                                   Subramanian et al. (1993)
                           0 EBIT < 0 in Year 1                                    Courtis (2004a)
                                                                                   Li (2008)
  (2) Earnings Increase    1   Positive change in EBIT Year 0 to Year 1            Subramanian et al. (1993)
     / Decrease            0   Negative change in EBIT Year 0 to Year 1            Courtis (2004a)

  (3) Relative Sales       1   Positive sales growth relative to industry from Year Powell (1996)
     Increase / Decrease       0 to Year 1                                          Covey et al. (2006)
                           0   Negative sales growth relative to industry from
                               Year 0 to Year 1

  (4) Relative Firm        1  Positive long-term growth averaged over sales and Current study
     Growth                   assets and compared to industry, four years from
                              Year -2 to Year +1
                         0 Negative long-term growth averaged over sales and
                              assets and compared to industry, four years from
                              Year -2 to Year +1
  Key: EBIT - Earnings Before Interest and Tax


Table 6 shows the number of companies in the sample reporting positive and negative
organisational outcomes across the four proxy outcomes measures. It can be seen that
there is an approximate 3:2 split between the two groups across all four measures.


  Table 6: Categorisation of sample firms by organisational outcome


                                       Positive organisational Negative organisational       Total
                                              outcome                 outcome
                                              No. firms               No. firms            No. firms
  (1) Profit or Loss                              52                     41                   93
  (2) Earnings Increase/Decrease                  55                     38                   93
  (3) Relative Sales Increase/Decrease            57                     36                   93
  (4) Relative Firm Growth                        59                     34                   93


4.5.2 Firm size
Table 7 shows the descriptive statistics of firm size, measured as the natural logarithm
of market capitalisation in 2002, for the whole sample. The market values themselves
range from £0.164m to £6,124m with median value of £43.38m.


                                                                                                 19
Table 7: Descriptive statistics of firm size


   Variable                 N         Mean        Median   StDev.     Min         Max        Q1        Q3
   Size (£m)                93       45.833       43.380    8.491    0.164   6,124.179   11.302   223.632
   LogSize                  93        3.825        3.770    2.139   -1.810       8.720    2.425     5.410

   Size by industry (£m)
   Consumer                 31       85.541       58.557    8.593   1.259    6124.179    13.874   601.845
   Technology               31       16.827       22.874    6.639   0.164     749.945     5.641    47.942
   Industrial               31       66.954       94.632    7.838   1.221    3261.688     7.614   242.257


4.5.3 Industry
Impression management may be affected by the industry in which the company
operates (Aerts, 2005). In order to control for variability in the three dependent
variables across industries, the sample was divided into three broad industry sectors
based on the Dow Jones Market Sector classifications (Consumer Cyclical,
Technology, and Industrial).

4.6 Statistical analysis
We use ordinary linear regressions to examine the relationship between the three
dependent variables and firm characteristics. The specification of the model is as
follows:

(a) Self-presentational
dissimulation
(b) Impression          = β0 + β1 (positive/negative organisational outcomes dummy)
management                + β2 (Firm size) + β3 (Industry sector dummies) + u1
(c) Retrospective         (unexplained residual)
sense-making

5. RESULTS
We test the three hypotheses set out earlier on the relationship between (a) self-
presentational dissimulation (i.e., the summary z-score), (b) impression management
by means of enhancement, and (c) retrospective sense-making and (i) organisational
outcomes, (ii) firm size, and (iii) industry. Table 8 presents the results of regressing
the summary z-score on the four different measures of financial performance (Table 8,
column 1). In all the regressions firm size and industry classification are included as
control variables. Our findings do not support hypothesis H1a which predicts that
firms reporting negative organisational outcomes engage self-presentational
dissimulation which entails constructing a public image of managerial actions and
events that is inconsistent with the way management views these actions and events.
However, we find that the chairmen’s statement of firms operating in the Industrial
sector use significantly less self-presentational dissimulation (for the four
organisational measures the coefficients are respectively: -2.34**; -2.50**; -2.64***;
-0.19) than firms operating in the Consumer Cyclical and the Technology sector, a
finding that we cannot currently explain.


                                                                                           20
In order to investigate the complementary hypotheses regarding managerial corporate
annual reporting behaviour (in the form of impression management by means of
enhancement and in the form of retrospective sense-making), we also regress each
linguistic indicator on the four measures of financial performance separately (Table 8,
columns 2-7).9 We find that firms which report negative organisational outcomes use
significantly less positive emotion words (for the four organisational measures the
coefficients are respectively: 2.69***; 2.89***; 0.68; 0.13) and significantly more
negative emotion words (coefficients -2.79***; -2.99***; -3.26***; -4.55***) than
firms which report positive organisational outcomes. This suggests that managers do
not use corporate narrative annual report sections to present an inaccurate (i.e., at
variance with an overall reading of the annual report) view of organisational
outcomes, but rather to explain or reinforce “the impression created elsewhere by raw
figures” (Courtis, 1995, p. 14).10 This finding supports hypothesis H1b which predicts
no difference between impression management by means of enhancement between
firms reporting positive and negative organisational outcomes.

Further, the chairmen’s statements of firms reporting negative organisational
outcomes are characterised by more linguistic indicators of cognitive complexity than
those of firms reporting positive organisational outcomes (coefficients -3.51***; -
0.61; -2.10**; -3.13***). This suggests that explaining losses and negative sales
growth and negative firm growth compared to competitors requires more cognitive
resources. This manifests itself semantically in more causation words and
grammatically in a more complex sentence structure than explaining profits, and
positive sales growth and positive firm growth compared to competitors. This finding
supports the retrospective sense-making hypothesis H1c.

This suggests that in an annual reporting context characterised by “ex post
accountability” (Aerts, 2005, p. 497), “overall financial performance [can] be
conceived as a primary content variable around which (and not necessarily about
which) a number of different accounting (and non-accounting) stories [can] be built”
(ibid, p. 496). Thus, corporate annual report documents may not be the outcome of
proactive, purposeful, and goal directed managerial decision-making (prospective
rationality), but rather the result of retrospective sense-making (retrospective
rationality) characterised by managers making “interpretive readings of an
organisational situation” (Boland, 1993, p. 125) under conditions of accountability.
This manifests itself in “ex post explanations or restatements of organizational
outcomes and events” (Aerts, 2005, p. 497).

In contrast to Bloomfield (2008), we find positive financial performance (in the form
of sales increase and positive firm growth relative to sector average) to result in an
increase in document length (measured as word count) (coefficients 2.92***; 2.04**).
This suggests that firms which outperform their competitors in terms of sales and
asset growth provide longer corporate narrative annual report documents than firms
whose sales and assets growth is worse than the sector. Bloomfield (2008) regards

9
   We also run the same regressions using the individual z-scores for the six linguistic indicators. The
results are not reported, but are of a similar magnitude and statistical significance to those of the un-
standardised linguistic indicators reported in Table 8 (columns 2-7).
10
   It also refutes the ‘Pollyanna effect’ (Hildebrandt and Snyder, 1981, p. 6) which suggests that
managers introduce positive bias into corporate narrative documents, irrespective of financial
performance.


                                                                                                     21
descriptions of negative financial performance to be more complex and thus lead to an
increase in document length. However, our results suggest the opposite, namely that
managers have the tendency to enhance positive organisational outcomes by
describing them in more detail than negative organisational outcomes. This finding
contradicts the retrospective sense-making hypothesis H1c and supports the impression
management by enhancement hypothesis H1b.

Further, firms operating in the technology sector (coefficients 2.36**; 2.47**; 2.36**;
2.79***) and the industrial sector (coefficients 3.87***; 4.15***; 4.15***; 4.23***)
also provide more cognitively complex chairmen’s statements than firms operating in
the consumer cyclical sector. This may be an indication of the greater complexity of
the subject matter compared with firms operating in the consumer cyclical sector.
Thus, hypothesis H3c is not supported, with evidence of significant differences in use
of the linguistic cognitive complexity indicator by industry sector.

Further, we find the chairmen’s statements of large firms to contain more self-
references (coefficients 4.13***; 4.26***; 4.18***; 4.13***), more positive emotion
words (coefficients 1.35; 2.16**; 2.37**; 2.45**) and less negative emotion words
(coefficients -1.40; -2.24**; -2.12**; -1.98**) than those of small firms. This suggests
that large firms may have a greater tendency to use their corporate annual report
documents as impression management vehicles by putting the best part of themselves
into public view (Leary and Kowalski, 1990, p. 40) than small firms. Thus, our
findings support hypothesis H2b. The increased use of the company name and the first
person plural, combined with the tendency to use rather more words with positive
than negative connotations, suggests that large firms may use their chairmen’s
statements more for brand-building than small firms.

In summary, our results suggest that firms do not use chairmen’s statements to create
an impression at variance with an overall reading of the annual report (self-
presentational dissimulation). We find that large firms are more likely to portray an
accurate (i.e., consistent with an overall reading of the annual report), albeit
favourable image of organisational outcomes. Further, we find that negative
organisational outcomes do not prompt managers to engage in self-presentational
dissimulation, but rather to engage in retrospective sense-making by means of
“drawing together a series of events in order that they make sense in relation to one
another” (Crossley, 2000, p. 535). This manifests itself linguistically in the form of a
more complex grammatical sentence structure and more causation and insight words
(e.g., because, think, know).


                                                                                     22
Table 8: Association between self-presentational dissimulation, impression management, and retrospective sense-
making and organisational outcomes (H1), firm size (H2) and industry sector (H3)
                          (a) Self-
Dependent              presentational       (b) Impression management (enhancement)                         (c) Retrospective
variables              dissimulation                                                                          sense-making
Dependent variable             z-score        Self-   Reference       Positive Negative                       Word     Cognitive
measures                                 reference      to others     emotion  Emotion                        count complexity
Hypotheses tested (H1a, H2a, H3a)                         (H1b, H2b, H3b)                                    (H1c, H2c, H3c)
Positive / negative organisational outcomes = Profit or loss (1,0)
Organisational                    1.03       -0.13          -1.06     ***2.69  ***-2.79                        1.48       ***-3.51
outcomes
Firm size                       *-1.95    ***4.13           -0.36         1.35     -1.40                      0.39            1.39
Sector: Constant               **2.04     ***5.48        ***3.63      ***9.24   ***7.28                   ***35.14        ***13.43
  Technology (+/-)               -1.04        0.24          -0.01      *-0.73       0.68                     -0.53          **2.36
   Industrial (+/-)           **-2.34       **2.23           0.92        -0.68      0.90                     -0.06         ***3.87
Adj. R2                          0.050       0.164        -0.002        0.138     0.139                     -0.002           0.239

Positive / negative organisational outcomes = Earnings Increase or Decrease (1,0)
Organisational                   0.11        0.97         -1.58     ***2.89       ***-2.99                     0.86             -0.61
outcomes
Firm size                      *-1.67     ***4.26         -0.59      **2.16        **-2.24                     0.91           0.10
Sector: Constant              **2.13      ***5.02      ***3.83      ***8.65        ***7.49                ***33.84        ***11.78
  Technology (+/-)              -1.12        0.27          0.03       *-1.89          0.83                    -0.63         **2.47
   Industrial (+/-)          **-2.50       **2.28          1.10        -1.09          1.34                    -0.27        ***4.15
Adj. R2                         0.039       0.173        0.014         0.148         0.149                 -0.0186           0.136

Positive / negative organisational outcomes = Sales Increase or Decrease Relative to Sector Average (1,0)
Organisational               **-1.98         1.30          0.65          0.68     ***-3.26       ***2.92                      **-2.10
outcomes
Firm size                       -1.33     ***4.18         -0.94       **2.37      ***-2.12           0.55                     0.39
Sector: Constant             ***2.86      ***4.84       ***3.05      ***8.81       ***7.65      ***34.19                  ***12.44
  Technology (+/-)              -1.30        0.35          0.12       *-1.82           0.65         -0.44                   **2.36
   Industrial (+/-)         ***-2.64         2.34          1.10         -1.00          1.19         -0.15                  ***4.15
Adj. R2                       0.0793        0.180        -0.010        0.072          0.163        0.064                    0.1739

Positive / negative organisational outcomes = Firm Growth (4 years) Relative to Sector Average (1,0)
Organisational                **2.04         1.58        -0.61          0.13      ***-4.55        **2.04                  ***-3.13
outcomes
Firm size                        0.67     ***4.13        -0.71       **2.45        **-1.98           0.67                     0.60
Sector: Constant           ***33.96       ***4.84     ***3.49       ***9.04        ***8.38     ***33.96                   ***13.15
  Technology (+/-)              -0.78        0.15         0.11        *-1.88           1.23        -0.78                   ***2.79
   Industrial (+/-)             -0.19        2.37         1.05         -1.03           1.20        -0.19                   ***4.23
Adj. R2                        0.019        0.187      -0.010          0.067         0.241         0.019                     0.219

Note: This table shows the regression results of (a) self-presentational dissimulation on financial performance (column 1)
and (b) the six linguistic indicators of self-presentational dissimulation on financial performance (columns 2-7).
Self-presentational dissimulation = – zWord Count – zSelf-reference – zReference to others + zPositive Emotion +
zNegative Emotion – zCognitive Complexity.
Z-scores for each indicator are calculated by subtracting the sample mean (µx) from each value (x) and then dividing by
the standard deviation (σx), i.e. zx = (x - µx)/ σx.
Positive / negative organisational outcomes is a 0-1 dummy variable, defined as indicated in italics above each set of
estimations. Firm size is the natural log of market value. The Consumer Cyclical sector is the reference category for the
sector effects.

***   Coefficient or test significant at the 1% level; ** Significant at the 5% level; * Significant at the 10% level.


                                                                                                                         23
6. SUMMARY AND CONCLUSION
In this study we argue that the economic view of impression management is
reductionist in the sense that it treats managerial corporate annual reporting behaviour
as characterised exclusively by prospective rationality and driven by utility
maximisation. As corporate reporting takes place in a social context, accounting
research may benefit from the use of social psychology theories. We conceptualise
impression management as a social bias caused by managers anticipating an inquiry
by shareholders and stakeholders who evaluate their actions and decisions. This
causes managers to counteract undesirable consequences of information releases by
engaging in impression management. We employ a content analysis approach
pioneered by psychology research which focuses on the linguistic indicators of the
psychological processes underlying self-presentational dissimulation to analyse 93
UK chairmen’s statements of listed firms. Our results suggest that the accountability
function of corporate reporting does not prompt managers to provide a public account
of organisational outcomes which is inconsistent with how management may perceive
them (self-presentational dissimulation), but to provide explanations of their decisions
and actions as a way of making sense of them. This is in line with Aerts (2005) who
finds that the accountability function of corporate annual reporting causes managers
to engage in retrospective sense-making. Further, results suggest that impression
construction in corporate annual report documents entails presenting an accurate (i.e.,
consistent with an overall reading of the annual report), albeit favourable view of the
firm and financial performance.

6.1 Strengths and limitations of the paper
This paper introduces a social psychology perspective to corporate annual reporting
and impression management. We use psychology theories and apply a content
analysis approach developed by psychology research for measuring deception. The
content analysis method uses findings based on the behaviour of individuals
(Newman et al., 2003). The assumption that the behaviour of individuals and groups
of people, such as the firm’s management team, which tends to author corporate
narrative reports (Clarke and Murray, 2000), is the same is open to question. Like any
other quantitative content analysis approaches, the method used in this study
combines the advantages of automatic generation of content scores, namely ease of
application, objectivity, reliability, and speed, with psychological validity. However,
the downside of this approach is that words are analysed regardless of their context.

6.2 Implications of the research
The results suggest that corporate reporting is a more complex and multi-dimensional
process than acknowledged by the prior literature. Corporate narrative documents
may not only serve a vehicle for transmitting (biased) information and/or as a means
of forging relationships with shareholders and stakeholders, but also to provide an
account of organisational outcomes as a result of managerial actions and events. This
confirms Gibbins et al. (1990, p. 130) findings that different disclosure positions, i.e.,
“the shared meanings and understandings of the role of disclosure among managers
in a particular firm’ co-exist for different kinds of disclosures within the same firm.
Thus, corporate annual reporting may not only be understood from a behavioural
perspective involving managers responding to objectively determined stimuli inherent
in the accountability framework, but also from a symbolic interaction perspective
which involves managers retrospectively making sense of organisational outcomes


                                                                                       24
and events. These positions are based on different views regarding the ontological
nature of human behaviour and actions (Johnson et al., 2006) as either purposive or as
interpretive. If the ontological status of human behaviour is regarded as purposive,
then corporate reporting functions as “a technical device for coping with an objective
world, rationally fostering efficiency, order and stability” (Covaleski et al., 1985, p.
278). Alternatively, if the ontological status of human behaviour is regarded as
interpretive, then corporate reporting constitutes a symbolic activity during which
managers engage in social reality creation and “in so doing, … give meaning to their
ongoing stream of experience” (Boland and Pondy, 1983, p. 223).

The sense-making aspect in corporate communication may be further investigating by
comparing the way managerial actions, organisational outcomes, and events are
portrayed in more immediate communication vehicles, such as corporate press
releases, takeover documents, and prospectuses, and in corporate narrative documents
which serve an accountability function, such as corporate annual report documents.

6.3 Concluding comment
Accounting researchers tend to view corporate report documents primarily though the
lens of economics. This leads to a reductionist view of corporate reporting and
impression management as characterised by prospective rationality and driven by
utility maximisation. This paper provides a social psychology perspective which puts
the accountability context of corporate reporting at the centre of analysis. Conditions
of ex post accountability may result in impression motivation arising from the
managerial anticipation of the feedback effects of information and/or give rise to the
retrospective framing of organisational outcomes. Our findings suggest that
impression construction does not involve a disparity between managerial views of
organisational performance and the view portrayed publicly in corporate reports (self-
presentational dissimulation). Rather, impression construction entails presenting an
accurate (i.e., consistent with an overall reading of the annual report), albeit
favourable, view of the firm. Further, corporate annual report sections may not be
primarily used to shape outsiders’ perceptions of organisational outcomes, but rather,
to construct an account of organisational outcomes. In this respect, corporate
narratives, like conventional narratives, such as stories as myths, may serve to
“organise our experience and our memory of human happenings” (Bruner, 1991, p.
4).


                                                                                     25
References
Abrahamson, E. and Amir, E. (1996), “The information content of the president’s
    letter to shareholders”, Journal of Business Finance and Accounting, Vol. 23 No.
    8, pp. 1157-1182.
Abrahamson, E. and Park, C. (1994), “Concealment of negative organizational
     outcomes: an agency theory perspective”, Academy of Management Journal,
     Vol. 37 No.5, pp. 1302-1334.
Adelberg, A.H. (1979), “Narrative disclosures contained in financial reports: means of
     communication or manipulation’, Accounting and Business Research, Vol. 10
     (Summer), pp. 179-189.
Aerts, W. (1994), “On the use of accounting logic as an explanatory category in
     narrative accounting disclosures”, Accounting, Organizations and Society, Vol.
     19 No. 4/5, pp. 337-353.
Aerts, W. (2001), “Inertia in the attributional content of annual accounting
     narratives”, The European Accounting Review, Vol. 10 No. 1, pp. 3-32.
Aerts, W. (2005), “Picking up the pieces: impression management in the retrospective
     attributional framing of accounting outcomes”, Accounting, Organizations and
     Society, Vol. 30, pp. 493-517.
Allport, G.W. (1954). The historical background of social psychology. In G. Lindzey,
     and E. Aronson, (Eds.), Handbook of Social Psychology, Vol. 1 No. 3, pp. 1-46.
Baird, J.E. and Zelin, R.C. (2000), “The effects of information ordering on investor
      perceptions: An experiment utilizing presidents’ letters”, Journal of Financial
      and Strategic Decisions, Vol. 13 No. 3, pp. 71-81.
Baker, H.E. and Kare, D.D. (1992), “Relationship between annual report readability
    and corporate financial performance”, Management Research News, Vol. 15 No.
    1, pp. 1-4.
Beattie, V. and Jones, M. (2000), “Impression management: the case of inter-country
     financial graphs”, Journal of International Accounting, Auditing and Taxation,
     Vol. 9 No.2 (June), pp.159-183.
Bettman, J. and Weitz, B. (1983), “Attributions in the boardroom: causal reasoning in
     corporate annual reports”, Administrative Science Quarterly, Vol. 28, pp. 165-
     183.
Bloomfield, R. (2008), “Discussion of ‘Annual report readability, current earnings,
     and earnings persistence’”, Journal of Accounting and Economics, Vol. 45 Nos.
     2-3, pp. 248-252.
Boland, R.J. (1993), “Accounting and the interpretive act”, Accounting,
     Organizations and Society, Vol. 18 No. 2/3, pp. 125-146.
Boland, R.J., and Pondy, L.R. (1983), “Accounting in organizations: a union of
     natural and rational perspectives,” Accounting Organizations and Society, Vol. 8
     No. 2/3, pp. 223–234.
Bruner, J. (1991), “The narrative construction of reality”, Critical Inquiry, Vol. 18,
     pp. 1-21.
Burgoon, J.K., Buller, D.B., Floyd, K., and Grandpre, J. (1996), “Deceptive realities:
     sender, receiver, and observer perspectives in deceptive conversations”,
     Communication Research, Vol. 23, pp. 724-748.
Burgoon, J.K., Bliar, J.P., Qin, T., Nunamaker, J.F. (2003), “Detecting deception
     through linguistic analysis”, Intelligence and Security Informatics, No. 2665 in
     Lecturer Notes in Computer Science, pp. 91-101.


                                                                                   26
Burgoon, J.K. and Nunamaker, J.F. Jr., eds. (2004), “Toward computer-aided support
     for the detection of deception”, Group Decision and Negotiation, Vol. 13, pp. 1-
     4.
Burgstahler, D. and Dichev, I. (1997), “Earnings management to avoid earnings
     decreases and losses”, Journal of Accounting and Economics, Vol. 24, pp. 99-
     126.
Campbell, R.S. and Pennebaker, J.W. (2003), “The secret life of pronouns: flexibility
     in writing style and physical health”, Psychological Science, Vol. 14, pp. 60-65.
Carlson, J.R., George, J.F., Burgoon, J.K., Adkins, M. and White, C.H. (2004),
     “Deception in computer-mediated communication”, Group Decisions and
     Negotiation, Vol. 13, pp. 5-28.
Cassar, G. (2001), “Self-serving behaviour and the voluntary disclosure of capital
     market performance”, Accounting Research Journal, Vol.14 No.2, pp. 126-137.
Cenesizoglu, T. and Timmermann, A.G. (2008), “Is the distribution of stock returns
     predictable?” Available at SSRN: http://ssrn.com/abstract=1107185.
Clarke, G. and Murray, L.W. (2000), “Investor relations: perceptions of the annual
     statement”, Corporate Communications: An International Journal, Vol. 5 No. 3,
     pp. 144-151.
Clatworthy, M. and Jones, M.J. (2001), “The effect of thematic structure on the
     variability of annual report readability”, Accounting, Auditing and Accountability
     Journal, Vol. 14 No. 3, pp. 311-326.
Clatworthy, M. and Jones, M.J. (2003), “Financial reporting of good news and bad
     news: evidence from accounting narratives”, Accounting and Business Research,
     Vol. 33 No. 3, pp. 171-185.
Clatworthy, M. and Jones, M.J. (2006), “Differential patterns of textual characteristics
     and company performance in the chairman’s statement”, Accounting, Auditing,
     and Accountability Journal, Vol. 19 No. 4, pp. 493-511.
Courtis, J.K. (1995), “Readability of annual reports: Western versus Asian evidence”,
     Accounting, Auditing and Accountability Journal, Vol. 8 No. 2, pp. 4-17.
Courtis, J.K. (1998), “Annual report readability variability: tests of the obfuscation
     hypothesis”, Accounting, Auditing and Accountability Journal, Vol. 11 No. 4,
     pp. 459-471.
Courtis, J.K. (2004a), “Corporate report obfuscation: artefact or phenomenon?”,
     British Accounting Review, Vol. 36 No. 3, pp. 291-312.
Courtis, J.K. (2004b), “Colour as visual rhetoric in financial reporting”, Accounting
      Forum, Vol. 28 No. 3, pp. 265-281.
Covaleski, M.A., Dirsmith, M.W. and Jablonski, S. F. (1985), “Traditional and
  emergent theories of budgeting: An empirical analysis,” Journal of Accounting and
  Public Policy, Vol. 4 No. 4, pp. 277-300.
Covey, J.G., Green, K.M. and Slevin, D.P. (2006), “Strategic process effects on the
     entrepreneurial orientation-sales growth rate relationship”, Entrepreneurship
     Theory & Practice, Vol. 30 No 1, pp. 57-81.
Crossley, M.L. (2000), “Narrative psychology, trauma and the study of self/identity”,
     Theory Psychology. Vol. 10, pp. 527-546.
Davis, A.K., Piger, J.M. and Sedor, L.M. (2008), “Beyond the numbers: An analysis
    of optimistic and pessimistic language in earnings press releases”, Working
    paper, April 2008, Available at Social Science Research Network (SSRN),
    http://ssrn.com/abstract=875399.
Degeorge, F., Patel, J., Zeckhauser, R. (1999), “Earnings management to exceed
     thresholds”, Journal of Business, Vol. 72 No. 1, pp. 1-33.


                                                                                     27
DePaulo, B.M., Lindsay, J.J., Malone, B.E., Muhlenbruck, L., Charleton, K. and
     Cooper, H. (2003), “Cues to deception”, Psychological Bulletin, Vol. 129, pp.
     74-112.
Elliott, W.B. (2006), “Are investors influenced by pro forma emphasis and
      reconciliations in earnings announcements?”, The Accounting Review, Vol. 81
      No. 1, pp. 113-133.
Frederickson, J.R. and G.S. Miller (2004), “The effects of pro forma earnings
      disclosures on analysts’ and nonprofessional investors’ equity valuation
      judgments”, The Accounting Review, Vol. 79 No. 3, pp. 667-686.
Frink, D.D. and Ferris, G.R. (1998), “Accountability, impression management, and
     goal setting in the performance evaluation process”, Human Relations, Vol. 51
     No. 10, pp. 1259-1283.
Gibbins, M., Richardson, A. and Waterhouse, J. (1990), “The management of
     corporate financial disclosure: opportunism, ritualism, policies and processes”,
     Journal of Accounting Research, Vol. 28 No. 11, pp. 121-143.
Gill, A. and Oberlander, J. (2003), “Perception of email personality at zero
     acquaintance: extraversion takes care of itself; Neuroticism is a worry”,
     Proceedings of the 25th Annual Conference of the Cognitive Science Society,
     Hillsdale, New Jersey, LEA, pp. 363-368.
Godfrey, J., Mather, P. and Ramsay, A. (2003), “Earnings and impression
     management in financial reports: the case of CEO changes”, Abacus, Vol. 39 No.
     1, pp. 95-123.
Gupta, S. and Skillicorn, D.B. (2006), “Improving a textual deception detection
     model”, Proceedings of the 2006 conference of the Center for Advanced Studies
     on Collaborative Research, http://portal.acm.org/citation.cfm?id=1189005.
Hancock, J.T., Curry, L.E., Goorha, S. and Woodworth, M. (2008), “On lying and
     being lied to: a linguistic analysis of deception in computer-mediated
     communication, Discourse Processes, Vol. 45 No 1, pp. 1-23.
Hayn, C. (1995), “The information content of losses”, Journal of Accounting and
     Economics, Vol. 20, pp. 125-153.
Healy, P.M. and Wahlen, J.M. (1999). ‘A review of the earnings management
  literature and its implications for standard setting’. Accounting Horizons, 13(4):
  365-383.
Heider, F. (1958), The Psychology of Interpersonal Relations, Wiley, New York.
Henry, E. (2006), “Market reaction to verbal components of earnings press releases:
     Event study using a predictive algorithm”, Journal of Emerging Technologies in
     Accounting Vol. 3, pp. 1-19.
Henry, E. (2008), “Are investors influenced by how earnings press releases are
     written?”, Journal of Business Communication, Vol. 45 No. 4, pp. 363-407.
Hildebrandt, H.H. and Snyder, R. (1981), “The Pollyanna hypothesis in business
     writing: initial results, suggestions for research,” Journal of Business
     Communication, Vol. 18 No. 1, pp. 5-15.
Hooghiemstra, R. (2000), “Corporate communication and impression management –
     New perspectives why companies engage in corporate social reporting”, Journal
     of Business Ethics, Vol. 27, pp. 55-68.
Johnson, P., Buehring, A. Cassell, C., and Symon, G. (2006), “Evaluating qualitative
     management research: towards a contingent criteriology,” International Journal
     of Management Reviews, Vol. 8 No. 3, pp. 131-156.


                                                                                  28
Jones, M.J. (1988), “A longitudinal study of the readability of the chairman’s
     narratives in the corporate reports of a UK company”, Accounting and Business
     Research, Vol. 18 No. 72, pp. 297-306.
Jones, E.E. and Davis, K.E. (1965), “From acts to dispositions: the attribution process
     in person perception”, In Berkowitz, L. (Ed.) Advances in Experimental Social
     Psychology, Vol. 2, New York, Academic Press, pp. 219-226.
Kelley, H.H. (1967), “Attribution in social psychology”, Nebraska Symposium on
     Motivation, Vol. 15, pp. 192-238.
Knee, C.R. and Zuckerman, M. (1996), “Causality orientations, failure and
     achievement”, Journal of Personality, Vol. 62, pp. 321-346.
Kohut, G.F. and Segars, A.H. (1992), “The president's letter to stockholders: and
        examination of corporate communication strategy”, The Journal of Business
        Communication, Vol. 29 No. 1, pp. 7-21.
Koonce, L. and Mercer, M. (2005), “Using psychology theories in archival financial
     accounting research”, Journal of Accounting Literature, Vol. 24.
Krische, S.D. (2005), “Investors’ evaluations of strategic prior-period benchmark
      disclosures in earnings announcements”, The Accounting Review, Vol. 80 No. 1,
      pp. 243-268.
Lang, M. and Lundholm, R. (2000), “Voluntary disclosure and equity offerings:
     Reducing information asymmetry or hyping the stock?”, Contemporary
     Accounting Research, Vol. 17 No. 4, pp. 623-662.
Leary, M.R., Kowalski, R.M. (1990), “Impression management: a literature review
     and two-component model”, Psychological Bulletin, Vol. 107 No.1, pp. 34-47.
Leary, M.R., Tchividjian, L.R. and Kraxberger, B.E. (1994), “Self-presentation can be
     hazardous to your health: impression management and health risk”, Health
     Psychology, Vol. 13 No. 6, pp. 461-470.
Letza, S., Kirkbride, J., Sun, X. and Smallman, C. (2008), “Corporate governance
     theorising: limits critics, and alternatives”, International Journal of Law and
     Management, Vol. 50 No.1, pp. 17-32.
Li, F. (2008), “Annual report readability, current earnings, and earnings persistence”,
     Journal of Accounting and Economics, Vol. 45 No. 2-3, pp. 221-247.
Macnamara, J. (2003), “Media content analysis: Is uses, benefits, and best practice
      methodology”, http://www.masscom.com.au/book/papers/media_content.html.
Mather, P., Ramsay, A. and Steen, A. (2000), “The use and representational
    faithfulness of graphs in IPO prospectuses”, Accounting, Auditing and
    Accountability Journal, Vol. 13 No.1, pp. 65-83.
Matsumoto, D., Pronk, M. and Roelofsen, E. (2006), Do analysts mitigate optimism
    by management? Working paper, University of Washington.
Merkl-Davies, D.M. and Brennan N.M. (2007), ‘Discretionary disclosure strategies in
    corporate narratives: incremental information or impression management?’,
    Journal of Accounting Literature, Vol. 26, pp. 116-196.
Mouck, T. (1995), “Financial reporting, democracy and environmentalism: a critique
    of the commodification of information”, Critical Perspectives on Accounting,
    Vol. 6, pp. 535-553.
Newman, M.L., Pennebaker, J.W., Berry, D.S. and Richards, J.M. (2003), “Lying
    words: predicting deception from linguistic styles”, Personality and Social
    Psychology Bulletin, Vol. 29 No.5, pp. 665-675.
Pennebaker, J.W., Chung, C.K., Ireland, M. Gonzales, A. and Booth, R.J. (2007), The
    LIWC2007 Application, http://www.liwc.net/liwcdescription.php (accessed 10
    February 2010).


                                                                                    29
Merkl-Davies, Doris M., Brennan, Niamh M. and McLeay, Stuart J. [2011] Impression management and retrospective sense-making in corporate narratives: A social psychology perspective. Accounting, Auditing and Accountability Journal, 24(3): 315-344.

Contenu connexe

Tendances

Performance measurement,[1] in thai
Performance measurement,[1] in thaiPerformance measurement,[1] in thai
Performance measurement,[1] in thai
kesavneupane
 
14 the relationship between job burnout, organizational citizenship behavior,...
14 the relationship between job burnout, organizational citizenship behavior,...14 the relationship between job burnout, organizational citizenship behavior,...
14 the relationship between job burnout, organizational citizenship behavior,...
INFOGAIN PUBLICATION
 
11.a proposed model of balance score cards for enterprise governance
11.a proposed model of balance score cards for enterprise governance11.a proposed model of balance score cards for enterprise governance
11.a proposed model of balance score cards for enterprise governance
Alexander Decker
 
Attitude Formation of Benefits Satisfaction: Knowledge and Fit of Benefits
Attitude Formation of Benefits Satisfaction: Knowledge and Fit of BenefitsAttitude Formation of Benefits Satisfaction: Knowledge and Fit of Benefits
Attitude Formation of Benefits Satisfaction: Knowledge and Fit of Benefits
Waqas Tariq
 
Impact of organizational justice on organizational effectiveness
Impact of organizational justice on organizational effectivenessImpact of organizational justice on organizational effectiveness
Impact of organizational justice on organizational effectiveness
Alexander Decker
 
Is it the Job or the Support
Is it the Job or the SupportIs it the Job or the Support
Is it the Job or the Support
joshuarknapp
 

Tendances (20)

The Role of Hierarchical Level and Functional Area in Environmental Scanning ...
The Role of Hierarchical Level and Functional Area in Environmental Scanning ...The Role of Hierarchical Level and Functional Area in Environmental Scanning ...
The Role of Hierarchical Level and Functional Area in Environmental Scanning ...
 
Performance measurement,[1] in thai
Performance measurement,[1] in thaiPerformance measurement,[1] in thai
Performance measurement,[1] in thai
 
14 the relationship between job burnout, organizational citizenship behavior,...
14 the relationship between job burnout, organizational citizenship behavior,...14 the relationship between job burnout, organizational citizenship behavior,...
14 the relationship between job burnout, organizational citizenship behavior,...
 
Paper 5
Paper 5Paper 5
Paper 5
 
H0412053061
H0412053061H0412053061
H0412053061
 
International Journal of Business and Management Invention (IJBMI)
International Journal of Business and Management Invention (IJBMI)International Journal of Business and Management Invention (IJBMI)
International Journal of Business and Management Invention (IJBMI)
 
11.a proposed model of balance score cards for enterprise governance
11.a proposed model of balance score cards for enterprise governance11.a proposed model of balance score cards for enterprise governance
11.a proposed model of balance score cards for enterprise governance
 
Orgarnisation behaviour assignment 1
Orgarnisation behaviour assignment 1Orgarnisation behaviour assignment 1
Orgarnisation behaviour assignment 1
 
Attitude Formation of Benefits Satisfaction: Knowledge and Fit of Benefits
Attitude Formation of Benefits Satisfaction: Knowledge and Fit of BenefitsAttitude Formation of Benefits Satisfaction: Knowledge and Fit of Benefits
Attitude Formation of Benefits Satisfaction: Knowledge and Fit of Benefits
 
11.impact of organizational justice on organizational effectiveness
11.impact of organizational justice on organizational effectiveness11.impact of organizational justice on organizational effectiveness
11.impact of organizational justice on organizational effectiveness
 
Impact of organizational justice on organizational effectiveness
Impact of organizational justice on organizational effectivenessImpact of organizational justice on organizational effectiveness
Impact of organizational justice on organizational effectiveness
 
Summary
SummarySummary
Summary
 
Organizational Behaviour Research: A Critical Analysis
Organizational Behaviour Research: A Critical AnalysisOrganizational Behaviour Research: A Critical Analysis
Organizational Behaviour Research: A Critical Analysis
 
E0331043049
E0331043049E0331043049
E0331043049
 
Merkl-Davies and Brennan A Conceptual Framework of Impression Management: New...
Merkl-Davies and Brennan A Conceptual Framework of Impression Management: New...Merkl-Davies and Brennan A Conceptual Framework of Impression Management: New...
Merkl-Davies and Brennan A Conceptual Framework of Impression Management: New...
 
Analyzing the current incorporation
Analyzing the current incorporationAnalyzing the current incorporation
Analyzing the current incorporation
 
4.rajeev verma 30 41
4.rajeev verma 30 414.rajeev verma 30 41
4.rajeev verma 30 41
 
Organisational analysis
Organisational analysisOrganisational analysis
Organisational analysis
 
Is it the Job or the Support
Is it the Job or the SupportIs it the Job or the Support
Is it the Job or the Support
 
Industrial Marketing Management : The impact of management commitment alignme...
Industrial Marketing Management : The impact of management commitment alignme...Industrial Marketing Management : The impact of management commitment alignme...
Industrial Marketing Management : The impact of management commitment alignme...
 

Similaire à Merkl-Davies, Doris M., Brennan, Niamh M. and McLeay, Stuart J. [2011] Impression management and retrospective sense-making in corporate narratives: A social psychology perspective. Accounting, Auditing and Accountability Journal, 24(3): 315-344.

03 14 brennan merkl davies accounting narratives and impression management
03 14 brennan merkl davies accounting narratives and impression management03 14 brennan merkl davies accounting narratives and impression management
03 14 brennan merkl davies accounting narratives and impression management
Prof Niamh M. Brennan
 
Readings Chapters 9 & 10 in the Dess, Lumpkin, & Eisner textbook, w.docx
Readings Chapters 9 & 10 in the Dess, Lumpkin, & Eisner textbook, w.docxReadings Chapters 9 & 10 in the Dess, Lumpkin, & Eisner textbook, w.docx
Readings Chapters 9 & 10 in the Dess, Lumpkin, & Eisner textbook, w.docx
laurieellan
 
15Reflection and Discussion Forum Week 3Sri Chaita
15Reflection and Discussion Forum Week 3Sri Chaita15Reflection and Discussion Forum Week 3Sri Chaita
15Reflection and Discussion Forum Week 3Sri Chaita
AnastaciaShadelb
 
15Reflection and Discussion Forum Week 3Sri Chaita
15Reflection and Discussion Forum Week 3Sri Chaita15Reflection and Discussion Forum Week 3Sri Chaita
15Reflection and Discussion Forum Week 3Sri Chaita
KiyokoSlagleis
 
his week we focus on how management can develop and use effectiv
his week we focus on how management can develop and use effectivhis week we focus on how management can develop and use effectiv
his week we focus on how management can develop and use effectiv
meagantobias
 
Paper eiasm conference 2013- def
Paper eiasm conference 2013- defPaper eiasm conference 2013- def
Paper eiasm conference 2013- def
Judith van Helvert
 
Discuss the complexity of problem definition and the importance of a.pdf
Discuss the complexity of problem definition and the importance of a.pdfDiscuss the complexity of problem definition and the importance of a.pdf
Discuss the complexity of problem definition and the importance of a.pdf
aroramobiles1
 
Purpose of Assignment The purpose of the assignment is to develo.docx
Purpose of Assignment The purpose of the assignment is to develo.docxPurpose of Assignment The purpose of the assignment is to develo.docx
Purpose of Assignment The purpose of the assignment is to develo.docx
makdul
 

Similaire à Merkl-Davies, Doris M., Brennan, Niamh M. and McLeay, Stuart J. [2011] Impression management and retrospective sense-making in corporate narratives: A social psychology perspective. Accounting, Auditing and Accountability Journal, 24(3): 315-344. (20)

03 14 brennan_merkl-davies_accounting_narratives_and_impression_management
03 14 brennan_merkl-davies_accounting_narratives_and_impression_management03 14 brennan_merkl-davies_accounting_narratives_and_impression_management
03 14 brennan_merkl-davies_accounting_narratives_and_impression_management
 
03 14 brennan merkl davies accounting narratives and impression management
03 14 brennan merkl davies accounting narratives and impression management03 14 brennan merkl davies accounting narratives and impression management
03 14 brennan merkl davies accounting narratives and impression management
 
Readings Chapters 9 & 10 in the Dess, Lumpkin, & Eisner textbook, w.docx
Readings Chapters 9 & 10 in the Dess, Lumpkin, & Eisner textbook, w.docxReadings Chapters 9 & 10 in the Dess, Lumpkin, & Eisner textbook, w.docx
Readings Chapters 9 & 10 in the Dess, Lumpkin, & Eisner textbook, w.docx
 
4_5888822791892897349.pdf
4_5888822791892897349.pdf4_5888822791892897349.pdf
4_5888822791892897349.pdf
 
15Reflection and Discussion Forum Week 3Sri Chaita
15Reflection and Discussion Forum Week 3Sri Chaita15Reflection and Discussion Forum Week 3Sri Chaita
15Reflection and Discussion Forum Week 3Sri Chaita
 
15Reflection and Discussion Forum Week 3Sri Chaita
15Reflection and Discussion Forum Week 3Sri Chaita15Reflection and Discussion Forum Week 3Sri Chaita
15Reflection and Discussion Forum Week 3Sri Chaita
 
his week we focus on how management can develop and use effectiv
his week we focus on how management can develop and use effectivhis week we focus on how management can develop and use effectiv
his week we focus on how management can develop and use effectiv
 
A stakeholder approach to corporate social responsibility, reputation and bus...
A stakeholder approach to corporate social responsibility, reputation and bus...A stakeholder approach to corporate social responsibility, reputation and bus...
A stakeholder approach to corporate social responsibility, reputation and bus...
 
Paper eiasm conference 2013- def
Paper eiasm conference 2013- defPaper eiasm conference 2013- def
Paper eiasm conference 2013- def
 
Tourism management
Tourism managementTourism management
Tourism management
 
organization behaviour disertation.pdf
organization behaviour disertation.pdforganization behaviour disertation.pdf
organization behaviour disertation.pdf
 
organization behaviour disertati.docx
organization behaviour disertati.docxorganization behaviour disertati.docx
organization behaviour disertati.docx
 
AF313- Lecture 5.1 Contingency theory.ppt
AF313- Lecture 5.1 Contingency theory.pptAF313- Lecture 5.1 Contingency theory.ppt
AF313- Lecture 5.1 Contingency theory.ppt
 
Discuss the complexity of problem definition and the importance of a.pdf
Discuss the complexity of problem definition and the importance of a.pdfDiscuss the complexity of problem definition and the importance of a.pdf
Discuss the complexity of problem definition and the importance of a.pdf
 
Influence of Knowledge Management Processes on Organizational Performance in ...
Influence of Knowledge Management Processes on Organizational Performance in ...Influence of Knowledge Management Processes on Organizational Performance in ...
Influence of Knowledge Management Processes on Organizational Performance in ...
 
A proposed model of balance score cards for enterprise governance
A proposed model of balance score cards for enterprise governanceA proposed model of balance score cards for enterprise governance
A proposed model of balance score cards for enterprise governance
 
IMPACT OF EMOTIONAL INTELLIGENCE ON HUMAN RESOURCE MANAGEMENT PRACTICES AMONG...
IMPACT OF EMOTIONAL INTELLIGENCE ON HUMAN RESOURCE MANAGEMENT PRACTICES AMONG...IMPACT OF EMOTIONAL INTELLIGENCE ON HUMAN RESOURCE MANAGEMENT PRACTICES AMONG...
IMPACT OF EMOTIONAL INTELLIGENCE ON HUMAN RESOURCE MANAGEMENT PRACTICES AMONG...
 
Purpose of Assignment The purpose of the assignment is to develo.docx
Purpose of Assignment The purpose of the assignment is to develo.docxPurpose of Assignment The purpose of the assignment is to develo.docx
Purpose of Assignment The purpose of the assignment is to develo.docx
 
Introduction to management
Introduction to managementIntroduction to management
Introduction to management
 
Brennan, Niamh M. [2008] “Introduction. Corporate Governance and Financial Re...
Brennan, Niamh M. [2008] “Introduction. Corporate Governance and Financial Re...Brennan, Niamh M. [2008] “Introduction. Corporate Governance and Financial Re...
Brennan, Niamh M. [2008] “Introduction. Corporate Governance and Financial Re...
 

Plus de Prof Niamh M. Brennan

Brennan, Niamh and Clarke, Peter [1985] Objective Tests in Financial Accounti...
Brennan, Niamh and Clarke, Peter [1985] Objective Tests in Financial Accounti...Brennan, Niamh and Clarke, Peter [1985] Objective Tests in Financial Accounti...
Brennan, Niamh and Clarke, Peter [1985] Objective Tests in Financial Accounti...
Prof Niamh M. Brennan
 
Brennan, Niamh M., Merkl-Davies, Doris M., and Beelitz, Annika [2013] Dialogi...
Brennan, Niamh M., Merkl-Davies, Doris M., and Beelitz, Annika [2013] Dialogi...Brennan, Niamh M., Merkl-Davies, Doris M., and Beelitz, Annika [2013] Dialogi...
Brennan, Niamh M., Merkl-Davies, Doris M., and Beelitz, Annika [2013] Dialogi...
Prof Niamh M. Brennan
 
Brennan, Niamh M. and Flynn, Maureen A. [2013] Differentiating Clinical Gover...
Brennan, Niamh M. and Flynn, Maureen A. [2013] Differentiating Clinical Gover...Brennan, Niamh M. and Flynn, Maureen A. [2013] Differentiating Clinical Gover...
Brennan, Niamh M. and Flynn, Maureen A. [2013] Differentiating Clinical Gover...
Prof Niamh M. Brennan
 
Brennan, Niamh M. and Conroy, John P. [2013] Executive Hubris: The Case of a ...
Brennan, Niamh M. and Conroy, John P. [2013] Executive Hubris: The Case of a ...Brennan, Niamh M. and Conroy, John P. [2013] Executive Hubris: The Case of a ...
Brennan, Niamh M. and Conroy, John P. [2013] Executive Hubris: The Case of a ...
Prof Niamh M. Brennan
 
Brennan, Niamh [1996] Disclosure of Profit Forecasts during Takeover Bids. Do...
Brennan, Niamh [1996] Disclosure of Profit Forecasts during Takeover Bids. Do...Brennan, Niamh [1996] Disclosure of Profit Forecasts during Takeover Bids. Do...
Brennan, Niamh [1996] Disclosure of Profit Forecasts during Takeover Bids. Do...
Prof Niamh M. Brennan
 
Brennan, Niamh M., Daly, Caroline A. and Harrington, Claire S. [2010] Rhetori...
Brennan, Niamh M., Daly, Caroline A. and Harrington, Claire S. [2010] Rhetori...Brennan, Niamh M., Daly, Caroline A. and Harrington, Claire S. [2010] Rhetori...
Brennan, Niamh M., Daly, Caroline A. and Harrington, Claire S. [2010] Rhetori...
Prof Niamh M. Brennan
 
Brennan, Niamh M., Guillamon-Saorin, Encarna and Pierce, Aileen [2009] Impres...
Brennan, Niamh M., Guillamon-Saorin, Encarna and Pierce, Aileen [2009] Impres...Brennan, Niamh M., Guillamon-Saorin, Encarna and Pierce, Aileen [2009] Impres...
Brennan, Niamh M., Guillamon-Saorin, Encarna and Pierce, Aileen [2009] Impres...
Prof Niamh M. Brennan
 
Brennan, Niamh M. and Solomon, Jill [2008] Corporate Governance, Accountabili...
Brennan, Niamh M. and Solomon, Jill [2008] Corporate Governance, Accountabili...Brennan, Niamh M. and Solomon, Jill [2008] Corporate Governance, Accountabili...
Brennan, Niamh M. and Solomon, Jill [2008] Corporate Governance, Accountabili...
Prof Niamh M. Brennan
 
Brennan, Niamh and Kelly, John [2007] A Study of Whistleblowing Among Trainee...
Brennan, Niamh and Kelly, John [2007] A Study of Whistleblowing Among Trainee...Brennan, Niamh and Kelly, John [2007] A Study of Whistleblowing Among Trainee...
Brennan, Niamh and Kelly, John [2007] A Study of Whistleblowing Among Trainee...
Prof Niamh M. Brennan
 

Plus de Prof Niamh M. Brennan (20)

Brennan, Niamh and Clarke, Peter [1985] Objective Tests in Financial Accounti...
Brennan, Niamh and Clarke, Peter [1985] Objective Tests in Financial Accounti...Brennan, Niamh and Clarke, Peter [1985] Objective Tests in Financial Accounti...
Brennan, Niamh and Clarke, Peter [1985] Objective Tests in Financial Accounti...
 
Brennan, Niamh M., Merkl-Davies, Doris M., and Beelitz, Annika [2013] Dialogi...
Brennan, Niamh M., Merkl-Davies, Doris M., and Beelitz, Annika [2013] Dialogi...Brennan, Niamh M., Merkl-Davies, Doris M., and Beelitz, Annika [2013] Dialogi...
Brennan, Niamh M., Merkl-Davies, Doris M., and Beelitz, Annika [2013] Dialogi...
 
Brennan, Niamh M. and Flynn, Maureen A. [2013] Differentiating Clinical Gover...
Brennan, Niamh M. and Flynn, Maureen A. [2013] Differentiating Clinical Gover...Brennan, Niamh M. and Flynn, Maureen A. [2013] Differentiating Clinical Gover...
Brennan, Niamh M. and Flynn, Maureen A. [2013] Differentiating Clinical Gover...
 
Brennan, Niamh M. and Conroy, John P. [2013] Executive Hubris: The Case of a ...
Brennan, Niamh M. and Conroy, John P. [2013] Executive Hubris: The Case of a ...Brennan, Niamh M. and Conroy, John P. [2013] Executive Hubris: The Case of a ...
Brennan, Niamh M. and Conroy, John P. [2013] Executive Hubris: The Case of a ...
 
Craig, Russell J. and Brennan, Niamh M. [2012] An Exploration of the Relation...
Craig, Russell J. and Brennan, Niamh M. [2012] An Exploration of the Relation...Craig, Russell J. and Brennan, Niamh M. [2012] An Exploration of the Relation...
Craig, Russell J. and Brennan, Niamh M. [2012] An Exploration of the Relation...
 
Brennan, Niamh [1996] Disclosure of Profit Forecasts during Takeover Bids. Do...
Brennan, Niamh [1996] Disclosure of Profit Forecasts during Takeover Bids. Do...Brennan, Niamh [1996] Disclosure of Profit Forecasts during Takeover Bids. Do...
Brennan, Niamh [1996] Disclosure of Profit Forecasts during Takeover Bids. Do...
 
Brennan, Niamh M., Daly, Caroline A. and Harrington, Claire S. [2010] Rhetori...
Brennan, Niamh M., Daly, Caroline A. and Harrington, Claire S. [2010] Rhetori...Brennan, Niamh M., Daly, Caroline A. and Harrington, Claire S. [2010] Rhetori...
Brennan, Niamh M., Daly, Caroline A. and Harrington, Claire S. [2010] Rhetori...
 
Brennan, Niamh M., Guillamon-Saorin, Encarna and Pierce, Aileen [2009] Impres...
Brennan, Niamh M., Guillamon-Saorin, Encarna and Pierce, Aileen [2009] Impres...Brennan, Niamh M., Guillamon-Saorin, Encarna and Pierce, Aileen [2009] Impres...
Brennan, Niamh M., Guillamon-Saorin, Encarna and Pierce, Aileen [2009] Impres...
 
Brennan, Niamh M. and Solomon, Jill [2008] Corporate Governance, Accountabili...
Brennan, Niamh M. and Solomon, Jill [2008] Corporate Governance, Accountabili...Brennan, Niamh M. and Solomon, Jill [2008] Corporate Governance, Accountabili...
Brennan, Niamh M. and Solomon, Jill [2008] Corporate Governance, Accountabili...
 
Brennan, Niamh M. and McGrath, Mary [2007] Financial Statement Fraud: Inciden...
Brennan, Niamh M. and McGrath, Mary [2007] Financial Statement Fraud: Inciden...Brennan, Niamh M. and McGrath, Mary [2007] Financial Statement Fraud: Inciden...
Brennan, Niamh M. and McGrath, Mary [2007] Financial Statement Fraud: Inciden...
 
Brennan, Niamh and Kelly, John [2007] A Study of Whistleblowing Among Trainee...
Brennan, Niamh and Kelly, John [2007] A Study of Whistleblowing Among Trainee...Brennan, Niamh and Kelly, John [2007] A Study of Whistleblowing Among Trainee...
Brennan, Niamh and Kelly, John [2007] A Study of Whistleblowing Among Trainee...
 
Brennan, Niamh [2006] Boards of Directors and Firm Performance: Is there an E...
Brennan, Niamh [2006] Boards of Directors and Firm Performance: Is there an E...Brennan, Niamh [2006] Boards of Directors and Firm Performance: Is there an E...
Brennan, Niamh [2006] Boards of Directors and Firm Performance: Is there an E...
 
Brennan, Niamh and Gray, Sidney J. [2005] The Impact of Materiality: Accounti...
Brennan, Niamh and Gray, Sidney J. [2005] The Impact of Materiality: Accounti...Brennan, Niamh and Gray, Sidney J. [2005] The Impact of Materiality: Accounti...
Brennan, Niamh and Gray, Sidney J. [2005] The Impact of Materiality: Accounti...
 
Brennan, Niamh [2005] Accounting Expertise in Litigation and Dispute Resoluti...
Brennan, Niamh [2005] Accounting Expertise in Litigation and Dispute Resoluti...Brennan, Niamh [2005] Accounting Expertise in Litigation and Dispute Resoluti...
Brennan, Niamh [2005] Accounting Expertise in Litigation and Dispute Resoluti...
 
Brennan, Niamh and McDermott, Michael [2004] Alternative Perspectives on Inde...
Brennan, Niamh and McDermott, Michael [2004] Alternative Perspectives on Inde...Brennan, Niamh and McDermott, Michael [2004] Alternative Perspectives on Inde...
Brennan, Niamh and McDermott, Michael [2004] Alternative Perspectives on Inde...
 
Brennan, Niamh [2003] Accounting in crisis: A story of auditing, accounting, ...
Brennan, Niamh [2003] Accounting in crisis: A story of auditing, accounting, ...Brennan, Niamh [2003] Accounting in crisis: A story of auditing, accounting, ...
Brennan, Niamh [2003] Accounting in crisis: A story of auditing, accounting, ...
 
Brennan, Niamh [2001] Reporting Intellectual Capital in Annual Reports: Evide...
Brennan, Niamh [2001] Reporting Intellectual Capital in Annual Reports: Evide...Brennan, Niamh [2001] Reporting Intellectual Capital in Annual Reports: Evide...
Brennan, Niamh [2001] Reporting Intellectual Capital in Annual Reports: Evide...
 
Brennan, Niamh and Connell, Brenda [2000] Intellectual Capital: Current Issue...
Brennan, Niamh and Connell, Brenda [2000] Intellectual Capital: Current Issue...Brennan, Niamh and Connell, Brenda [2000] Intellectual Capital: Current Issue...
Brennan, Niamh and Connell, Brenda [2000] Intellectual Capital: Current Issue...
 
Brennan, Niamh and Hourigan, Denis [2000] Corporate Reporting on the Internet...
Brennan, Niamh and Hourigan, Denis [2000] Corporate Reporting on the Internet...Brennan, Niamh and Hourigan, Denis [2000] Corporate Reporting on the Internet...
Brennan, Niamh and Hourigan, Denis [2000] Corporate Reporting on the Internet...
 
Brennan, Niamh [2000] An Empirical Examination of Forecast Disclosure by Bidd...
Brennan, Niamh [2000] An Empirical Examination of Forecast Disclosure by Bidd...Brennan, Niamh [2000] An Empirical Examination of Forecast Disclosure by Bidd...
Brennan, Niamh [2000] An Empirical Examination of Forecast Disclosure by Bidd...
 

Dernier

Call Girls From Pari Chowk Greater Noida ❤️8448577510 ⊹Best Escorts Service I...
Call Girls From Pari Chowk Greater Noida ❤️8448577510 ⊹Best Escorts Service I...Call Girls From Pari Chowk Greater Noida ❤️8448577510 ⊹Best Escorts Service I...
Call Girls From Pari Chowk Greater Noida ❤️8448577510 ⊹Best Escorts Service I...
lizamodels9
 
Call Girls Electronic City Just Call 👗 7737669865 👗 Top Class Call Girl Servi...
Call Girls Electronic City Just Call 👗 7737669865 👗 Top Class Call Girl Servi...Call Girls Electronic City Just Call 👗 7737669865 👗 Top Class Call Girl Servi...
Call Girls Electronic City Just Call 👗 7737669865 👗 Top Class Call Girl Servi...
amitlee9823
 
Chandigarh Escorts Service 📞8868886958📞 Just📲 Call Nihal Chandigarh Call Girl...
Chandigarh Escorts Service 📞8868886958📞 Just📲 Call Nihal Chandigarh Call Girl...Chandigarh Escorts Service 📞8868886958📞 Just📲 Call Nihal Chandigarh Call Girl...
Chandigarh Escorts Service 📞8868886958📞 Just📲 Call Nihal Chandigarh Call Girl...
Sheetaleventcompany
 
Call Girls in Delhi, Escort Service Available 24x7 in Delhi 959961-/-3876
Call Girls in Delhi, Escort Service Available 24x7 in Delhi 959961-/-3876Call Girls in Delhi, Escort Service Available 24x7 in Delhi 959961-/-3876
Call Girls in Delhi, Escort Service Available 24x7 in Delhi 959961-/-3876
dlhescort
 
Call Girls In Noida 959961⊹3876 Independent Escort Service Noida
Call Girls In Noida 959961⊹3876 Independent Escort Service NoidaCall Girls In Noida 959961⊹3876 Independent Escort Service Noida
Call Girls In Noida 959961⊹3876 Independent Escort Service Noida
dlhescort
 
FULL ENJOY Call Girls In Majnu Ka Tilla, Delhi Contact Us 8377877756
FULL ENJOY Call Girls In Majnu Ka Tilla, Delhi Contact Us 8377877756FULL ENJOY Call Girls In Majnu Ka Tilla, Delhi Contact Us 8377877756
FULL ENJOY Call Girls In Majnu Ka Tilla, Delhi Contact Us 8377877756
dollysharma2066
 
unwanted pregnancy Kit [+918133066128] Abortion Pills IN Dubai UAE Abudhabi
unwanted pregnancy Kit [+918133066128] Abortion Pills IN Dubai UAE Abudhabiunwanted pregnancy Kit [+918133066128] Abortion Pills IN Dubai UAE Abudhabi
unwanted pregnancy Kit [+918133066128] Abortion Pills IN Dubai UAE Abudhabi
Abortion pills in Kuwait Cytotec pills in Kuwait
 
Nelamangala Call Girls: 🍓 7737669865 🍓 High Profile Model Escorts | Bangalore...
Nelamangala Call Girls: 🍓 7737669865 🍓 High Profile Model Escorts | Bangalore...Nelamangala Call Girls: 🍓 7737669865 🍓 High Profile Model Escorts | Bangalore...
Nelamangala Call Girls: 🍓 7737669865 🍓 High Profile Model Escorts | Bangalore...
amitlee9823
 

Dernier (20)

Falcon Invoice Discounting: The best investment platform in india for investors
Falcon Invoice Discounting: The best investment platform in india for investorsFalcon Invoice Discounting: The best investment platform in india for investors
Falcon Invoice Discounting: The best investment platform in india for investors
 
Call Girls From Pari Chowk Greater Noida ❤️8448577510 ⊹Best Escorts Service I...
Call Girls From Pari Chowk Greater Noida ❤️8448577510 ⊹Best Escorts Service I...Call Girls From Pari Chowk Greater Noida ❤️8448577510 ⊹Best Escorts Service I...
Call Girls From Pari Chowk Greater Noida ❤️8448577510 ⊹Best Escorts Service I...
 
Call Girls Electronic City Just Call 👗 7737669865 👗 Top Class Call Girl Servi...
Call Girls Electronic City Just Call 👗 7737669865 👗 Top Class Call Girl Servi...Call Girls Electronic City Just Call 👗 7737669865 👗 Top Class Call Girl Servi...
Call Girls Electronic City Just Call 👗 7737669865 👗 Top Class Call Girl Servi...
 
Chandigarh Escorts Service 📞8868886958📞 Just📲 Call Nihal Chandigarh Call Girl...
Chandigarh Escorts Service 📞8868886958📞 Just📲 Call Nihal Chandigarh Call Girl...Chandigarh Escorts Service 📞8868886958📞 Just📲 Call Nihal Chandigarh Call Girl...
Chandigarh Escorts Service 📞8868886958📞 Just📲 Call Nihal Chandigarh Call Girl...
 
John Halpern sued for sexual assault.pdf
John Halpern sued for sexual assault.pdfJohn Halpern sued for sexual assault.pdf
John Halpern sued for sexual assault.pdf
 
Call Girls Zirakpur👧 Book Now📱7837612180 📞👉Call Girl Service In Zirakpur No A...
Call Girls Zirakpur👧 Book Now📱7837612180 📞👉Call Girl Service In Zirakpur No A...Call Girls Zirakpur👧 Book Now📱7837612180 📞👉Call Girl Service In Zirakpur No A...
Call Girls Zirakpur👧 Book Now📱7837612180 📞👉Call Girl Service In Zirakpur No A...
 
Phases of Negotiation .pptx
 Phases of Negotiation .pptx Phases of Negotiation .pptx
Phases of Negotiation .pptx
 
👉Chandigarh Call Girls 👉9878799926👉Just Call👉Chandigarh Call Girl In Chandiga...
👉Chandigarh Call Girls 👉9878799926👉Just Call👉Chandigarh Call Girl In Chandiga...👉Chandigarh Call Girls 👉9878799926👉Just Call👉Chandigarh Call Girl In Chandiga...
👉Chandigarh Call Girls 👉9878799926👉Just Call👉Chandigarh Call Girl In Chandiga...
 
Organizational Transformation Lead with Culture
Organizational Transformation Lead with CultureOrganizational Transformation Lead with Culture
Organizational Transformation Lead with Culture
 
Value Proposition canvas- Customer needs and pains
Value Proposition canvas- Customer needs and painsValue Proposition canvas- Customer needs and pains
Value Proposition canvas- Customer needs and pains
 
Call Girls in Delhi, Escort Service Available 24x7 in Delhi 959961-/-3876
Call Girls in Delhi, Escort Service Available 24x7 in Delhi 959961-/-3876Call Girls in Delhi, Escort Service Available 24x7 in Delhi 959961-/-3876
Call Girls in Delhi, Escort Service Available 24x7 in Delhi 959961-/-3876
 
MONA 98765-12871 CALL GIRLS IN LUDHIANA LUDHIANA CALL GIRL
MONA 98765-12871 CALL GIRLS IN LUDHIANA LUDHIANA CALL GIRLMONA 98765-12871 CALL GIRLS IN LUDHIANA LUDHIANA CALL GIRL
MONA 98765-12871 CALL GIRLS IN LUDHIANA LUDHIANA CALL GIRL
 
Call Girls In Noida 959961⊹3876 Independent Escort Service Noida
Call Girls In Noida 959961⊹3876 Independent Escort Service NoidaCall Girls In Noida 959961⊹3876 Independent Escort Service Noida
Call Girls In Noida 959961⊹3876 Independent Escort Service Noida
 
FULL ENJOY Call Girls In Majnu Ka Tilla, Delhi Contact Us 8377877756
FULL ENJOY Call Girls In Majnu Ka Tilla, Delhi Contact Us 8377877756FULL ENJOY Call Girls In Majnu Ka Tilla, Delhi Contact Us 8377877756
FULL ENJOY Call Girls In Majnu Ka Tilla, Delhi Contact Us 8377877756
 
Dr. Admir Softic_ presentation_Green Club_ENG.pdf
Dr. Admir Softic_ presentation_Green Club_ENG.pdfDr. Admir Softic_ presentation_Green Club_ENG.pdf
Dr. Admir Softic_ presentation_Green Club_ENG.pdf
 
unwanted pregnancy Kit [+918133066128] Abortion Pills IN Dubai UAE Abudhabi
unwanted pregnancy Kit [+918133066128] Abortion Pills IN Dubai UAE Abudhabiunwanted pregnancy Kit [+918133066128] Abortion Pills IN Dubai UAE Abudhabi
unwanted pregnancy Kit [+918133066128] Abortion Pills IN Dubai UAE Abudhabi
 
It will be International Nurses' Day on 12 May
It will be International Nurses' Day on 12 MayIt will be International Nurses' Day on 12 May
It will be International Nurses' Day on 12 May
 
B.COM Unit – 4 ( CORPORATE SOCIAL RESPONSIBILITY ( CSR ).pptx
B.COM Unit – 4 ( CORPORATE SOCIAL RESPONSIBILITY ( CSR ).pptxB.COM Unit – 4 ( CORPORATE SOCIAL RESPONSIBILITY ( CSR ).pptx
B.COM Unit – 4 ( CORPORATE SOCIAL RESPONSIBILITY ( CSR ).pptx
 
Nelamangala Call Girls: 🍓 7737669865 🍓 High Profile Model Escorts | Bangalore...
Nelamangala Call Girls: 🍓 7737669865 🍓 High Profile Model Escorts | Bangalore...Nelamangala Call Girls: 🍓 7737669865 🍓 High Profile Model Escorts | Bangalore...
Nelamangala Call Girls: 🍓 7737669865 🍓 High Profile Model Escorts | Bangalore...
 
Famous Olympic Siblings from the 21st Century
Famous Olympic Siblings from the 21st CenturyFamous Olympic Siblings from the 21st Century
Famous Olympic Siblings from the 21st Century
 

Merkl-Davies, Doris M., Brennan, Niamh M. and McLeay, Stuart J. [2011] Impression management and retrospective sense-making in corporate narratives: A social psychology perspective. Accounting, Auditing and Accountability Journal, 24(3): 315-344.

  • 1. Impression management and retrospective sense-making in corporate narratives: A social psychology perspective Doris M. Merkl-Davies*, Niamh M. Brennan** and Stuart J. McLeay*** ∗ Bangor University; ** University College Dublin; *** University of Sussex. (Paper published in Accounting, Auditing and Accountability Journal, 24(3)(2011): 315-344) Correspondence should be addressed to Doris Merkl-Davies, Bangor Business School, Bangor University, Bangor, Gwynedd LL57 2DG, Great Britain. Tel.: 0044-(0)1248-382120; d.m.merkl- davies@bangor.ac.uk i
  • 2. Impression management and retrospective sense-making in corporate narratives: A social psychology perspective Abstract Purpose – Prior accounting research views impression management predominantly though the lens of economics. Drawing on social psychology research, we provide a complementary perspective on corporate annual narrative reporting as characterised by conditions of ‘ex post accountability’ (Aerts, 2005, p. 497). These give rise to (i) impression management resulting from the managerial anticipation of the feedback effects of information and/or to (ii) managerial sense-making by means of the retrospective framing of organisational outcomes. Design/methodology/approach – We use a content analysis approach pioneered by psychology research (Newman et al., 2003) which is based on the psychological dimension of word use to investigate the chairmen’s statements of 93 UK listed companies. Findings – Results suggest that firms do not use chairmen’s statements to create an impression at variance with an overall reading of the annual report. We find that negative organisational outcomes prompt managers to engage in retrospective sense- making, rather than to present a public image of organisational performance inconsistent with the view internally held by management (self-presentational dissimulation). Further, managers of large firms use chairmen’s statements to portray an accurate (i.e., consistent with an overall reading of the annual report), albeit favourable, image of the firm and of organisational outcomes (i.e., impression management by means of enhancement). Research limitations – The content analysis approach adopted in the study analyses words out of context. Practical implications – Corporate annual reporting may not only be understood from a behavioural perspective involving managers responding to objectively determined stimuli inherent in the accountability framework, but also from a symbolic interaction perspective which involves managers retrospectively making sense of organisational outcomes and events. Originality/value – Our approach allows us to investigate three complementary scenarios of managerial corporate annual reporting behaviour: (i) self-presentational dissimulation, (ii) impression management by means of enhancement, and (iii) retrospective sense-making. Keywords: Impression management; Retrospective sense-making; Chairmen’s statements; Social psychology. Paper type: Research paper ii
  • 3. 1. INTRODUCTION Prior research focusing on impression management in a corporate reporting context is often either explicitly or implicitly based on economics-based theories, particularly agency theory (Merkl-Davies and Brennan, 2007). Managers are assumed to act rationally to maximise their utility by exploiting information asymmetries to mislead investors about financial performance and prospects. This manifests itself in reporting bias, i.e., the emphasis of positive organisational outcomes and the obfuscation of negative organisational outcomes in corporate narrative documents. What is more, managerial behaviour tends to be regarded as only minimally affected by social relations (Letza et al., 2008). However, we argue that managerial narrative disclosure decisions are affected by the social constraints arising from the (imagined) presence of the recipients of corporate reports who use the information in their decision- making. Psychological factors thus may provide a richer explanation of managerial impression management than economic factors. For this reason, we adopt a social psychology perspective, which complements the narrow concept of economic rationality by viewing managerial behaviour as subject to social biases arising from the (imagined) presence of others whose behaviour management is trying to anticipate (Allport, 1954, p. 5). Accounting research can thus benefit from insights from social psychology which regards impression management as driven by social relations characterised by an anticipation of an evaluation of conduct (Frink and Ferris, 1998). Users of corporate narrative documents have been shown to be susceptible to behavioural effects including a variety of cognitive and social biases. This prevent them from assessing reporting bias arising from the manipulation of the presentation and disclosure of information in corporate narrative documents (for example, Baird and Zelin 2000; Courtis 2004b; Elliott 2006; Frederickson and Miller 2004; Krische 2005). However, the information communicated in corporate narrative documents impacts not only on the behaviour of the information recipients, but also on the behaviour of the information providers in the sense that they anticipate the potential undesirable consequences of information releases in the form of unfavourable analyst reports, credit ratings, or news reports (Prakash and Rappaport, 1977). If corporate narrative documents are regarded as a description of the decision behaviour of the firm’s management and thus reflect managerial performance (Prakash and Rappaport, 1977, p. 35), then managers may be prompted to engage in impression management with the expectation that shareholders and stakeholders may respond in less undesired ways. Alternatively, the process of anticipating the reactions of information recipients to managerial disclosures may prompt managers to engage in ‘retrospective sense- making’ (Aerts, 2005, p. 496) which involves retrospectively framing organisational outcomes. 1.1 Definition and scope This paper constitutes an empirical, interdisciplinary study of managerial impression management focusing on the less researched ‘social’ dimension of corporate narrative reporting. It is interdisciplinary in the sense that it draws on theoretical insights from social psychology and uses a content analysis approach developed by social psychology research to analyse impression management in 93 UK chairmen’s 3
  • 4. statements of listed firms. We regard impression management as a social bias which involves “controlling or manipulating the attributions or impressions” (Tedeschi and Riess, 1981, p. 3) of others with the aim of being perceived favourably (Hooghiemstra, 2000, p. 60). Further, as the presence of shareholders/stakeholders impacts on the way managers think, feel and express themselves, corporate narrative documents contain psychological information which can be extracted by means of content analysis. 1.2 Importance of studying narrative disclosures Driven by the realisation that fundamentals only explain a small fraction of share price movements (Cenesizoglu and Timmermann, 2008), accounting researchers have increasingly turned to the study of corporate narratives. They are either regarded as a means of providing incremental useful information to improve decision-making or, alternatively, as a means of providing biased information to mislead investors (Merkl- Davies and Brennan, 2007). If they are used opportunistically, this may result in capital misallocations and unfair wealth transfers from shareholders to managers (for example, in the form of increased compensation via share options). Impression management thus constitutes an important corporate governance and regulatory issue. The seriousness of this issue for both firms and shareholders is demonstrated by Rogers et al.’s (2009) finding that optimistic tone in earnings announcements is significantly associated with shareholder litigation. This suggests that corporate narrative documents may contain reporting bias and that investors are unable to assess this bias in the short term. 1.3 Motivations, objectives and contribution of the paper In archival accounting research, psychology theories have been found to be useful to make predictions and interpret results (Koonce and Mercer, 2005). However, most prior research does not sufficiently use social psychology theories to provide insights into managerial impression management. This is particularly paradoxical, considering that this is the discipline in which impression management research originates. Our objective is to add richer explanations of impression management motivations and strategies using insights from psychology research. We also consider the possibility that the conditions of ‘ex post accountability’ (Aerts, 2005, p. 497) which characterise corporate annual reporting, may not only give rise to impression management, but also to the retrospective framing of organisational outcomes. We introduce a method for uncovering impression management pioneered by psychology research (Newman et al., 2003). Unlike prior studies, which focus on specific impression management strategies (see Merkl-Davies and Brennan, 2007), we focus on the linguistic indicators of the psychological processes involved in managers submitting to an inquiry by shareholders and stakeholders who evaluate organisational and managerial performance. Our results from an empirical application of this method based on a sample of 93 UK chairmen’s statements of listed companies suggest that firms do not use corporate annual report documents to portray a public image of organisational performance inconsistent with the view internally held by management (self-presentational dissimulation). Rather, corporate narratives are used to portray an accurate (i.e., consistent with an overall reading of the annual report), albeit favourable, view of 4
  • 5. organisational outcomes and to retrospectively provide explanations of organisational outcomes and events. Section 2 discusses the theoretical assumptions underlying prior research. Section 3 introduces a social psychology perspective of corporate annual reporting. Section 4 outlines the research questions, hypotheses and the research method. Section 5 discusses the results and Section 6 concludes the paper. 2. THEORETICAL BASIS OF PRIOR RESEARCH Prior research regards managers as rational, self-interested decision-makers and social interaction with firm outsiders by means of corporate reporting is regarded solely in terms of market exchange (Mouck, 1995). Impression management entails managers opportunistically taking advantage of information asymmetries. Managers use the discretion inherent in corporate narrative reporting by means of manipulating the presentation and disclosure of information in order to “distort readers’ perceptions of corporate achievements” (Godfrey et al., 2003, p. 96). Similar to earnings management, impression management is viewed as constituting an inconsistency between the managerial view of organisational performance and the view conveyed publicly in corporate narrative documents (Healy and Wahlen, 1999, p. 368). Corporate narrative documents are considered to be potential impression management vehicles which can be used by managers to present a self-interested view of corporate performance (Bettman and Weitz, 1983; Staw et al., 1983; Abrahamson and Park, 1994; Beattie and Jones, 2000; Clatworthy and Jones, 2006; Mather et al., 2000). Impression management involves emphasising positive organisational outcomes (enhancement) or obfuscating negative organisational outcomes (concealment), for example, by including (more favourable) pro forma earnings numbers in corporate narratives or by displaying positive organisational outcomes more prominently than negative organisational outcomes (e.g., by means of positioning or highlighting). As negative organisational outcomes give rise to conflicts of interest between managers and shareholders, managers are assumed to be prompted to manipulate outsiders’ perceptions of and decisions on financial performance and prospects, i.e., to engage in impression management (Aerts, 2005). Managerial motives may include benefitting from increased compensation, particularly via managerial stock options (Adelberg, 1979; Rutherford, 2003; Courtis, 2004a). Some impression management studies are either explicitly or implicitly based on a social psychology perspective. Impression management is viewed as a self-serving bias entailing, for example, the attribution of positive organisational outcomes to internal factors (taking responsibility for good performance) and of negative organisational outcomes to external circumstances (assigning blame for bad performance) (Aerts, 1994, 2001; Clatworthy and Jones, 2003). Self-serving bias is explained by reference to attribution theory (Heider, 1958; Jones and Davis, 1965; Kelley, 1967) which is concerned with people’s explanations of events. Research suggests that, in an interactive context, people’s attribution of actions and events is biased in the sense that they take credit for success and deny responsibility for failure (Knee and Zuckerman, 1996). Although prior research often acknowledges the social psychology roots of impression management in the form of performance attributions, the analysis tends to be carried out within an economics-based framework with managers acting as rational utility maximising individuals. We argue that self-serving bias may constitute a social bias resulting from the accountability context inherent in 5
  • 6. the corporate reporting process. What is more, prior research regards managerial corporate reporting behaviour as characterised by prospective rationality. This means that narrative disclosures are regarded as the result of purposeful, goal-directed behaviour, either aimed at providing useful incremental information or at providing misleading information (impression management). However, Aerts (2005) argues that corporate annual reporting may be characterised by retrospective rationality which involves making sense of actions and events that have already occurred. 3. A SOCIAL PSYCHOLOGY PERSPECTIVE OF CORPORATE ANNUAL REPORTING The social psychology literature regards impression management as consisting of two different processes, namely impression motivation and impression construction (Leary and Kowalski, 1990). Impression motivation is concerned with the circumstances which motivate individuals to engage in impression management. Impression construction entails “choosing the kind of impression to create” and “deciding how [to] go about doing so” (Leary and Kowalski, 1990, pp. 35-36). We first discuss the social factors impacting on impression motivation which we regard as embedded in, and dependent on, social relations. As impression management involves “the process by which people attempt to control the impressions others form of them” (Leary and Kowalski, 1990, p. 34), it is social in character. This means that the social ‘presence’ of others is an essential part of impression management. Thus, the determinants of impression management behaviour may be located externally in the social context, as well as internally within managers. As impression management in a corporate reporting context occurs in the (imagined) presence of outside parties, we regard it to be determined by the accountability relationship between management and financial and non-financial stakeholders.1 We then focus on impression construction which involves constructing public images that are either (i) a reflection of one’s self-image or (ii) images which are inconsistent with one’s self-concept (Leary and Kowalski, 1990, p. 40). The former entails managers using corporate annual documents to present an accurate (i.e., consistent with an overall reading of the annual report), but favourable view of organisational outcomes, whereas the latter entails “presenting images that are…not accurate” (Leary et al., 1994, p. 461). This is referred to as self-presentational dissimulation (Leary and Kowalski, 1990, p. 40). In a corporate annual reporting context, it entails the managerial construction of public images of managerial actions and events that are inconsistent with the way management may view these actions and events. We introduce a new content analysis approach pioneered by psychology research which focuses on the linguistic indicators of the psychological processes underlying involved in self-presentational dissimulation. 3.1 Accountability, impression motivation, and retrospective sense-making Schlenker et al. (1994, p. 634) defines accountability as “the condition of being answerable to audiences for performing up to certain standards, thereby fulfilling 1 This implies a wide concept of accountability which views firms as reacting to the concerns of all external parties (Stanton and Stanton, 2002). 6
  • 7. responsibilities, duties, expectations, and other charges”. On the one hand, accountability entails the obligation of one party to provide explanations and justifications for its conduct to another party. On the other hand, it involves the first party’s behaviour being subject to the scrutiny, judgment and sanctioning of the second party. According to Schlenker (1997), accountability involves three components which affect judgement and decision-making in different ways, namely (1) the inquiry component, (2) the accounting component, and (3) the verdict component. The inquiry component entails anticipating or submitting to an inquiry by an audience who evaluates one’s actions and decisions in relation to specific prescriptions. The accounting component involves presenting one’s version of events. This gives the individual the opportunity to describe, document, interpret, and explain relevant information with the purpose of constructing a personal account of events and providing reasons for their occurrence. The verdict component entails the audience delivering a verdict. This comprises both a judgment of the individual and the application of either social and material rewards or sanctions. Thus, the experience or anticipation of an evaluative appraisal is crucial to the concept of accountability. Frink and Ferris (1998), who apply the concept of accountability in organisational research, establish the link between accountability and impression management. They argue that, in an accountability context, individuals engage in impression management in anticipation of an evaluation of their conduct. Impression management thus constitutes a way of influencing the impressions and decisions of relevant parties in order to win rewards and avoid sanctions. Thus, conditions of accountability foster impression management. Managerial behaviour in the corporate reporting process can also be analysed in the context of an accountability framework. Managers are accountable to outside parties for their decisions and actions, with the annual report serving as an accountability mechanism to react to the concerns of external parties (Stanton and Stanton, 2002, p. 492). Thus, impression management can be conceptualised as arising from the inquiry component of corporate reporting with managers engaging in impression management in anticipation of an evaluation of their actions and decisions (primarily) by shareholders. Managers are assumed to engage in impression management to counteract undesirable consequences of information releases.2 Figure 1 illustrates the role of corporate narrative reporting in the accountability process. 2 These take the form of unfavourable analyst reports and credit ratings, and ultimately, negative share price movements on the one hand; and loss of stakeholder support and social legitimacy on the other hand. As corporate reporting takes place in a social context, it is influenced by social norms and rules. This requires a shift to substantive rationality which is concerned with ideals, goals and ends which are pursued for their own sake, such as equality, justice, and freedom (Weber, 1968). Substantive rationality addresses mainly social and environmental issues, such as fair trade, equality in the workplace, and pollution. Substantive rationality is a rationality of ends which involves applying appropriate reason to achieve these ends. Thus, impression management is regarded as a managerial attempt to gain or restore social legitimacy by aligning the company’s norms and values with those of society by decoupling or symbolic management. In this case, impression management constitutes an inconsistency between the firm’s actual and professed norms and values. 7
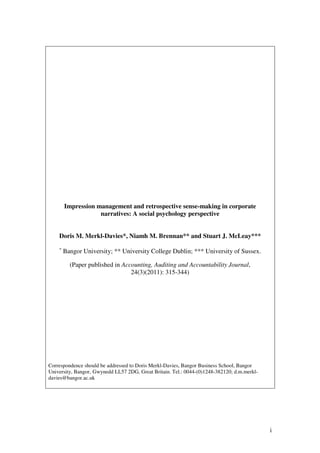
  • 8. Figure 1: Role of corporate narrative reporting in the accountability process 3 Delivery of judgement/verdict e.g. Buying / selling shares Restoring social legitimacy Individual Jury 2 Accounting: presenting (Shareholders (Management) one’s version of events & Stakeholders) Impression management / Retrospective sense making Anticipation of inquiry (information inductance) Key: Represents the direction of influence (i.e. either from management to shareholders or from shareholders to management). ___ Represents the direction of influence conceptualised in the mainstream view of the corporate reporting process, i.e. the interaction between firm insiders and outsiders by means of market exchange. ------ Represents the unobservable psychological processes underlying impression management resulting from the (imaged) presence of (primarily) shareholders, the recipients of the annual report. The process of anticipating the reactions of information recipients to managerial disclosures is referred to as ‘information inductance’ (Prakash and Rappaport 1977). Impression management can thus be regarded as resulting from the behavioural impact of information on managers who aim to control the feedback effects of reported information by means of altering it before it is released. Alternatively, Aerts (2005) argues that the accountability context of corporate annual reporting prompts managers to engage in retrospective sense-making. This concept originates in Weick’s (1995) work on organisational sense-making and refers to the interpretation of events that have already occurred. Managers may thus use corporate annual report documents to proactively shape shareholders’ and stakeholders’ perceptions of organisational outcomes and events (impression management) and/or to retrospectively provide an account of events (retrospective sense-making). Retrospective sense-making is contrary to the goal-seeking perspective of economic rationality which is generally assumed to drive managerial behaviour and thus corporate narrative reporting. The conditions of ‘ex post’ accountability in corporate annual reporting, which is characterised by managers anticipating readers’ reactions, may give rise to impression management and/or retrospective sense-making. Impression management may take the form of presenting an inaccurate view of organisational outcomes (self-presentational dissimulation) and/or an accurate, but favourable, view of organisational outcomes (enhancement). Whereas self- presentational dissimulation entails “creat[ing] an impression at variance with an overall reading of the [annual] report” (Stanton et al., 2004, p. 57), impression management by means of enhancement involves creating an impression consistent with an overall reading of the annual report. Figure 2 illustrates the impact of accountability on managerial corporate annual reporting behaviour as impression management and/or retrospective sense-making. 8
  • 9. Figure 2: The impact of accountability on managerial corporate annual reporting behaviour Accountability (i) Impression (ii) (c) Retrospective management sense-making Constructing an inaccurate Constructing an accurate, but impression of organisational favourable, impression of outcomes organisational outcomes (at variance with an overall (consistent with an overall reading of the annual report) reading of the annual report) (a) self-presentational (b) Enhancement dissimulation (emphasis of positive (obfuscation of negative organisational outcomes) organisational outcomes) 3.2 Impression construction, self-presentational dissimulation and the psychological dimension of word use We assume that the concerns of information providers about the consequences of the information recipients’ actions will manifest themselves verbally. We focus on the linguistic indicators of the psychological processes underlying the construction of images which are inconsistent with one’s self-concept. Previous studies have focused on specific impression management strategies adopted to obfuscate negative organisational outcomes, thereby constructing an impression of organisational outcomes at variance with an overall reading of the annual report, in particular reading ease manipulation and rhetorical manipulation (Merkl-Davies and Brennan, 2007). Social psychology is a discipline that uses scientific methods “to understand and explain how the thoughts, feelings and behaviours of individuals are influenced by the actual, imagined or implied presence of other human beings” (Allport, 1954, p. 5). The underlying assumption is that unobservable processes, such as thoughts, feelings, and beliefs are the psychological dimension of social behaviour and that these can be inferred from behaviour. Behaviour includes actions and non-verbal behaviour, such as body language, facial expressions, gestures, and language. The method of analysis chosen is based on the assumption that the way people express themselves conveys psychological information (Pennebaker et al., 2003). Language is viewed as a psychological marker which can be analysed by counting the occurrence of specific words and word categories which capture the way content is expressed (Newman et al., 2003). It involves word counts of grammatical features, 9
  • 10. such as personal pronouns (e.g., I, my, mine) and conjunctions (e.g., and, but, although) or psychologically derived linguistic dimensions, such as emotion words (e.g., wonderful, exciting) or achievement-related words (e.g., try, goal, win). Word count strategies “are based on the assumption that the words people use convey psychological information over and above their literal meaning and independent of their semantic context” (Pennebaker et al., 2003, p. 550). Pennebaker et al., (2003) observe that three classes of word categories are implicated in deception (what we call self-presentational dissimulation) – pronoun use, emotion words and markers of cognitive complexity (e.g., exclusive words). Newman et al., (2003) find a relatively consistent linguistic profile for deception, based on five word categories: (1) first person singular pronouns (liars avoid statements of ownership, disassociate themselves from the text), (2) third person pronouns, (3) negative emotion words (arising from discomfort and guilt associated with lying), (4) exclusive words (associated with cognitive complexity) and (5) motion verbs (negatively associated with cognitive complexity) (liars tell less complex stories). Verbosity, i.e., the amount of words used, is also found to be a predictor of deception (lying is associated with less detail, thus resulting in shorter communication) (DePaulo et al., 2003; Burgoon et al., 2003; Vrij at al., 2000). Following this research, we employ a content analysis approach which is based on the linguistic indicators of self-presentational dissimulation in the form of six word categories, namely (1) word count, (2) first person pronouns, (3) third person pronouns, (4) positive emotion words, (5) negative emotion words, and (6) words relating to underlying complex cognitive processes (Burgoon et al., 1996; 2003; Newman et al., 2003; Pennebaker et al., 2003). These convey psychological information on the underlying emotional state of individuals engaged in constructing public images which are inconsistent with their self-concept. They “are the result of anxiety, negative emotional states, and cognitive demand” (Carlson et al., 2004, p. 7) which go hand-in-hand with conveying “messages and information knowingly transmitted to create a false impression or conclusion” (Burgoon and Nunamaker, 2004, p. 1). The intention is to construct an instrument measuring the verbal manifestations of managerial concern about the impact of narrative disclosures on information recipients’ actions. However, psychology research based on word use shows the content categories used to analyse self-presentational dissimulation to be indicative of a variety of other psychological processes and behaviour, including gender, and physical and emotional health (Campbell and Pennebaker, 2003). What is more, pronouns and adjectives (with both positive and negative connotations) are amongst the most commonly used textual elements in content analysis (Macnamara, 2003, p. 17) to analyse a variety of phenomena, including impression management. Baker and Kare (1992), Kohut and Segars (1992), Rutherford (2003), Clatworthy and Jones (2006), and Li (2008) use document length as a proxy for reading difficulty. Abrahamson and Park (1994), Abrahamson and Amir (1996), Smith and Taffler (2000), Lang and Lundholm (2000), Clatworthy and Jones (2003), Rutherford (2005), Henry (2006, 2008), Matsumoto et al. (2006), and Davis et al. (2008) use positive and negative keywords as a proxy for the enhancement of positive organisational outcomes (managerial optimism and pessimism). 10
  • 11. We therefore argue that the content categories used as proxies for self-presentational dissimulation can also be interpreted as indicators of managerial enhancement of positive organisational outcomes or managerial retrospective sense-making. Bloomfield (2008) puts forward a similar argument in his discussion of Li’s (2008) paper on impression management in the form of reading ease manipulation. He states that word and sentence length and document length may be interpreted as indicators of the complexity of the news to be described, rather than obfuscation by means of reading difficulty, with negative financial performance requiring more complex and detailed explanations than positive financial performance. 4. HYPOTHESES, DATA AND METHOD This section discusses the research questions, the research method, including sample selection, data sources used, measurement of the independent variables, and the statistical methods applied in analysing the data. 4.1 Hypotheses The use of impression management in a corporate reporting context has been found to be causally linked to various firm characteristics, including organisational outcomes, firm size, and industry sector classification. Research in social psychology suggests that the strength of organisational actors’ motivations to engage in impression management depends on (1) the goal-relevance of the impressions (including the maximisation of social and material outcomes, the maintenance and enhancement of self-esteem, and identity creation) (2) the value of the desired outcomes, and (3) the discrepancy between one’s desired and current social image (Leary and Kowalski, 1990). Negative organisational outcomes can thus be regarded as a trigger for organisational actors to engage in impression management. We expect firms with negative organisational outcomes to be more likely to present a public image of organisational performance which is inconsistent with the managerial view of organisational performance than firms with positive organisational outcomes. Therefore, we expect self-presentational dissimulation to be directly associated with negative organisational outcomes. H1a: Firms reporting negative organisational outcomes in their financial statements are more likely to engage in self-presentational dissimulation than firms reporting positive organisational outcomes. However, managers may use corporate annual report documents to present an accurate (i.e., consistent with an overall reading of the annual report), but favourable, view of organisational outcomes (enhancement of positive organisational outcomes). Thus, we expect managers to emphasise positive organisational outcomes, regardless of their financial performance. We express this hypothesis in the null form. H1b: There is no difference in impression management by means of enhancement of positive organisational outcomes between firms reporting positive organisational outcomes and firms reporting negative organisational outcomes in their financial statements. What is more, the accountability context of corporate annual reporting may prompt managers to engage in retrospective sense-making manifesting itself in “ex post explanations or restatements of organizational outcomes and events” (Aerts, 2005, p. 11
  • 12. 497). Under conditions of ex post accountability, we thus expect an increase of retrospective sense-making in the case of negative organisational outcomes. H1c: Firms reporting negative organisational outcomes in their financial statements are more likely to engage in retrospective sense-making than firms reporting positive organisational outcomes. The goal relevance of impressions also depends on the publicity of the individual’s behaviour and on the individual’s dependency on others for valued outcomes. Publicity is “a function of both the probability that one’s behavior will be observed by others and the number of others who might see or learn about it” (Leary and Kowalski, 1990, p. 38). If an individual depends on others for valued outcomes, the impressions that individuals make on others become more important and the individual’s motivation to engage in impression management becomes stronger. As large firms are more in the public eye than small firms in the sense that they have a higher analyst following and a wider media exposure, they may be more likely to present a public image of organisational outcomes inconsistent with the managerial view of organisational outcomes. Conversely, large firms are subject to greater scrutiny and are therefore more likely to be found out and sanctioned for engaging in self-presentational dissimulation and impression management (Abrahamson and Park, 1994). Therefore, we do not make any predictions concerning the direction of association with firm size. H2a: There is no difference in self-presentational dissimulation between firms of different sizes. H2b: There is no difference in impression management by enhancement between firms of different sizes. H2c: There is no difference in the sense-making activities of managers between firms of different sizes. We further assume that there is no difference in the impression management behaviour and the sense-making behaviour of firms belonging to different industries. H3a: There is no difference in self-presentational dissimulation between firms in different industries. H3b: There is no difference in impression management by enhancement between firms in different industries. H3c: There is no difference in the sense-making activities of managers between firms in different industries. 4.2 Population and sample The population from which the sample is selected comprises all UK domiciled companies listed on the London Stock Exchange on 30 April 2004 (1,983 companies). The aim of sample selection is to derive a sample comprising a variety of industries and firm sizes. The companies were first grouped into sectors, based on the Dow Jones Market Sector classifications. In order to generate a large enough sample, the three sectors with the highest number of companies were selected for analysis (Financial Services companies are excluded due to their unique features). The three resulting sectors are Consumer Cyclical (CYC; n = 360), Technology (TEC; n = 193), 12
  • 13. and Industrial (IDU; n = 331).3 An initial sample of 93 firms was then selected comprising 31 companies from each of the three industries. The initial sample size of 93 was chosen as sufficiently large to permit statistical testing. These were selected using systematic sampling to ensure heterogeneity of firm sizes. For this purpose, the companies in each industry sector were ranked according to size (end of year market capitalisation 2002 in £million) and sample companies were chosen at regular sampling intervals throughout the size ranges. The sampling interval is the ratio N/n, i.e., where N represents the population and n the desired sample size (i.e., 31) in each industry sector. The full selection process is documented in Table 1. Table 1: Sample selection Consumer Technology Industrial Total No. firms No. firms No. firms No. firms Total population in sector 360 193 331 884 Eliminations Market capitalisation not available/large (18) (5) (8) (31) change in market capitalisation Missing values (5) (17) (11) (33) Non-calendar years (3) (7) (7) (17) Total final population in sector 334 164 305 803 Sample selected 31 31 31 93 The sample size of 93 firms is small. Other than Li (2008), most prior papers in this field have small sample sizes, due to the labour-intensive process of collecting, preparing and analysing textual data. 4.3 Data sources and textual analysis software The annual report chairman’s statement is a tried and tested medium for the investigation of impression management in narrative corporate report sections (Jones, 1988; Smith and Taffler, 1992a, 1992b, 1995, 2000; Clatworthy and Jones, 2001, 2006; Sydserff and Weetman, 2002; Courtis, 1998, 2004a). Its relatively short length makes it particularly suitable for content analysis. The chairmen’s statements were obtained by downloading the 2002 annual reports in pdf format. These would have been the first annual reports post-Enron when financial reporting and the quality of accounting information were the subject of considerable public attention worldwide. After deleting photographs and their captions, images, charts, graphs, tables, forms of address (Dear shareholder), and greeting (Yours faithfully), the chairmen’s statements were converted into computer readable text format. 3 The industry classification Consumer Cyclical includes firms operating in the subsectors of advertising, entertainment and leisure, publishing, clothing and fabrics, etc.; Industrial includes firms operating in the subsectors of building materials, pollution control/waste management, electrical components and equipment, etc.; Technology includes firms operating in the subsectors of aerospace and defence, computers, office equipment, etc. 13
  • 14. We use Linguistic Inquiry and Word Count (LIWC), an automated text analysis program developed by psychologists for the purpose of analysing linguistic style, to measure self-presentational dissimulation. Its external validity has been extensively tested (Pennebaker and Francis, 1996). The program analyses written samples of text on a word-by-word basis and calculates the number of words that match pre-defined word categories which are then hierarchically subdivided into 70–80 dimensions (depending on the version of the software used) (see Pennebaker et al., 2007 for full details of how the software operates).4 This program has been used in numerous studies to examine linguistic manifestations of psychological processes and behaviour, such as personality characteristics of US presidential candidates (Slatcher et al., 2007), demographic differences, such as age and gender (Pennebaker and Stone, 2003), emotional issues, such as bereavement and depression (Gill and Oberlander, 2003; Pennebaker and King, 1999), and self-presentational dissimulation (Newman et al., 2003; Burgoon et al., 2003; Hancock et al., 2008). 4.4 Measurement of dependent variables Measurement of the three dependent variables in this research is presented below. 4.4.1 Self-presentational dissimulation We adapt a content analysis approach based on the linguistic style associated with self-presentational dissimulation developed by Newman et al. (2003). Research in psychology finds the texts of individuals who engage in deception to show the following linguistic characteristics: (1) They are shorter (DePaulo et al., 2003; Burgoon et al., 2003; Vrij et al., 2000), (2) they contain fewer self-references (Newman et al., 2003), (3) they contain fewer references to others (Newman et al., 2003), (4) they contain more positive emotion words (Newman et al., 2003; Burgoon et al., 2003; Zhou et al., 2004), (5) they contain more negative emotion words (Newman et al., 2003; DePaulo et al., 2003), and (6) they contain fewer words indicative of cognitive complexity (Newman et al., 2003). Deception goes hand-in- hand with providing less detail in the account of events. As the use of self-references in the form of first-person is a “subtle proclamation of one’s ownership of a statement” (Newman et al., 2003, p. 666), individuals engaged in deception avoid the use of self-references as a way of distancing themselves from their stories and to avoid taking responsibility for their behaviour. The increased use of emotion words is a reflection of the discomfort experienced when engaging in deception (Newman et al., 2003, p. 666). Finally, deception consumes cognitive resources which results in less complex stories (Newman et al., 2003, p. 666). This manifests itself, amongst others, in a less complex sentence structure, less causation words (e.g., because, cause, effect), and fewer words expressing the ability to think, learn and understand (e.g., think, know, consider). This is the first study applying Newman et al.’s (2003) content analysis approach in a corporate reporting context. Gupta and Skillicorn (2006, p. 2), who use the approach to analyse a large corpus of Enron email messages, find that “the model captures … messages in which there seems to be a dichotomy between the overt meaning of the email and the mindset of the sender”. They conclude that it captures ‘spin’, i.e., “the attempt by authors to convey something they themselves do not (quite) believe”. 4 For example, the word ‘optimistic’, falls into five of the 70-80 dimensions, namely ‘optimism’, ‘positive emotion’, ‘overall affect,’ ‘words longer than six letters’ and ‘adjective’. 14
  • 15. Newman et al.’s (2003) content analysis approach is based on the behaviour of individuals, whereas the content of corporate narrative documents is the result of decision behaviour of a group of people, primarily the firm’s management (Clarke and Murray, 2000). The assumption that the behaviour of individuals and groups of individuals is the same is open to question. For the six linguistic indicators of self-presentational dissimulation we make use of four dimensions from LIWC, (1) Word count (LIWC: log word count5), (2) positive emotion words (LIWC: positive emotion), (3) negative emotion words (LIWC: negative emotion), and (4) cognitive complexity (LIWC: cognitive processes). We then create custom dictionaries for the two remaining linguistic indicators, namely (5) self-reference (this custom dictionary contains three word categories - first person plural pronouns (i.e., we, us, our, ours, ourselves), the Group, and the respective company name), and (6) reference to others (this custom dictionary contains four words – industry, sector, competitor, and rival).6 Following Newman et al., (2003) and Slatcher et al., (2007) the measures for each indicator are subsequently converted to z scores. A z score is a standardised measure which is derived by considering the distance in terms of standard deviation from the mean of the raw score. The individual z scores are summed using the following algorithm: Self-presentational dissimulation = – zWord Count – zSelf-reference – zReference to others + zPositive Emotion + zNegative Emotion – zCognitive Complexity.7 We assume that the higher the score, the more likely it is that a company is portraying a public image of organisational outcomes which is inconsistent with the managerial view of organisational outcomes. Table 2 outlines the six linguistic indicators of self- presentational dissimulation for chairmen’s statements, their abbreviation, examples of their application in practice, data sources and measurement. 5 Because of the skewness in the number of words across firms and some extreme values we use the natural logarithm, rather than the raw word count. 6 It is not meaningful to combine the output for all six indicators of self-presentational dissimulation into a single score because first of all, they are on different scales, i.e., the Word Count measure is an absolute measure and the remaining variables are percentage measures. What is more, their direction of association is not in the same direction. 7 Z-scores for each linguistic indicator are calculated by subtracting the sample mean (µx) from each value (x) and then dividing by the standard deviation (σx), i.e. zx = (x - µx)/ σx. 15
  • 16. Table 2: Linguistic indicators of self-presentational dissimulation in chairmen’s statements Linguistic indicator Examples Data source Measurement 1. Word count ---- LIWC log of total word count in text 2. References to self 1st person plural: we, us, Custom dictionary % of total word our, ours, ourselves; the count in text Group; name of the company 3. References to others Industry, sector, Custom dictionary % of total word competitor(s), rival(s) count in text 4. Positive emotion words Exciting, win LIWC: Positive % of total word emotion count in text 5. Negative emotion words Difficult, disappointing, LIWC: Negative % of total word loss emotion count in text 6. Markers of cognitive Cognitive processes LIWC: Cognitive % of total word complexity processes count in text Note: LIWC: Linguistic Inquiry and Word Count, the content analysis program used in this study Table 3 provides the descriptive statistics for the six linguistic indicators and the summary z score for self-presentational dissimulation for our sample of UK chairmen’s statements. Its shows marked differences in mean values between positive emotion words (3.314%) and negative emotion words (0.857%). This suggests that, on average, chairman’s statements tend to contain four times as many positive emotion words (e.g., exciting, win) than negative emotion words (e.g., difficult, disappointing, loss). This has been referred to as the ‘Pollyanna effect’ (Hildebrandt and Snyder, 1981). However, only association tests can ascertain whether this prevalence to ‘enhance the story’ (Courtis, 2004a, p. 293) occurs regardless of financial performance. Table 3: Descriptive statistics of linguistic indicators of self-presentational dissimulation Variable N Mean Median StDev Minimum Maximum Q1 Q3 1. Word count (absolute total number) 93 823 806 1.876 161 3,801 530 1,278 1. Word count (natural log total words) 93 6.713 6.692 0.629 5.081 8.243 6.273 7.153 2. References to self (%) 93 3.692 3.800 1.460 0.600 7.770 2.785 4.775 3. References to self others (%) 93 0.240 0.190 0.256 0.000 1.460 0.000 0.355 4. Positive emotion words (%) 93 3.314 3.340 1.117 1.060 7.720 2.480 3.985 5. Negative Emotion words (%) 93 0.857 0.730 0.572 0.000 3.180 0.460 1.125 6. Markers of Cognitive Complexity (%) 93 3.430 3.390 0.891 0.000 5.760 2.960 3.850 Self-presentational dissimulation z score 93 -0.002 1.541 2.668 -6.726 7.905 -1.565 1.485 Key: % = % of total word count in text 4.4.2 Impression management by means of enhancement If managers use corporate narratives to provide useful incremental information, then positive organisational outcomes should be associated with the use of positive key 16
  • 17. words and negative organisational outcomes with the use of negative key words (Abrahamson and Amir, 1996; Henry, 2006; Davis et al., 2008). However, if managers use corporate annual report documents to enhance positive organisational outcomes, then we expect to see no difference in the use of positive key words between firms reporting positive organisational outcomes and firms reporting negative organisational outcomes (Smith and Taffler, 2000; Rutherford, 2005). We use the LIWC content categories of positive and negative emotion words which capture words with positive and negative connotations.8 4.4.3 Retrospective sense-making Sense-making is assumed to manifest itself in an increase in cognitive complexity and document length. Bloomfield (2008) uses document length as a proxy for cognitive complexity. We use both document length (word count) and the LIWC content category ‘cognitive processes’ which is characterised by causation and insight words (e.g., because, think, know). The linguistic indicators used as proxies for self-presentational dissimulation, impression management by means of enhancement, and retrospective sense-making (dependent variables), and their expected direction of association with organisational outcomes, are summarised in Table 4. Table 4: Dependent variable measures and predicted association with organisational outcomes Self-presentational Impression management Retrospective dissimulation (enhancement) sense-making (H1a, H2a, H3a) (H1b, H2b, H3b) (H1c, H2c, H3c) Association with negative organisational outcomes Linguistic indicator 1. Word count - Not applicable + 2. Self-reference - Not applicable Not applicable 3. Reference to others - Not applicable Not applicable 4. Positive emotion words + No difference Not applicable 5. Negative emotion words + + Not applicable 6. Cognitive complexity - Not applicable + 4.5 Data for independent variables Three independent variables are tested in this research: financial performance in terms of organisational outcomes, firm size, and industry classification. The database Thomson One Banker-Analytics is used to download all the financial variables from 1999 to 2002, including data for the financial performance variables (i.e., total assets, total sales, income before taxation and interest, the firm size variable (i.e., end of year market-capitalisation) and the Dow Jones industry classification. 8 Alternatively, if managers use corporate annual report documents to obfuscate negative organisational outcomes, then we expect to see no difference in the use of negative key words between firms reporting positive organisational outcomes and firms reporting negative organisational outcomes. 17
  • 18. 4.5.1 Organisational outcomes Four different measures that distinguish positive and negative organisational outcomes reported in the financial statements are used. Prior research predominantly focuses on firm-specific and transitory aspects of financial performance, most commonly positive/negative percentage change in earnings (Courtis, 1998; Subramanian et al., 1993). In this study, two measures based on assets and sales which capture more permanent aspects of financial performance in relation to the firm’s competitive environment are also used. Prior impression management research has used three categories of financial performance measures, namely (1) accounting measures that are predominantly percentage change in net income (Adelberg, 1979; Courtis, 1995, 1998, 2004a; Jones, 1988; Sydserff and Weetman, 2002; Rutherford, 2003; Li, 2008), (2) market-based measures (Cassar, 2001), and (3) bankruptcy/survival measures (Smith and Taffler, 1992a, b). Following Subramanian et al. (1993), Courtis (2004a) and Smith and Taffler (1992a, b), we treat financial performance as a dichotomous variable, i.e., either positive or negative organisational outcomes. We base these dummy variables on four accounting measures which reflect different types of organisational outcomes. These are summarised in Table 5. Profit or Loss indicates whether the firm’s income (before interest and taxation) is either positive or negative, taking the value of zero if an absolute net loss is reported and a value of one otherwise. In this context, it is generally assumed that managers normally seek to avoid reporting a loss (Hayn, 1995). Research in earnings management has provided substantial evidence concerning such benchmark beating in firms. In this study it is assumed that managers engage in self-presentational dissimulation and retrospective sense-making when expectations cannot be achieved. Earnings Increase or Decrease indicates whether the change in earnings between the two years in question (2001 and 2002) is either positive or negative. In this case, managers are assumed to seek to report results that improve upon last year’s performance (Burgstahler and Dichev, 1997; Degeorge et al., 1999). The variable takes a value of zero if there is a decrease in earnings, and a value of one otherwise. Annual earnings may be influenced by a number of non-contemporaneous factors. These would include corrections to past valuations and the prudent recognition of current value-increasing activities whose income effect is deferred until its eventual certain realisation in future periods. Therefore, we also consider a broader accounting- based indicator of performance that provides a global measure of current activities, i.e., sales. Revenue is a key measure of a firm’s economic activity. In prior research, firm performance has been operationalised as sales growth rate relative to its industry (Powell, 1996; Covey et al., 2006). Investment analysts use revenue to proxy the entity’s current level of economic activity relative to past levels, and with its competitors as part of their assessment of the firm’s financial performance. In this context, it is assumed that negative sales growth and lower sales growth than the firm’s competitors represent missed targets. Sales growth rate is reflected in the dummy variable Relative Sales Increase or Decrease, which is an indicator of either positive or negative growth in the total sales of a firm from 2001 to 2002, relative to the rate of change in output in the overall industry. The variable takes a value of zero if the percentage change in Sales is below the industry average, and one otherwise. 18
  • 19. Finally, Relative Firm Growth captures the longer-term growth of a firm relative to its industry by averaging the growth in both sales and total assets over a four year period (1999-2003) and then adjusting for the industry mean. This is also treated as a 0,1 indicator, in this case taking the value of zero if firm growth is below the industry average and one otherwise. Table 5: Measurement of organisational outcomes Proxy measure Definition Prior research (1) Profit / Loss 1 EBIT ≥ 0 in Year 1; Subramanian et al. (1993) 0 EBIT < 0 in Year 1 Courtis (2004a) Li (2008) (2) Earnings Increase 1 Positive change in EBIT Year 0 to Year 1 Subramanian et al. (1993) / Decrease 0 Negative change in EBIT Year 0 to Year 1 Courtis (2004a) (3) Relative Sales 1 Positive sales growth relative to industry from Year Powell (1996) Increase / Decrease 0 to Year 1 Covey et al. (2006) 0 Negative sales growth relative to industry from Year 0 to Year 1 (4) Relative Firm 1 Positive long-term growth averaged over sales and Current study Growth assets and compared to industry, four years from Year -2 to Year +1 0 Negative long-term growth averaged over sales and assets and compared to industry, four years from Year -2 to Year +1 Key: EBIT - Earnings Before Interest and Tax Table 6 shows the number of companies in the sample reporting positive and negative organisational outcomes across the four proxy outcomes measures. It can be seen that there is an approximate 3:2 split between the two groups across all four measures. Table 6: Categorisation of sample firms by organisational outcome Positive organisational Negative organisational Total outcome outcome No. firms No. firms No. firms (1) Profit or Loss 52 41 93 (2) Earnings Increase/Decrease 55 38 93 (3) Relative Sales Increase/Decrease 57 36 93 (4) Relative Firm Growth 59 34 93 4.5.2 Firm size Table 7 shows the descriptive statistics of firm size, measured as the natural logarithm of market capitalisation in 2002, for the whole sample. The market values themselves range from £0.164m to £6,124m with median value of £43.38m. 19
  • 20. Table 7: Descriptive statistics of firm size Variable N Mean Median StDev. Min Max Q1 Q3 Size (£m) 93 45.833 43.380 8.491 0.164 6,124.179 11.302 223.632 LogSize 93 3.825 3.770 2.139 -1.810 8.720 2.425 5.410 Size by industry (£m) Consumer 31 85.541 58.557 8.593 1.259 6124.179 13.874 601.845 Technology 31 16.827 22.874 6.639 0.164 749.945 5.641 47.942 Industrial 31 66.954 94.632 7.838 1.221 3261.688 7.614 242.257 4.5.3 Industry Impression management may be affected by the industry in which the company operates (Aerts, 2005). In order to control for variability in the three dependent variables across industries, the sample was divided into three broad industry sectors based on the Dow Jones Market Sector classifications (Consumer Cyclical, Technology, and Industrial). 4.6 Statistical analysis We use ordinary linear regressions to examine the relationship between the three dependent variables and firm characteristics. The specification of the model is as follows: (a) Self-presentational dissimulation (b) Impression = β0 + β1 (positive/negative organisational outcomes dummy) management + β2 (Firm size) + β3 (Industry sector dummies) + u1 (c) Retrospective (unexplained residual) sense-making 5. RESULTS We test the three hypotheses set out earlier on the relationship between (a) self- presentational dissimulation (i.e., the summary z-score), (b) impression management by means of enhancement, and (c) retrospective sense-making and (i) organisational outcomes, (ii) firm size, and (iii) industry. Table 8 presents the results of regressing the summary z-score on the four different measures of financial performance (Table 8, column 1). In all the regressions firm size and industry classification are included as control variables. Our findings do not support hypothesis H1a which predicts that firms reporting negative organisational outcomes engage self-presentational dissimulation which entails constructing a public image of managerial actions and events that is inconsistent with the way management views these actions and events. However, we find that the chairmen’s statement of firms operating in the Industrial sector use significantly less self-presentational dissimulation (for the four organisational measures the coefficients are respectively: -2.34**; -2.50**; -2.64***; -0.19) than firms operating in the Consumer Cyclical and the Technology sector, a finding that we cannot currently explain. 20
  • 21. In order to investigate the complementary hypotheses regarding managerial corporate annual reporting behaviour (in the form of impression management by means of enhancement and in the form of retrospective sense-making), we also regress each linguistic indicator on the four measures of financial performance separately (Table 8, columns 2-7).9 We find that firms which report negative organisational outcomes use significantly less positive emotion words (for the four organisational measures the coefficients are respectively: 2.69***; 2.89***; 0.68; 0.13) and significantly more negative emotion words (coefficients -2.79***; -2.99***; -3.26***; -4.55***) than firms which report positive organisational outcomes. This suggests that managers do not use corporate narrative annual report sections to present an inaccurate (i.e., at variance with an overall reading of the annual report) view of organisational outcomes, but rather to explain or reinforce “the impression created elsewhere by raw figures” (Courtis, 1995, p. 14).10 This finding supports hypothesis H1b which predicts no difference between impression management by means of enhancement between firms reporting positive and negative organisational outcomes. Further, the chairmen’s statements of firms reporting negative organisational outcomes are characterised by more linguistic indicators of cognitive complexity than those of firms reporting positive organisational outcomes (coefficients -3.51***; - 0.61; -2.10**; -3.13***). This suggests that explaining losses and negative sales growth and negative firm growth compared to competitors requires more cognitive resources. This manifests itself semantically in more causation words and grammatically in a more complex sentence structure than explaining profits, and positive sales growth and positive firm growth compared to competitors. This finding supports the retrospective sense-making hypothesis H1c. This suggests that in an annual reporting context characterised by “ex post accountability” (Aerts, 2005, p. 497), “overall financial performance [can] be conceived as a primary content variable around which (and not necessarily about which) a number of different accounting (and non-accounting) stories [can] be built” (ibid, p. 496). Thus, corporate annual report documents may not be the outcome of proactive, purposeful, and goal directed managerial decision-making (prospective rationality), but rather the result of retrospective sense-making (retrospective rationality) characterised by managers making “interpretive readings of an organisational situation” (Boland, 1993, p. 125) under conditions of accountability. This manifests itself in “ex post explanations or restatements of organizational outcomes and events” (Aerts, 2005, p. 497). In contrast to Bloomfield (2008), we find positive financial performance (in the form of sales increase and positive firm growth relative to sector average) to result in an increase in document length (measured as word count) (coefficients 2.92***; 2.04**). This suggests that firms which outperform their competitors in terms of sales and asset growth provide longer corporate narrative annual report documents than firms whose sales and assets growth is worse than the sector. Bloomfield (2008) regards 9 We also run the same regressions using the individual z-scores for the six linguistic indicators. The results are not reported, but are of a similar magnitude and statistical significance to those of the un- standardised linguistic indicators reported in Table 8 (columns 2-7). 10 It also refutes the ‘Pollyanna effect’ (Hildebrandt and Snyder, 1981, p. 6) which suggests that managers introduce positive bias into corporate narrative documents, irrespective of financial performance. 21
  • 22. descriptions of negative financial performance to be more complex and thus lead to an increase in document length. However, our results suggest the opposite, namely that managers have the tendency to enhance positive organisational outcomes by describing them in more detail than negative organisational outcomes. This finding contradicts the retrospective sense-making hypothesis H1c and supports the impression management by enhancement hypothesis H1b. Further, firms operating in the technology sector (coefficients 2.36**; 2.47**; 2.36**; 2.79***) and the industrial sector (coefficients 3.87***; 4.15***; 4.15***; 4.23***) also provide more cognitively complex chairmen’s statements than firms operating in the consumer cyclical sector. This may be an indication of the greater complexity of the subject matter compared with firms operating in the consumer cyclical sector. Thus, hypothesis H3c is not supported, with evidence of significant differences in use of the linguistic cognitive complexity indicator by industry sector. Further, we find the chairmen’s statements of large firms to contain more self- references (coefficients 4.13***; 4.26***; 4.18***; 4.13***), more positive emotion words (coefficients 1.35; 2.16**; 2.37**; 2.45**) and less negative emotion words (coefficients -1.40; -2.24**; -2.12**; -1.98**) than those of small firms. This suggests that large firms may have a greater tendency to use their corporate annual report documents as impression management vehicles by putting the best part of themselves into public view (Leary and Kowalski, 1990, p. 40) than small firms. Thus, our findings support hypothesis H2b. The increased use of the company name and the first person plural, combined with the tendency to use rather more words with positive than negative connotations, suggests that large firms may use their chairmen’s statements more for brand-building than small firms. In summary, our results suggest that firms do not use chairmen’s statements to create an impression at variance with an overall reading of the annual report (self- presentational dissimulation). We find that large firms are more likely to portray an accurate (i.e., consistent with an overall reading of the annual report), albeit favourable image of organisational outcomes. Further, we find that negative organisational outcomes do not prompt managers to engage in self-presentational dissimulation, but rather to engage in retrospective sense-making by means of “drawing together a series of events in order that they make sense in relation to one another” (Crossley, 2000, p. 535). This manifests itself linguistically in the form of a more complex grammatical sentence structure and more causation and insight words (e.g., because, think, know). 22
  • 23. Table 8: Association between self-presentational dissimulation, impression management, and retrospective sense- making and organisational outcomes (H1), firm size (H2) and industry sector (H3) (a) Self- Dependent presentational (b) Impression management (enhancement) (c) Retrospective variables dissimulation sense-making Dependent variable z-score Self- Reference Positive Negative Word Cognitive measures reference to others emotion Emotion count complexity Hypotheses tested (H1a, H2a, H3a) (H1b, H2b, H3b) (H1c, H2c, H3c) Positive / negative organisational outcomes = Profit or loss (1,0) Organisational 1.03 -0.13 -1.06 ***2.69 ***-2.79 1.48 ***-3.51 outcomes Firm size *-1.95 ***4.13 -0.36 1.35 -1.40 0.39 1.39 Sector: Constant **2.04 ***5.48 ***3.63 ***9.24 ***7.28 ***35.14 ***13.43 Technology (+/-) -1.04 0.24 -0.01 *-0.73 0.68 -0.53 **2.36 Industrial (+/-) **-2.34 **2.23 0.92 -0.68 0.90 -0.06 ***3.87 Adj. R2 0.050 0.164 -0.002 0.138 0.139 -0.002 0.239 Positive / negative organisational outcomes = Earnings Increase or Decrease (1,0) Organisational 0.11 0.97 -1.58 ***2.89 ***-2.99 0.86 -0.61 outcomes Firm size *-1.67 ***4.26 -0.59 **2.16 **-2.24 0.91 0.10 Sector: Constant **2.13 ***5.02 ***3.83 ***8.65 ***7.49 ***33.84 ***11.78 Technology (+/-) -1.12 0.27 0.03 *-1.89 0.83 -0.63 **2.47 Industrial (+/-) **-2.50 **2.28 1.10 -1.09 1.34 -0.27 ***4.15 Adj. R2 0.039 0.173 0.014 0.148 0.149 -0.0186 0.136 Positive / negative organisational outcomes = Sales Increase or Decrease Relative to Sector Average (1,0) Organisational **-1.98 1.30 0.65 0.68 ***-3.26 ***2.92 **-2.10 outcomes Firm size -1.33 ***4.18 -0.94 **2.37 ***-2.12 0.55 0.39 Sector: Constant ***2.86 ***4.84 ***3.05 ***8.81 ***7.65 ***34.19 ***12.44 Technology (+/-) -1.30 0.35 0.12 *-1.82 0.65 -0.44 **2.36 Industrial (+/-) ***-2.64 2.34 1.10 -1.00 1.19 -0.15 ***4.15 Adj. R2 0.0793 0.180 -0.010 0.072 0.163 0.064 0.1739 Positive / negative organisational outcomes = Firm Growth (4 years) Relative to Sector Average (1,0) Organisational **2.04 1.58 -0.61 0.13 ***-4.55 **2.04 ***-3.13 outcomes Firm size 0.67 ***4.13 -0.71 **2.45 **-1.98 0.67 0.60 Sector: Constant ***33.96 ***4.84 ***3.49 ***9.04 ***8.38 ***33.96 ***13.15 Technology (+/-) -0.78 0.15 0.11 *-1.88 1.23 -0.78 ***2.79 Industrial (+/-) -0.19 2.37 1.05 -1.03 1.20 -0.19 ***4.23 Adj. R2 0.019 0.187 -0.010 0.067 0.241 0.019 0.219 Note: This table shows the regression results of (a) self-presentational dissimulation on financial performance (column 1) and (b) the six linguistic indicators of self-presentational dissimulation on financial performance (columns 2-7). Self-presentational dissimulation = – zWord Count – zSelf-reference – zReference to others + zPositive Emotion + zNegative Emotion – zCognitive Complexity. Z-scores for each indicator are calculated by subtracting the sample mean (µx) from each value (x) and then dividing by the standard deviation (σx), i.e. zx = (x - µx)/ σx. Positive / negative organisational outcomes is a 0-1 dummy variable, defined as indicated in italics above each set of estimations. Firm size is the natural log of market value. The Consumer Cyclical sector is the reference category for the sector effects. *** Coefficient or test significant at the 1% level; ** Significant at the 5% level; * Significant at the 10% level. 23
  • 24. 6. SUMMARY AND CONCLUSION In this study we argue that the economic view of impression management is reductionist in the sense that it treats managerial corporate annual reporting behaviour as characterised exclusively by prospective rationality and driven by utility maximisation. As corporate reporting takes place in a social context, accounting research may benefit from the use of social psychology theories. We conceptualise impression management as a social bias caused by managers anticipating an inquiry by shareholders and stakeholders who evaluate their actions and decisions. This causes managers to counteract undesirable consequences of information releases by engaging in impression management. We employ a content analysis approach pioneered by psychology research which focuses on the linguistic indicators of the psychological processes underlying self-presentational dissimulation to analyse 93 UK chairmen’s statements of listed firms. Our results suggest that the accountability function of corporate reporting does not prompt managers to provide a public account of organisational outcomes which is inconsistent with how management may perceive them (self-presentational dissimulation), but to provide explanations of their decisions and actions as a way of making sense of them. This is in line with Aerts (2005) who finds that the accountability function of corporate annual reporting causes managers to engage in retrospective sense-making. Further, results suggest that impression construction in corporate annual report documents entails presenting an accurate (i.e., consistent with an overall reading of the annual report), albeit favourable view of the firm and financial performance. 6.1 Strengths and limitations of the paper This paper introduces a social psychology perspective to corporate annual reporting and impression management. We use psychology theories and apply a content analysis approach developed by psychology research for measuring deception. The content analysis method uses findings based on the behaviour of individuals (Newman et al., 2003). The assumption that the behaviour of individuals and groups of people, such as the firm’s management team, which tends to author corporate narrative reports (Clarke and Murray, 2000), is the same is open to question. Like any other quantitative content analysis approaches, the method used in this study combines the advantages of automatic generation of content scores, namely ease of application, objectivity, reliability, and speed, with psychological validity. However, the downside of this approach is that words are analysed regardless of their context. 6.2 Implications of the research The results suggest that corporate reporting is a more complex and multi-dimensional process than acknowledged by the prior literature. Corporate narrative documents may not only serve a vehicle for transmitting (biased) information and/or as a means of forging relationships with shareholders and stakeholders, but also to provide an account of organisational outcomes as a result of managerial actions and events. This confirms Gibbins et al. (1990, p. 130) findings that different disclosure positions, i.e., “the shared meanings and understandings of the role of disclosure among managers in a particular firm’ co-exist for different kinds of disclosures within the same firm. Thus, corporate annual reporting may not only be understood from a behavioural perspective involving managers responding to objectively determined stimuli inherent in the accountability framework, but also from a symbolic interaction perspective which involves managers retrospectively making sense of organisational outcomes 24
  • 25. and events. These positions are based on different views regarding the ontological nature of human behaviour and actions (Johnson et al., 2006) as either purposive or as interpretive. If the ontological status of human behaviour is regarded as purposive, then corporate reporting functions as “a technical device for coping with an objective world, rationally fostering efficiency, order and stability” (Covaleski et al., 1985, p. 278). Alternatively, if the ontological status of human behaviour is regarded as interpretive, then corporate reporting constitutes a symbolic activity during which managers engage in social reality creation and “in so doing, … give meaning to their ongoing stream of experience” (Boland and Pondy, 1983, p. 223). The sense-making aspect in corporate communication may be further investigating by comparing the way managerial actions, organisational outcomes, and events are portrayed in more immediate communication vehicles, such as corporate press releases, takeover documents, and prospectuses, and in corporate narrative documents which serve an accountability function, such as corporate annual report documents. 6.3 Concluding comment Accounting researchers tend to view corporate report documents primarily though the lens of economics. This leads to a reductionist view of corporate reporting and impression management as characterised by prospective rationality and driven by utility maximisation. This paper provides a social psychology perspective which puts the accountability context of corporate reporting at the centre of analysis. Conditions of ex post accountability may result in impression motivation arising from the managerial anticipation of the feedback effects of information and/or give rise to the retrospective framing of organisational outcomes. Our findings suggest that impression construction does not involve a disparity between managerial views of organisational performance and the view portrayed publicly in corporate reports (self- presentational dissimulation). Rather, impression construction entails presenting an accurate (i.e., consistent with an overall reading of the annual report), albeit favourable, view of the firm. Further, corporate annual report sections may not be primarily used to shape outsiders’ perceptions of organisational outcomes, but rather, to construct an account of organisational outcomes. In this respect, corporate narratives, like conventional narratives, such as stories as myths, may serve to “organise our experience and our memory of human happenings” (Bruner, 1991, p. 4). 25
  • 26. References Abrahamson, E. and Amir, E. (1996), “The information content of the president’s letter to shareholders”, Journal of Business Finance and Accounting, Vol. 23 No. 8, pp. 1157-1182. Abrahamson, E. and Park, C. (1994), “Concealment of negative organizational outcomes: an agency theory perspective”, Academy of Management Journal, Vol. 37 No.5, pp. 1302-1334. Adelberg, A.H. (1979), “Narrative disclosures contained in financial reports: means of communication or manipulation’, Accounting and Business Research, Vol. 10 (Summer), pp. 179-189. Aerts, W. (1994), “On the use of accounting logic as an explanatory category in narrative accounting disclosures”, Accounting, Organizations and Society, Vol. 19 No. 4/5, pp. 337-353. Aerts, W. (2001), “Inertia in the attributional content of annual accounting narratives”, The European Accounting Review, Vol. 10 No. 1, pp. 3-32. Aerts, W. (2005), “Picking up the pieces: impression management in the retrospective attributional framing of accounting outcomes”, Accounting, Organizations and Society, Vol. 30, pp. 493-517. Allport, G.W. (1954). The historical background of social psychology. In G. Lindzey, and E. Aronson, (Eds.), Handbook of Social Psychology, Vol. 1 No. 3, pp. 1-46. Baird, J.E. and Zelin, R.C. (2000), “The effects of information ordering on investor perceptions: An experiment utilizing presidents’ letters”, Journal of Financial and Strategic Decisions, Vol. 13 No. 3, pp. 71-81. Baker, H.E. and Kare, D.D. (1992), “Relationship between annual report readability and corporate financial performance”, Management Research News, Vol. 15 No. 1, pp. 1-4. Beattie, V. and Jones, M. (2000), “Impression management: the case of inter-country financial graphs”, Journal of International Accounting, Auditing and Taxation, Vol. 9 No.2 (June), pp.159-183. Bettman, J. and Weitz, B. (1983), “Attributions in the boardroom: causal reasoning in corporate annual reports”, Administrative Science Quarterly, Vol. 28, pp. 165- 183. Bloomfield, R. (2008), “Discussion of ‘Annual report readability, current earnings, and earnings persistence’”, Journal of Accounting and Economics, Vol. 45 Nos. 2-3, pp. 248-252. Boland, R.J. (1993), “Accounting and the interpretive act”, Accounting, Organizations and Society, Vol. 18 No. 2/3, pp. 125-146. Boland, R.J., and Pondy, L.R. (1983), “Accounting in organizations: a union of natural and rational perspectives,” Accounting Organizations and Society, Vol. 8 No. 2/3, pp. 223–234. Bruner, J. (1991), “The narrative construction of reality”, Critical Inquiry, Vol. 18, pp. 1-21. Burgoon, J.K., Buller, D.B., Floyd, K., and Grandpre, J. (1996), “Deceptive realities: sender, receiver, and observer perspectives in deceptive conversations”, Communication Research, Vol. 23, pp. 724-748. Burgoon, J.K., Bliar, J.P., Qin, T., Nunamaker, J.F. (2003), “Detecting deception through linguistic analysis”, Intelligence and Security Informatics, No. 2665 in Lecturer Notes in Computer Science, pp. 91-101. 26
  • 27. Burgoon, J.K. and Nunamaker, J.F. Jr., eds. (2004), “Toward computer-aided support for the detection of deception”, Group Decision and Negotiation, Vol. 13, pp. 1- 4. Burgstahler, D. and Dichev, I. (1997), “Earnings management to avoid earnings decreases and losses”, Journal of Accounting and Economics, Vol. 24, pp. 99- 126. Campbell, R.S. and Pennebaker, J.W. (2003), “The secret life of pronouns: flexibility in writing style and physical health”, Psychological Science, Vol. 14, pp. 60-65. Carlson, J.R., George, J.F., Burgoon, J.K., Adkins, M. and White, C.H. (2004), “Deception in computer-mediated communication”, Group Decisions and Negotiation, Vol. 13, pp. 5-28. Cassar, G. (2001), “Self-serving behaviour and the voluntary disclosure of capital market performance”, Accounting Research Journal, Vol.14 No.2, pp. 126-137. Cenesizoglu, T. and Timmermann, A.G. (2008), “Is the distribution of stock returns predictable?” Available at SSRN: http://ssrn.com/abstract=1107185. Clarke, G. and Murray, L.W. (2000), “Investor relations: perceptions of the annual statement”, Corporate Communications: An International Journal, Vol. 5 No. 3, pp. 144-151. Clatworthy, M. and Jones, M.J. (2001), “The effect of thematic structure on the variability of annual report readability”, Accounting, Auditing and Accountability Journal, Vol. 14 No. 3, pp. 311-326. Clatworthy, M. and Jones, M.J. (2003), “Financial reporting of good news and bad news: evidence from accounting narratives”, Accounting and Business Research, Vol. 33 No. 3, pp. 171-185. Clatworthy, M. and Jones, M.J. (2006), “Differential patterns of textual characteristics and company performance in the chairman’s statement”, Accounting, Auditing, and Accountability Journal, Vol. 19 No. 4, pp. 493-511. Courtis, J.K. (1995), “Readability of annual reports: Western versus Asian evidence”, Accounting, Auditing and Accountability Journal, Vol. 8 No. 2, pp. 4-17. Courtis, J.K. (1998), “Annual report readability variability: tests of the obfuscation hypothesis”, Accounting, Auditing and Accountability Journal, Vol. 11 No. 4, pp. 459-471. Courtis, J.K. (2004a), “Corporate report obfuscation: artefact or phenomenon?”, British Accounting Review, Vol. 36 No. 3, pp. 291-312. Courtis, J.K. (2004b), “Colour as visual rhetoric in financial reporting”, Accounting Forum, Vol. 28 No. 3, pp. 265-281. Covaleski, M.A., Dirsmith, M.W. and Jablonski, S. F. (1985), “Traditional and emergent theories of budgeting: An empirical analysis,” Journal of Accounting and Public Policy, Vol. 4 No. 4, pp. 277-300. Covey, J.G., Green, K.M. and Slevin, D.P. (2006), “Strategic process effects on the entrepreneurial orientation-sales growth rate relationship”, Entrepreneurship Theory & Practice, Vol. 30 No 1, pp. 57-81. Crossley, M.L. (2000), “Narrative psychology, trauma and the study of self/identity”, Theory Psychology. Vol. 10, pp. 527-546. Davis, A.K., Piger, J.M. and Sedor, L.M. (2008), “Beyond the numbers: An analysis of optimistic and pessimistic language in earnings press releases”, Working paper, April 2008, Available at Social Science Research Network (SSRN), http://ssrn.com/abstract=875399. Degeorge, F., Patel, J., Zeckhauser, R. (1999), “Earnings management to exceed thresholds”, Journal of Business, Vol. 72 No. 1, pp. 1-33. 27
  • 28. DePaulo, B.M., Lindsay, J.J., Malone, B.E., Muhlenbruck, L., Charleton, K. and Cooper, H. (2003), “Cues to deception”, Psychological Bulletin, Vol. 129, pp. 74-112. Elliott, W.B. (2006), “Are investors influenced by pro forma emphasis and reconciliations in earnings announcements?”, The Accounting Review, Vol. 81 No. 1, pp. 113-133. Frederickson, J.R. and G.S. Miller (2004), “The effects of pro forma earnings disclosures on analysts’ and nonprofessional investors’ equity valuation judgments”, The Accounting Review, Vol. 79 No. 3, pp. 667-686. Frink, D.D. and Ferris, G.R. (1998), “Accountability, impression management, and goal setting in the performance evaluation process”, Human Relations, Vol. 51 No. 10, pp. 1259-1283. Gibbins, M., Richardson, A. and Waterhouse, J. (1990), “The management of corporate financial disclosure: opportunism, ritualism, policies and processes”, Journal of Accounting Research, Vol. 28 No. 11, pp. 121-143. Gill, A. and Oberlander, J. (2003), “Perception of email personality at zero acquaintance: extraversion takes care of itself; Neuroticism is a worry”, Proceedings of the 25th Annual Conference of the Cognitive Science Society, Hillsdale, New Jersey, LEA, pp. 363-368. Godfrey, J., Mather, P. and Ramsay, A. (2003), “Earnings and impression management in financial reports: the case of CEO changes”, Abacus, Vol. 39 No. 1, pp. 95-123. Gupta, S. and Skillicorn, D.B. (2006), “Improving a textual deception detection model”, Proceedings of the 2006 conference of the Center for Advanced Studies on Collaborative Research, http://portal.acm.org/citation.cfm?id=1189005. Hancock, J.T., Curry, L.E., Goorha, S. and Woodworth, M. (2008), “On lying and being lied to: a linguistic analysis of deception in computer-mediated communication, Discourse Processes, Vol. 45 No 1, pp. 1-23. Hayn, C. (1995), “The information content of losses”, Journal of Accounting and Economics, Vol. 20, pp. 125-153. Healy, P.M. and Wahlen, J.M. (1999). ‘A review of the earnings management literature and its implications for standard setting’. Accounting Horizons, 13(4): 365-383. Heider, F. (1958), The Psychology of Interpersonal Relations, Wiley, New York. Henry, E. (2006), “Market reaction to verbal components of earnings press releases: Event study using a predictive algorithm”, Journal of Emerging Technologies in Accounting Vol. 3, pp. 1-19. Henry, E. (2008), “Are investors influenced by how earnings press releases are written?”, Journal of Business Communication, Vol. 45 No. 4, pp. 363-407. Hildebrandt, H.H. and Snyder, R. (1981), “The Pollyanna hypothesis in business writing: initial results, suggestions for research,” Journal of Business Communication, Vol. 18 No. 1, pp. 5-15. Hooghiemstra, R. (2000), “Corporate communication and impression management – New perspectives why companies engage in corporate social reporting”, Journal of Business Ethics, Vol. 27, pp. 55-68. Johnson, P., Buehring, A. Cassell, C., and Symon, G. (2006), “Evaluating qualitative management research: towards a contingent criteriology,” International Journal of Management Reviews, Vol. 8 No. 3, pp. 131-156. 28
  • 29. Jones, M.J. (1988), “A longitudinal study of the readability of the chairman’s narratives in the corporate reports of a UK company”, Accounting and Business Research, Vol. 18 No. 72, pp. 297-306. Jones, E.E. and Davis, K.E. (1965), “From acts to dispositions: the attribution process in person perception”, In Berkowitz, L. (Ed.) Advances in Experimental Social Psychology, Vol. 2, New York, Academic Press, pp. 219-226. Kelley, H.H. (1967), “Attribution in social psychology”, Nebraska Symposium on Motivation, Vol. 15, pp. 192-238. Knee, C.R. and Zuckerman, M. (1996), “Causality orientations, failure and achievement”, Journal of Personality, Vol. 62, pp. 321-346. Kohut, G.F. and Segars, A.H. (1992), “The president's letter to stockholders: and examination of corporate communication strategy”, The Journal of Business Communication, Vol. 29 No. 1, pp. 7-21. Koonce, L. and Mercer, M. (2005), “Using psychology theories in archival financial accounting research”, Journal of Accounting Literature, Vol. 24. Krische, S.D. (2005), “Investors’ evaluations of strategic prior-period benchmark disclosures in earnings announcements”, The Accounting Review, Vol. 80 No. 1, pp. 243-268. Lang, M. and Lundholm, R. (2000), “Voluntary disclosure and equity offerings: Reducing information asymmetry or hyping the stock?”, Contemporary Accounting Research, Vol. 17 No. 4, pp. 623-662. Leary, M.R., Kowalski, R.M. (1990), “Impression management: a literature review and two-component model”, Psychological Bulletin, Vol. 107 No.1, pp. 34-47. Leary, M.R., Tchividjian, L.R. and Kraxberger, B.E. (1994), “Self-presentation can be hazardous to your health: impression management and health risk”, Health Psychology, Vol. 13 No. 6, pp. 461-470. Letza, S., Kirkbride, J., Sun, X. and Smallman, C. (2008), “Corporate governance theorising: limits critics, and alternatives”, International Journal of Law and Management, Vol. 50 No.1, pp. 17-32. Li, F. (2008), “Annual report readability, current earnings, and earnings persistence”, Journal of Accounting and Economics, Vol. 45 No. 2-3, pp. 221-247. Macnamara, J. (2003), “Media content analysis: Is uses, benefits, and best practice methodology”, http://www.masscom.com.au/book/papers/media_content.html. Mather, P., Ramsay, A. and Steen, A. (2000), “The use and representational faithfulness of graphs in IPO prospectuses”, Accounting, Auditing and Accountability Journal, Vol. 13 No.1, pp. 65-83. Matsumoto, D., Pronk, M. and Roelofsen, E. (2006), Do analysts mitigate optimism by management? Working paper, University of Washington. Merkl-Davies, D.M. and Brennan N.M. (2007), ‘Discretionary disclosure strategies in corporate narratives: incremental information or impression management?’, Journal of Accounting Literature, Vol. 26, pp. 116-196. Mouck, T. (1995), “Financial reporting, democracy and environmentalism: a critique of the commodification of information”, Critical Perspectives on Accounting, Vol. 6, pp. 535-553. Newman, M.L., Pennebaker, J.W., Berry, D.S. and Richards, J.M. (2003), “Lying words: predicting deception from linguistic styles”, Personality and Social Psychology Bulletin, Vol. 29 No.5, pp. 665-675. Pennebaker, J.W., Chung, C.K., Ireland, M. Gonzales, A. and Booth, R.J. (2007), The LIWC2007 Application, http://www.liwc.net/liwcdescription.php (accessed 10 February 2010). 29