SlideShare a Scribd company logo
1 of 24
Fruitfly Tumors A range of sizes and morphologies observed: Microtumors Ubc9 -  dif -   dl - Ubc9 - - Microtumor Microtumor Microtumor Aggregate Cluster Aggregate Small Microtumor Fat Body 419 Projection >10,000   m 2 Estimated volume:  0.5 mm 3  -1 mm 3 932 513
(Chiu et al 2005) :  dUbc9 negatively regulates the Toll-NF-nB pathways in larval hematopoiesis and drosomycin activation in Drosophila. Developmental Biology.  Genotype  Number of Larvae Ubc9-(transheterozygote) 58 Bc + Ubc9- 55 95% CI Odds Ratio: NS>5% 0.85- 1.25 Ubc9-   Aggregates + Tumors Aggr Tumors Totals 932 513 419 %   55.04% 44.96% Bc  Ubc9/+ Ubc9-   Aggregates + Tumors Aggr Tumors Totals 874 262 612 % 29.98% 70.02%
Bc allele background FlyBase   GBrowse  modENCODE  GBrowse   Gene Dmelc FB2009_07, released August 10, 2009  General Information Symbol Dmelc Species D. melanogaster Name Black cells Annotation symbol CG5779 Feature type  protein_coding_gene  FlyBase ID FBgn0000165 Gene Model Status  Current  Stock availability  68 publicly available  Genomic Location Chromosome (arm) 2R Recombination map 2-80.6 Cytogenetic map 54F6-54F6 Sequence location 2R:13,774,718..13,777,477 [-] Genomic Maps The gene Black cells is referred to in FlyBase by the symbol Dmelc (CG5779, FBgn0000165). It is a protein_coding_gene from Drosophila melanogaster. Its sequence location is  2R:13774718..13777477 . It has the cytological map location  54F6 . Its molecular function is described as: monophenol monooxygenase activity; oxygen transporter activity; oxidoreductase activity. It is involved in the biological processes: defense response; melanization defense response; scab formation; response to symbiont; response to wounding; transport.  10 alleles are reported . The phenotypes of these alleles are annotated with: crystal cell; hemocyte; hemolymph; lymph gland; adult; procrystal cell; lamellocyte; posterior lymph gland pair. It has  one annotated transcript  and  one annotated polypeptide .  Takehana, A., Katsuyama, T., Yano, T., Oshima, Y., Takada, H., Aigaki, T., Kurata, S. (2002). Overexpression of a pattern-recognition receptor, peptidoglycan-recognition protein-LE, activates imd/relish-mediated antibacterial defense and the prophenoloxidase cascade in Drosophila larvae.   Proc. Natl. Acad. Sci. U.S.A. 99(21): 13705--13710.   Ye, Y.H., Chenoweth, S.F., McGraw, E.A. (2009). Effective but costly, evolved mechanisms of defense against a virulent opportunistic pathogen in Drosophila melanogaster.   PLoS Pathog. 5(4): e1000385.
Comparative Analysis of Area limits 25K to 300K and 300K to 600K in both Genotypes :  Higher Maximum Likelihood mean, variances and wider confidence interval of 25K-300K shows faster mitosis and cell death than that of 300K-600K. Maximum Likelihood (ML) Estimates of BC-All (BC-lwr) and lwr43-5 All BC-All Mean Tumors Variance Tumors 95% Confidence Interval 25K-300K 4.86 0.85 1.22  to 1.84 300K-600K 1.67 0.02 1.11 to 1.20 lwr43-5 All Mean Tumors Variance Tumors 95% Confidence Interval 25K-300K 4.5 0.97 1.10  to 1.88 300K-600K 1.27 0.02 1.05 to 1.12
25K-300K Area Size Tumor Log-Normal Distribution in BC-All and Recessive Genotypes (number of micro tumor found or frequency on Y-axis; every 25K scale)
PROBLEM STATEMENT Tumor size data from non-random and correlated data. Samples were prepared for 8 days and scored on 9 th  day- cumulative effects on frequencies of BC-All and recessive (lwr-) Area size Units between 25k to 600k  size  distributions?  Effects of new VS experienced PhD student on data collection?  612 VS 419. This difference is not statistically significant (P>  5%). EXPECTED frequency higher at all area size for Semidominant gene in the hypothetical Y-axis. Does not have a pattern to quantify by a Dynamical simulation  equations- tried 100’s of published math methods…. Sample size is ONLY  48 rows of  Tumor Frequency data!
ASA 10/23/2009 Minneapolis Presentation  Predictive Modeling, Mathematical Simulations and Data Mining: Making Sense Out of Really Difficult Cancer Data. Navin K. Sinha, MS (Statistical Genetics), MS (Biometrics) and MBA (Decision Sciences) ,[object Object],[object Object],[object Object],[object Object],[object Object]
Analysis of Raw data showing V-shape residual and compensatory response by 25K area limit (R-square =  0.36 VS 0.76 VS 0.86 ).  Data Analysis needs Dynamical Simulations, Reverse Engineering Algorithms and Simulated OLS Regression.
LITERATURE REVIEW & METHODS Dynamical Simulation by Taylor’s Power Series like Math equation:  A . Y= x 1  + x 2 +x 3  + x 4 .  Reference : “Lee Specter and Shawn Luke- Culture Enhances the Evolvability of Cognition. 1996. In Proceedings of the Eighteenth Annual Conference of the Cognitive Science Society. “ According to Specter and Luke, special type of Dynamical Simulation is Symbolic Regression-  “ to produce a function, in symbolic form, that fits a provided set of data points. For each element of a set of (x,y) points, the function should map the x value to an appropriate y value. This sort of problem faced by a scientist who has obtained a set of experimental data points and suspects that a simple formula will suffice to explain the data ” .  This method  is a standard example from Dynamical simulation and used in many different types of biological systems (Koza, J.R. 1992.  Genetic Programming: on  the programming of computers by means of  natural selection. Cambridge, MA, MIT Press).
B.  Reverse Engineering Prediction by  the equation of  y = 4.251a2 + ln(a2) + 7.243ea-  CF . ( Candida Ferreira. 2003.  www.gene-expression-programming.com/author.asp- equation 3.2   ) Ekaterina Vladislavleva- June 2008- PhD Theses Models to exhibit not only required properties, but also additional convenient properties like compactness, small number of constants, etc. It is important, that generated models are interpretable and transparent, in order to provide additional understanding of the underlying system or process.
Modified Candida Ferreira Method (Equation 3.2): Correction Factor (CF)- Genetic Fitness not as Underestimated: Consistency in Results.  ,[object Object],[object Object]
Reverse Engineering of Polynomial Models of Gene Regulatory Networks (Visual Analytics = Meta Modeling =  what are the ranges of input variables that cause the response to take certain values, not necessarily optimal?  )   Dr. Eduardo Mendoza    Mathematics Department    Center for NanoScience  Ludwig-Maximilians-University  Munich, Germany   [email_address]      eduardom@math.upd.edu.ph  Brody et al .  October 1, 2002:  PNAS : Significance and Statistical Errors in the analysis of DNA microarray data. 99 (20): 12975-12978 ( Even for Lorentizian like distributions, median of ratios provide distributions more Gaussian like ).
Reverse Engineering of Systems Systems identification  in Engineering: goal is to construct a system with prescribed dynamical properties  In  Systems Biology,  one is interested in identifying as closely as possible a unique biological system that has been observed experimentally In both cases: sparsity of available measurements will leave the system  underdetermined  (GIGO- Uninterpretable)
Mathematical Genetics Concepts ,[object Object],[object Object],[object Object]
Average Effects of Gene Substitution:   І 7.333 І ; very close to equation 3.2 of Candida Ferreira  (frequency of 0= 7.243 x12= 86.916 VS 7.333x12=88.0).  ,[object Object]
A . “Operon or Tumor Gene Expression occurs in a deterministic way from 25K to 300K area limits, and hence would have high survival probability”. This hypothesis indicates that there are conserved Protein motifs which generates various Brain Tumor sizes in Fruit fly in predetermined frequencies. Thus, micro-tumors counted (frequency) for lower size limits can be predicted by least non-linear mathematical and statistical equations .  B . “Log-Normal distribution arose due to compensatory response by lowest size distribution over the next few  micro-tumor classes”. If  the number of  micro-tumors counted for 25K area size is at the expense of next few, then a Log-Normal Distribution can be assured . Log-Normal Distribution explanation
Leo Breiman:  Statist. Sci.  Volume 16, Issue 3 (2001), 199-231.    Statistical Modeling: The Two Cultures Abstract There are two cultures in the use of statistical modeling to reach conclusions from data. One assumes that the data are generated by a given stochastic data model.  The other uses algorithmic models and treats the data mechanism as unknown.  The statistical community has been committed to the almost exclusive use of data models. This commitment has led to irrelevant theory, questionable conclusions, and has kept statisticians from working on a large range of interesting current problems.  Algorithmic modeling, both in theory and practice, has developed rapidly in fields outside statistics. It can be used both on large complex data sets and as a more accurate and informative alternative to data modeling on smaller data sets. If our goal as a field is to use data to solve problems, then we need to move away from exclusive dependence on data models and adopt a more diverse set of tools .
A.  Analysis of size distribution of lwr (-) microtumors from 58 animals Projection >10,000   m 2 ; Estimated volume: 0.5 mm 3  -1 mm 3 Taylor series: y = x 1  + x 2 +x 3  + x 4   Area Limit    Simulated Frequency 100,000    -01 (1) 200,000    +01 (2) 275,000     -02  (3)   MLE:25k-300k Mean=4.5 Tumors Variance=0.97 Tumors CI= 1.10-1.88 Tumors MLE: 300k-600k Mean= 1.27  Tumors Variance= 0.02  Tumors CI= 1.05-1.12 Tumors
[object Object],[object Object],[object Object],[object Object],[object Object],[object Object],(1 )  THE PATTERN OF SIZE DISTRIBUTION OF SMALL TUMORS IN BOTH GENOTYPES SUGGESTS THAT MITOSIS IS DRIVING TUMORGENESIS.  (2)  CELL DEATH CONTRIBUTES TO SHIFTING TUMOR SIZE DISTRIBUTION-AS MORE CELLS DIE FROM COMPETITION, MORE SMALL TUMOR CELLS  WERE CREATED TO FILL VACANT SPACE.
Ekaterina  Vladislavleva- PhD: JUNE 2008  Both measured and simulated data are very often corrupted by noise, and in case of real measurements can be driven by a combination of both measured and unmeasured input variables, empirical models should not only accurately predict the observed response, but also have some extra generalization  capabilities. The same requirement holds for models developed on simulated data. Models to exhibit not only required properties, but also additional convenient properties like compactness, small number of constants, etc. It is important, that generated models are interpretable and transparent, in order to provide additional understanding of the underlying system or process.
VISUAL ANALYTICS:  Meta Modeling : No Plateau Observed! Genetic Fitness keeps increasing-DNA structural similarity is NOT Functional Similarity. ,[object Object],[object Object]
B . COMPENSATORY RESPONSE HYPOTHESES: BRODY et. al.  “Even for Lorentizian like distributions, median of ratios provide distributions more Gaussian like” ,[object Object],[object Object],[object Object],[object Object],[object Object],[object Object],[object Object],[object Object],[object Object],[object Object],[object Object],[object Object],[object Object]
B . COMPENSATORY RESPONSE HYPOTHESES… ,[object Object],[object Object],[object Object],[object Object],[object Object],[object Object],[object Object],[object Object],[object Object],[object Object],[object Object],[object Object],[object Object],[object Object],[object Object],[object Object],[object Object],[object Object],[object Object],[object Object],[object Object],[object Object],[object Object],[object Object]
COMPENSATORY RESPONSE HYPOTHESES… ,[object Object],[object Object],[object Object],[object Object],[object Object],[object Object],[object Object],[object Object],[object Object],[object Object],[object Object],[object Object],[object Object],[object Object],[object Object],[object Object],[object Object],[object Object],[object Object],[object Object],[object Object],[object Object],[object Object],[object Object]

More Related Content

What's hot

Back to Basics: Using GWAS to Drive Discovery for Complex Diseases
Back to Basics: Using GWAS to Drive Discovery for Complex DiseasesBack to Basics: Using GWAS to Drive Discovery for Complex Diseases
Back to Basics: Using GWAS to Drive Discovery for Complex DiseasesGolden Helix Inc
 
Qtl analysis and its mapping
Qtl analysis and its mappingQtl analysis and its mapping
Qtl analysis and its mappingVikas Verma
 
NetBioSIG2014-Talk by Traver Hart
NetBioSIG2014-Talk by Traver HartNetBioSIG2014-Talk by Traver Hart
NetBioSIG2014-Talk by Traver HartAlexander Pico
 
Mixed Models: How to Effectively Account for Inbreeding and Population Struct...
Mixed Models: How to Effectively Account for Inbreeding and Population Struct...Mixed Models: How to Effectively Account for Inbreeding and Population Struct...
Mixed Models: How to Effectively Account for Inbreeding and Population Struct...Golden Helix Inc
 
Association mapping
Association mappingAssociation mapping
Association mappingNivethitha T
 
Reconstruction and analysis of cancerspecific Gene regulatory networks from G...
Reconstruction and analysis of cancerspecific Gene regulatory networks from G...Reconstruction and analysis of cancerspecific Gene regulatory networks from G...
Reconstruction and analysis of cancerspecific Gene regulatory networks from G...ijbbjournal
 
MAGIC :Multiparent advanced generation intercross and QTL discovery
MAGIC :Multiparent advanced generation intercross and  QTL discovery MAGIC :Multiparent advanced generation intercross and  QTL discovery
MAGIC :Multiparent advanced generation intercross and QTL discovery Senthil Natesan
 
Clustering Approaches for Evaluation and Analysis on Formal Gene Expression C...
Clustering Approaches for Evaluation and Analysis on Formal Gene Expression C...Clustering Approaches for Evaluation and Analysis on Formal Gene Expression C...
Clustering Approaches for Evaluation and Analysis on Formal Gene Expression C...rahulmonikasharma
 
BRITEREU_finalposter
BRITEREU_finalposterBRITEREU_finalposter
BRITEREU_finalposterElsa Fecke
 
Genome wide association studies seminar
Genome wide association studies seminarGenome wide association studies seminar
Genome wide association studies seminarVarsha Gayatonde
 
Analisis de la expresion de genes en la depresion
Analisis de la expresion de genes en la depresionAnalisis de la expresion de genes en la depresion
Analisis de la expresion de genes en la depresionCinthya Yessenia
 

What's hot (20)

Back to Basics: Using GWAS to Drive Discovery for Complex Diseases
Back to Basics: Using GWAS to Drive Discovery for Complex DiseasesBack to Basics: Using GWAS to Drive Discovery for Complex Diseases
Back to Basics: Using GWAS to Drive Discovery for Complex Diseases
 
Qtl analysis and its mapping
Qtl analysis and its mappingQtl analysis and its mapping
Qtl analysis and its mapping
 
Poster
PosterPoster
Poster
 
NetBioSIG2014-Talk by Traver Hart
NetBioSIG2014-Talk by Traver HartNetBioSIG2014-Talk by Traver Hart
NetBioSIG2014-Talk by Traver Hart
 
Mixed Models: How to Effectively Account for Inbreeding and Population Struct...
Mixed Models: How to Effectively Account for Inbreeding and Population Struct...Mixed Models: How to Effectively Account for Inbreeding and Population Struct...
Mixed Models: How to Effectively Account for Inbreeding and Population Struct...
 
Association mapping
Association mappingAssociation mapping
Association mapping
 
Reconstruction and analysis of cancerspecific Gene regulatory networks from G...
Reconstruction and analysis of cancerspecific Gene regulatory networks from G...Reconstruction and analysis of cancerspecific Gene regulatory networks from G...
Reconstruction and analysis of cancerspecific Gene regulatory networks from G...
 
MAGIC :Multiparent advanced generation intercross and QTL discovery
MAGIC :Multiparent advanced generation intercross and  QTL discovery MAGIC :Multiparent advanced generation intercross and  QTL discovery
MAGIC :Multiparent advanced generation intercross and QTL discovery
 
Clustering Approaches for Evaluation and Analysis on Formal Gene Expression C...
Clustering Approaches for Evaluation and Analysis on Formal Gene Expression C...Clustering Approaches for Evaluation and Analysis on Formal Gene Expression C...
Clustering Approaches for Evaluation and Analysis on Formal Gene Expression C...
 
BRITEREU_finalposter
BRITEREU_finalposterBRITEREU_finalposter
BRITEREU_finalposter
 
MAGIC POPULATION
MAGIC POPULATIONMAGIC POPULATION
MAGIC POPULATION
 
Genome wide association mapping
Genome wide association mappingGenome wide association mapping
Genome wide association mapping
 
PMED Undergraduate Workshop - Modeling and Estimating Biological Heterogeneit...
PMED Undergraduate Workshop - Modeling and Estimating Biological Heterogeneit...PMED Undergraduate Workshop - Modeling and Estimating Biological Heterogeneit...
PMED Undergraduate Workshop - Modeling and Estimating Biological Heterogeneit...
 
Genome wide association studies seminar
Genome wide association studies seminarGenome wide association studies seminar
Genome wide association studies seminar
 
QTL MAPPING & ANALYSIS
QTL MAPPING & ANALYSIS  QTL MAPPING & ANALYSIS
QTL MAPPING & ANALYSIS
 
Qtl mapping
 Qtl mapping  Qtl mapping
Qtl mapping
 
QTL mapping
QTL mappingQTL mapping
QTL mapping
 
Analisis de la expresion de genes en la depresion
Analisis de la expresion de genes en la depresionAnalisis de la expresion de genes en la depresion
Analisis de la expresion de genes en la depresion
 
FROM THE CLASSROOM TO AN OPINION NOTE: COMPLEMENTARY ANALYSIS OF THE GENETIC ...
FROM THE CLASSROOM TO AN OPINION NOTE: COMPLEMENTARY ANALYSIS OF THE GENETIC ...FROM THE CLASSROOM TO AN OPINION NOTE: COMPLEMENTARY ANALYSIS OF THE GENETIC ...
FROM THE CLASSROOM TO AN OPINION NOTE: COMPLEMENTARY ANALYSIS OF THE GENETIC ...
 
P1-01-17_poster
P1-01-17_posterP1-01-17_poster
P1-01-17_poster
 

Similar to American Statistical Association October 23 2009 Presentation Part 1

Challenges and opportunities for machine learning in biomedical research
Challenges and opportunities for machine learning in biomedical researchChallenges and opportunities for machine learning in biomedical research
Challenges and opportunities for machine learning in biomedical researchFranciscoJAzuajeG
 
American Statistical Association October 23 Minneapolis Presentation Part 2
American Statistical Association October 23 Minneapolis Presentation Part 2American Statistical Association October 23 Minneapolis Presentation Part 2
American Statistical Association October 23 Minneapolis Presentation Part 2Double Check ĆŐNSULTING
 
AI & Scientific Discovery in Oncology: Opportunities, Challenges & Trends
AI & Scientific Discovery in Oncology: Opportunities, Challenges & TrendsAI & Scientific Discovery in Oncology: Opportunities, Challenges & Trends
AI & Scientific Discovery in Oncology: Opportunities, Challenges & TrendsAndre Freitas
 
How to analyse large data sets
How to analyse large data setsHow to analyse large data sets
How to analyse large data setsimprovemed
 
Machine Learning in Biology and Why It Doesn't Make Sense - Theo Knijnenburg,...
Machine Learning in Biology and Why It Doesn't Make Sense - Theo Knijnenburg,...Machine Learning in Biology and Why It Doesn't Make Sense - Theo Knijnenburg,...
Machine Learning in Biology and Why It Doesn't Make Sense - Theo Knijnenburg,...Seattle DAML meetup
 
Large scale machine learning challenges for systems biology
Large scale machine learning challenges for systems biologyLarge scale machine learning challenges for systems biology
Large scale machine learning challenges for systems biologyMaté Ongenaert
 
scRNA-Seq Workshop Presentation - Stem Cell Network 2018
scRNA-Seq Workshop Presentation - Stem Cell Network 2018scRNA-Seq Workshop Presentation - Stem Cell Network 2018
scRNA-Seq Workshop Presentation - Stem Cell Network 2018David Cook
 
Introduction to systems biology
Introduction to systems biologyIntroduction to systems biology
Introduction to systems biologylemberger
 
2014DynamicsDaysPoster_Jie
2014DynamicsDaysPoster_Jie2014DynamicsDaysPoster_Jie
2014DynamicsDaysPoster_JieZhao Jie
 
Clinical Trials Versus Health Outcomes Research: SAS/STAT Versus SAS Enterpri...
Clinical Trials Versus Health Outcomes Research: SAS/STAT Versus SAS Enterpri...Clinical Trials Versus Health Outcomes Research: SAS/STAT Versus SAS Enterpri...
Clinical Trials Versus Health Outcomes Research: SAS/STAT Versus SAS Enterpri...cambridgeWD
 
CSCI 6505 Machine Learning Project
CSCI 6505 Machine Learning ProjectCSCI 6505 Machine Learning Project
CSCI 6505 Machine Learning Projectbutest
 
Sample Work For Engineering Literature Review and Gap Identification
Sample Work For Engineering Literature Review and Gap IdentificationSample Work For Engineering Literature Review and Gap Identification
Sample Work For Engineering Literature Review and Gap IdentificationPhD Assistance
 
Prof. Mark Coles (Oxford University) - Data-driven systems medicine
Prof. Mark Coles (Oxford University) - Data-driven systems medicineProf. Mark Coles (Oxford University) - Data-driven systems medicine
Prof. Mark Coles (Oxford University) - Data-driven systems medicinemntbs1
 
Cornell Pbsb 20090126 Nets
Cornell Pbsb 20090126 NetsCornell Pbsb 20090126 Nets
Cornell Pbsb 20090126 NetsMark Gerstein
 
Μοντέλα διάχυσης καρκινικών όγκων εγκεφάλου
Μοντέλα διάχυσης καρκινικών όγκων εγκεφάλουΜοντέλα διάχυσης καρκινικών όγκων εγκεφάλου
Μοντέλα διάχυσης καρκινικών όγκων εγκεφάλουManolis Vavalis
 
Uncovering intratumoral and intertumoral heterogeneity among single cell canc...
Uncovering intratumoral and intertumoral heterogeneity among single cell canc...Uncovering intratumoral and intertumoral heterogeneity among single cell canc...
Uncovering intratumoral and intertumoral heterogeneity among single cell canc...https://www.facebook.com/garmentspace
 
The Algorithms of Life - Scientific Computing for Systems Biology
The Algorithms of Life - Scientific Computing for Systems BiologyThe Algorithms of Life - Scientific Computing for Systems Biology
The Algorithms of Life - Scientific Computing for Systems Biologyinside-BigData.com
 

Similar to American Statistical Association October 23 2009 Presentation Part 1 (20)

Challenges and opportunities for machine learning in biomedical research
Challenges and opportunities for machine learning in biomedical researchChallenges and opportunities for machine learning in biomedical research
Challenges and opportunities for machine learning in biomedical research
 
American Statistical Association October 23 Minneapolis Presentation Part 2
American Statistical Association October 23 Minneapolis Presentation Part 2American Statistical Association October 23 Minneapolis Presentation Part 2
American Statistical Association October 23 Minneapolis Presentation Part 2
 
AI & Scientific Discovery in Oncology: Opportunities, Challenges & Trends
AI & Scientific Discovery in Oncology: Opportunities, Challenges & TrendsAI & Scientific Discovery in Oncology: Opportunities, Challenges & Trends
AI & Scientific Discovery in Oncology: Opportunities, Challenges & Trends
 
How to analyse large data sets
How to analyse large data setsHow to analyse large data sets
How to analyse large data sets
 
Machine Learning in Biology and Why It Doesn't Make Sense - Theo Knijnenburg,...
Machine Learning in Biology and Why It Doesn't Make Sense - Theo Knijnenburg,...Machine Learning in Biology and Why It Doesn't Make Sense - Theo Knijnenburg,...
Machine Learning in Biology and Why It Doesn't Make Sense - Theo Knijnenburg,...
 
Large scale machine learning challenges for systems biology
Large scale machine learning challenges for systems biologyLarge scale machine learning challenges for systems biology
Large scale machine learning challenges for systems biology
 
scRNA-Seq Workshop Presentation - Stem Cell Network 2018
scRNA-Seq Workshop Presentation - Stem Cell Network 2018scRNA-Seq Workshop Presentation - Stem Cell Network 2018
scRNA-Seq Workshop Presentation - Stem Cell Network 2018
 
10.1.1.80.2149
10.1.1.80.214910.1.1.80.2149
10.1.1.80.2149
 
Introduction to systems biology
Introduction to systems biologyIntroduction to systems biology
Introduction to systems biology
 
2014DynamicsDaysPoster_Jie
2014DynamicsDaysPoster_Jie2014DynamicsDaysPoster_Jie
2014DynamicsDaysPoster_Jie
 
Clinical Trials Versus Health Outcomes Research: SAS/STAT Versus SAS Enterpri...
Clinical Trials Versus Health Outcomes Research: SAS/STAT Versus SAS Enterpri...Clinical Trials Versus Health Outcomes Research: SAS/STAT Versus SAS Enterpri...
Clinical Trials Versus Health Outcomes Research: SAS/STAT Versus SAS Enterpri...
 
Clinical Trials Versus Health Outcomes Research: SAS/STAT Versus SAS Enterpri...
Clinical Trials Versus Health Outcomes Research: SAS/STAT Versus SAS Enterpri...Clinical Trials Versus Health Outcomes Research: SAS/STAT Versus SAS Enterpri...
Clinical Trials Versus Health Outcomes Research: SAS/STAT Versus SAS Enterpri...
 
CSCI 6505 Machine Learning Project
CSCI 6505 Machine Learning ProjectCSCI 6505 Machine Learning Project
CSCI 6505 Machine Learning Project
 
Sample Work For Engineering Literature Review and Gap Identification
Sample Work For Engineering Literature Review and Gap IdentificationSample Work For Engineering Literature Review and Gap Identification
Sample Work For Engineering Literature Review and Gap Identification
 
Prof. Mark Coles (Oxford University) - Data-driven systems medicine
Prof. Mark Coles (Oxford University) - Data-driven systems medicineProf. Mark Coles (Oxford University) - Data-driven systems medicine
Prof. Mark Coles (Oxford University) - Data-driven systems medicine
 
Cornell Pbsb 20090126 Nets
Cornell Pbsb 20090126 NetsCornell Pbsb 20090126 Nets
Cornell Pbsb 20090126 Nets
 
Μοντέλα διάχυσης καρκινικών όγκων εγκεφάλου
Μοντέλα διάχυσης καρκινικών όγκων εγκεφάλουΜοντέλα διάχυσης καρκινικών όγκων εγκεφάλου
Μοντέλα διάχυσης καρκινικών όγκων εγκεφάλου
 
Uncovering intratumoral and intertumoral heterogeneity among single cell canc...
Uncovering intratumoral and intertumoral heterogeneity among single cell canc...Uncovering intratumoral and intertumoral heterogeneity among single cell canc...
Uncovering intratumoral and intertumoral heterogeneity among single cell canc...
 
The Algorithms of Life - Scientific Computing for Systems Biology
The Algorithms of Life - Scientific Computing for Systems BiologyThe Algorithms of Life - Scientific Computing for Systems Biology
The Algorithms of Life - Scientific Computing for Systems Biology
 
AnoMalNet: outlier detection based malaria cell image classification method l...
AnoMalNet: outlier detection based malaria cell image classification method l...AnoMalNet: outlier detection based malaria cell image classification method l...
AnoMalNet: outlier detection based malaria cell image classification method l...
 

American Statistical Association October 23 2009 Presentation Part 1

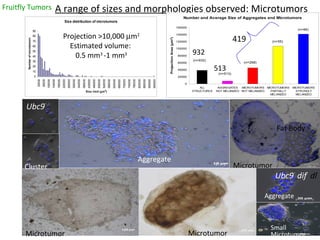
  • 1. Fruitfly Tumors A range of sizes and morphologies observed: Microtumors Ubc9 - dif - dl - Ubc9 - - Microtumor Microtumor Microtumor Aggregate Cluster Aggregate Small Microtumor Fat Body 419 Projection >10,000  m 2 Estimated volume: 0.5 mm 3 -1 mm 3 932 513
  • 2. (Chiu et al 2005) : dUbc9 negatively regulates the Toll-NF-nB pathways in larval hematopoiesis and drosomycin activation in Drosophila. Developmental Biology. Genotype  Number of Larvae Ubc9-(transheterozygote) 58 Bc + Ubc9- 55 95% CI Odds Ratio: NS>5% 0.85- 1.25 Ubc9-   Aggregates + Tumors Aggr Tumors Totals 932 513 419 %   55.04% 44.96% Bc Ubc9/+ Ubc9-   Aggregates + Tumors Aggr Tumors Totals 874 262 612 % 29.98% 70.02%
  • 3. Bc allele background FlyBase GBrowse modENCODE GBrowse Gene Dmelc FB2009_07, released August 10, 2009 General Information Symbol Dmelc Species D. melanogaster Name Black cells Annotation symbol CG5779 Feature type protein_coding_gene FlyBase ID FBgn0000165 Gene Model Status Current Stock availability 68 publicly available Genomic Location Chromosome (arm) 2R Recombination map 2-80.6 Cytogenetic map 54F6-54F6 Sequence location 2R:13,774,718..13,777,477 [-] Genomic Maps The gene Black cells is referred to in FlyBase by the symbol Dmelc (CG5779, FBgn0000165). It is a protein_coding_gene from Drosophila melanogaster. Its sequence location is 2R:13774718..13777477 . It has the cytological map location 54F6 . Its molecular function is described as: monophenol monooxygenase activity; oxygen transporter activity; oxidoreductase activity. It is involved in the biological processes: defense response; melanization defense response; scab formation; response to symbiont; response to wounding; transport. 10 alleles are reported . The phenotypes of these alleles are annotated with: crystal cell; hemocyte; hemolymph; lymph gland; adult; procrystal cell; lamellocyte; posterior lymph gland pair. It has one annotated transcript and one annotated polypeptide . Takehana, A., Katsuyama, T., Yano, T., Oshima, Y., Takada, H., Aigaki, T., Kurata, S. (2002). Overexpression of a pattern-recognition receptor, peptidoglycan-recognition protein-LE, activates imd/relish-mediated antibacterial defense and the prophenoloxidase cascade in Drosophila larvae.  Proc. Natl. Acad. Sci. U.S.A. 99(21): 13705--13710. Ye, Y.H., Chenoweth, S.F., McGraw, E.A. (2009). Effective but costly, evolved mechanisms of defense against a virulent opportunistic pathogen in Drosophila melanogaster.  PLoS Pathog. 5(4): e1000385.
  • 4. Comparative Analysis of Area limits 25K to 300K and 300K to 600K in both Genotypes : Higher Maximum Likelihood mean, variances and wider confidence interval of 25K-300K shows faster mitosis and cell death than that of 300K-600K. Maximum Likelihood (ML) Estimates of BC-All (BC-lwr) and lwr43-5 All BC-All Mean Tumors Variance Tumors 95% Confidence Interval 25K-300K 4.86 0.85 1.22 to 1.84 300K-600K 1.67 0.02 1.11 to 1.20 lwr43-5 All Mean Tumors Variance Tumors 95% Confidence Interval 25K-300K 4.5 0.97 1.10 to 1.88 300K-600K 1.27 0.02 1.05 to 1.12
  • 5. 25K-300K Area Size Tumor Log-Normal Distribution in BC-All and Recessive Genotypes (number of micro tumor found or frequency on Y-axis; every 25K scale)
  • 6. PROBLEM STATEMENT Tumor size data from non-random and correlated data. Samples were prepared for 8 days and scored on 9 th day- cumulative effects on frequencies of BC-All and recessive (lwr-) Area size Units between 25k to 600k size distributions? Effects of new VS experienced PhD student on data collection? 612 VS 419. This difference is not statistically significant (P> 5%). EXPECTED frequency higher at all area size for Semidominant gene in the hypothetical Y-axis. Does not have a pattern to quantify by a Dynamical simulation equations- tried 100’s of published math methods…. Sample size is ONLY 48 rows of Tumor Frequency data!
  • 7.
  • 8. Analysis of Raw data showing V-shape residual and compensatory response by 25K area limit (R-square = 0.36 VS 0.76 VS 0.86 ). Data Analysis needs Dynamical Simulations, Reverse Engineering Algorithms and Simulated OLS Regression.
  • 9. LITERATURE REVIEW & METHODS Dynamical Simulation by Taylor’s Power Series like Math equation: A . Y= x 1 + x 2 +x 3 + x 4 . Reference : “Lee Specter and Shawn Luke- Culture Enhances the Evolvability of Cognition. 1996. In Proceedings of the Eighteenth Annual Conference of the Cognitive Science Society. “ According to Specter and Luke, special type of Dynamical Simulation is Symbolic Regression- “ to produce a function, in symbolic form, that fits a provided set of data points. For each element of a set of (x,y) points, the function should map the x value to an appropriate y value. This sort of problem faced by a scientist who has obtained a set of experimental data points and suspects that a simple formula will suffice to explain the data ” . This method is a standard example from Dynamical simulation and used in many different types of biological systems (Koza, J.R. 1992. Genetic Programming: on the programming of computers by means of natural selection. Cambridge, MA, MIT Press).
  • 10. B. Reverse Engineering Prediction by the equation of y = 4.251a2 + ln(a2) + 7.243ea- CF . ( Candida Ferreira. 2003. www.gene-expression-programming.com/author.asp- equation 3.2 ) Ekaterina Vladislavleva- June 2008- PhD Theses Models to exhibit not only required properties, but also additional convenient properties like compactness, small number of constants, etc. It is important, that generated models are interpretable and transparent, in order to provide additional understanding of the underlying system or process.
  • 11.
  • 12. Reverse Engineering of Polynomial Models of Gene Regulatory Networks (Visual Analytics = Meta Modeling = what are the ranges of input variables that cause the response to take certain values, not necessarily optimal? ) Dr. Eduardo Mendoza Mathematics Department Center for NanoScience Ludwig-Maximilians-University Munich, Germany [email_address] eduardom@math.upd.edu.ph Brody et al . October 1, 2002: PNAS : Significance and Statistical Errors in the analysis of DNA microarray data. 99 (20): 12975-12978 ( Even for Lorentizian like distributions, median of ratios provide distributions more Gaussian like ).
  • 13. Reverse Engineering of Systems Systems identification in Engineering: goal is to construct a system with prescribed dynamical properties In Systems Biology, one is interested in identifying as closely as possible a unique biological system that has been observed experimentally In both cases: sparsity of available measurements will leave the system underdetermined (GIGO- Uninterpretable)
  • 14.
  • 15.
  • 16. A . “Operon or Tumor Gene Expression occurs in a deterministic way from 25K to 300K area limits, and hence would have high survival probability”. This hypothesis indicates that there are conserved Protein motifs which generates various Brain Tumor sizes in Fruit fly in predetermined frequencies. Thus, micro-tumors counted (frequency) for lower size limits can be predicted by least non-linear mathematical and statistical equations . B . “Log-Normal distribution arose due to compensatory response by lowest size distribution over the next few micro-tumor classes”. If the number of micro-tumors counted for 25K area size is at the expense of next few, then a Log-Normal Distribution can be assured . Log-Normal Distribution explanation
  • 17. Leo Breiman: Statist. Sci. Volume 16, Issue 3 (2001), 199-231. Statistical Modeling: The Two Cultures Abstract There are two cultures in the use of statistical modeling to reach conclusions from data. One assumes that the data are generated by a given stochastic data model. The other uses algorithmic models and treats the data mechanism as unknown. The statistical community has been committed to the almost exclusive use of data models. This commitment has led to irrelevant theory, questionable conclusions, and has kept statisticians from working on a large range of interesting current problems. Algorithmic modeling, both in theory and practice, has developed rapidly in fields outside statistics. It can be used both on large complex data sets and as a more accurate and informative alternative to data modeling on smaller data sets. If our goal as a field is to use data to solve problems, then we need to move away from exclusive dependence on data models and adopt a more diverse set of tools .
  • 18. A. Analysis of size distribution of lwr (-) microtumors from 58 animals Projection >10,000  m 2 ; Estimated volume: 0.5 mm 3 -1 mm 3 Taylor series: y = x 1 + x 2 +x 3 + x 4 Area Limit Simulated Frequency 100,000 -01 (1) 200,000 +01 (2) 275,000 -02 (3) MLE:25k-300k Mean=4.5 Tumors Variance=0.97 Tumors CI= 1.10-1.88 Tumors MLE: 300k-600k Mean= 1.27 Tumors Variance= 0.02 Tumors CI= 1.05-1.12 Tumors
  • 19.
  • 20. Ekaterina Vladislavleva- PhD: JUNE 2008 Both measured and simulated data are very often corrupted by noise, and in case of real measurements can be driven by a combination of both measured and unmeasured input variables, empirical models should not only accurately predict the observed response, but also have some extra generalization capabilities. The same requirement holds for models developed on simulated data. Models to exhibit not only required properties, but also additional convenient properties like compactness, small number of constants, etc. It is important, that generated models are interpretable and transparent, in order to provide additional understanding of the underlying system or process.
  • 21.
  • 22.
  • 23.
  • 24.