1. Geun Ho Lee
IB Physics HL
Period 1
September 23, 2011
Mr. Eales
Optical Activity Dependence on Temperature of a Sucrose Solution
Introduction
Electromagnetic waves are series of transverse waves oscillating at various axes. When these waves
are made so that they oscillate in one axis only, the wave is said to be polarized. The tool that allows
us to polarize the electromagnetic waves is called polarizer.
In the spectrum of electromagnetic waves,
different types of waves are named and arranged
according to their wavelength. For instance,
visible light refers to electromagnetic waves
between 400 and 700 nanometers. And these
different types of waves can have varying
effects on living organisms. For gamma rays, it
has been proven that they exert enough power to
alter living organisms’ DNA thereby likely to
cause abnormal mutations. However, adequate
amounts of visible light rays are essential for
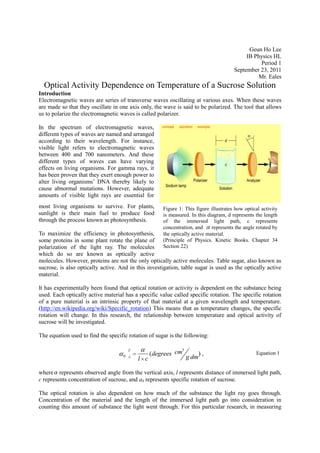
most living organisms to survive. For plants, Figure 1: This figure illustrates how optical activity
sunlight is their main fuel to produce food is measured. In this diagram, d represents the length
through the process known as photosynthesis. of the immersed light path, c represents
concentration, and represents the angle rotated by
To maximize the efficiency in photosynthesis, the optically active material.
some proteins in some plant rotate the plane of (Principle of Physics. Kinetic Books. Chapter 34
polarization of the light ray. The molecules Section 22)
which do so are known as optically active
molecules. However, proteins are not the only optically active molecules. Table sugar, also known as
sucrose, is also optically active. And in this investigation, table sugar is used as the optically active
material.
It has experimentally been found that optical rotation or activity is dependent on the substance being
used. Each optically active material has a specific value called specific rotation. The specific rotation
of a pure material is an intrinsic property of that material at a given wavelength and temperature.
(http://en.wikipedia.org/wiki/Specific_rotation) This means that as temperature changes, the specific
rotation will change. In this research, the relationship between temperature and optical activity of
sucrose will be investigated.
The equation used to find the specific rotation of sugar is the following:
T 3
(degrees cm ), Equation 1
0
l c g dm
where represents observed angle from the vertical axis, l represents distance of immersed light path,
c represents concentration of sucrose, and a0 represents specific rotation of sucrose.
The optical rotation is also dependent on how much of the substance the light ray goes through.
Concentration of the material and the length of the immersed light path go into consideration in
counting this amount of substance the light went through. For this particular research, in measuring
2. the concentration of the table sugar, mass of the sucrose per volume of water was computed. For the
immersed light path, the distance between one wall of a clear aquarium which the light was being
shined through and the other opposite wall was measured. Figure 1 is a clear diagram of this.
(Principle of Physics. Kinetic Books. Chapter 34 Section 22)
Then, an equation for calculating the rotation of light (optical rotation) can be found:
T
(l )(c)( 0 )
100
l (m) c(kg
T 3
3 ) (degrees cm )
m 0 g dm
100
l (m) c(kg
T 2
3 ) (degrees m )
m 0 kg
100
l c T
0 (degrees) , Equation 2
100
where represents optical rotation and other variables are carried through Equation 1.
Thus, it is predicted that the optical rotation of sucrose will depend on the temperature of the solution,
as Equation 2 presents. Indeed, it is not expected to show a proportional relationship because
temperature is not directly correlated with the optical activity, but still is indirectly related.
Design
Research Question
What is the relationship between the temperature
and the optical rotation of 20% sucrose solution?
Variables
The independent variable was the temperature of
sucrose solution and the dependent variable was
the optical rotation of the solution. There were also
several controlled factors that were kept constant
Figure 2: This diagram is a simplified version of throughout the experiment. Only one light source
the setup for this investigation. The grey cylinder (laser) and aquarium was used as changing the
is the laser used in this investigation. The two wavelength of the light source or changing the
black squares are two polarizers. The one closer aquarium, thereby changing the immersed light
to the laser is called polarizer and the one behind
path, would affect optical rotation of sucrose
the aquarium is called the analyzer. The blue
cuboid is the aquarium used in this investigation.
solution. Also, the concentration of the sucrose
The green rectangle is screen to enhance the solution was always kept at 20% to eliminate any
experimenter’s vision of the laser beam. The red chance in changing the optical rotation of the
line illustrates the path the laser light traveled. solution other than by varying temperatures. The
method in measuring observed angles was
controlled to minimize any inconsistency in the collection of data. By turning off the air conditioners,
the temperature of the lab was controlled to minimize the difference in heat transfer with the
environment when the solution was at high or low temperatures.
As seen in Figure 2 on the left, the apparatus of this investigation was set up in such way. However, to
3. increase precision in data, the laser and the polarizer was clamped onto a table. The analyzer was
taped onto a circular piece of paper to aid rotation, then clamped down onto the same table (See
Figure 3 for clarification).
θ
Hypotenuse
Base
Figure 3: This picture is an image of how the Figure 4: This diagram represents the imaginary
analyzer was fixed to its place. Notice that the dark triangle that was drawn to measure the observed angle
line was drawn on the paper to indicate the during the experiment. The black circle represents the
direction of the polarizing plane of the light that circular paper and the grey square represents the
goes through the analyzer. The ruler shown is also analyzer. By a ruler, the values of hypotenuse and base
clamped into place. This ruler acts as a base for was measured. Then, arccosine was used to compute
which the trigonometry was applied to find the the angle θ. To clarify, the hypotenuse and base are
observed angle. measurements from the center of circular paper to
the end of the imaginary triangle.
The method used to collect data in this experiment was by manually shining the laser beam through
the polarizer, through the 20% sucrose solution in an aquarium, then through the analyzer which was
rotated until the laser beam has totally disappeared on the screen. Then, the experimenter used a ruler
to measure the hypotenuse and base of an imaginary triangle formed as described in Figure 4. The
weaknesses of this data collection method will be discussed in the Evaluation section of this report.
Data Collection and Processing
Data Table:
Controlled Factors
Wavelength of the laser ±nm
Concentration of sucrose solution g
0.25
cm 3
Dimensions of aquarium Length: 10.5±0.3cm
(Square base aquarium) Width: 10.5±0.3cm
Height: 27.3±0.3cm
Table 1: This table presents controlled factors in this experiment. The uncertainty of the concentration of sucrose
solution was omitted because it is negligible. Notice that the immersed light path is the same as length of
aquarium.
4. Temperature vs. Hypotenuse and Base
Trials
Temperature of 20% (±0.3cm)
sucrose solution
1 2 3
(±0.3℃)
Hypotenuse Base Hypotenuse Base Hypotenuse Base
9.0 6.2 2.5 5.8 2.5 6.6 2.5
11.5 7.1 2.5 7.0 2.5 6.7 2.5
14.0 8.5 2.5 8.2 2.5 7.9 2.5
25.0 8.0 2.5 8.3 2.5 8.4 2.5
44.0 8.2 2.5 8.1 2.5 8.0 2.5
51.0 8.6 2.5 8.5 2.5 8.3 2.5
63.0 9.5 2.5 8.9 2.5 8.9 2.5
Table 2: Imported from Excel spread sheet. This table shows measured values of hypotenuse and base of the
imaginary triangle from Figure 4 for each trial at different temperatures. The uncertainty is instrumental
uncertainty.
Temperature vs. Average Observed Angle
Temperature of 20% sucrose solution Trials Average
(±0.3℃) (±2 degrees) Observed
1 2 3 Angle
(±2 degrees)
9.0 66 64 68 66
11.5 69 69 68 69
14.0 73 72 72 72
25.0 72 72 73 72
44.0 72 72 72 72
51.0 73 73 72 73
63.0 75 74 74 74
Table 3: Imported from Excel spread sheet. This table shows observed angles at different temperatures. The
uncertainty was taken as half the range of 9.0°C. Notice that this angle is the observed angle, α in Equation 1.
5. Temperature vs. Specific Rotation
Temperature of 20% sucrose solution Average Observed Specific Rotation
(±0.3℃) Angle 2
(±2 degrees cm g )
(±2 degrees)
9.0 66 25
11.5 69 26
14.0 72 27
25.0 72 27
44.0 72 27
51.0 73 28
63.0 74 28
Table 4: Imported from Excel spread sheet. This table shows average observed angles and specific rotation of
sucrose solution at different temperatures. The uncertainty for specific rotation was taken as half the range in
63.0°C.
Temperature vs. Optical Rotation
Temperature of 20% sucrose solution Specific Rotation Optical Rotation
(±0.3℃)
2 (±0.06 degrees)
(±2 degrees cm g )
9.0 25 0.66
11.5 26 0.69
14.0 27 0.72
25.0 27 0.72
44.0 27 0.72
51.0 28 0.73
63.0 28 0.74
Table 5: Imported from Excel spread sheet. This table shows specific rotation and optical rotation of sucrose
solution at different temperatures. The uncertainty for optical rotation was taken as half the range in 63.0°C.
6. Data Processing:
Figure 5: This is the graph of the raw data collected. This graph shows correlation between average observed
angles and temperature. From the slope of the linear fit, it can be deduced that observed angle does change as
the temperature changes.
Figure 6: This graph shows correlation between specific rotations and temperature. From the slope of the linear
fit, it can be deduced that specific rotation does change as the temperature changes.
7. Figure 7: This graph shows correlation between optical rotations and temperature. From the slope of the linear
fit, it can be deduced that optical rotation does change as the temperature changes. It can be seen that linear is a
much better fit than a proportional just from the arrangement of the data points. However, it is difficult to
decipher which relationship will fit this set of data the best.
Sample calculation for Observed Angle using 9.0°C first trial data:
Hypotenuse: 6.2 0.3cm
Base: 2.5 0.3cm
2.5
Actual Value of Observed Angle: cos 1 ( ) 66.2200
6.2
2.5 0.3cm
Maximum Observed Angle: cos 1 ( ) 67.6073
6.2 0.3cm
2.5 0.3cm
Minimum Observed Angle: cos 1 ( ) 64.7715
6.2 0.3cm
67.6073 64.7715
Half range: 1.4179 1
2
Observed Angle: 66 1
Sample calculation for Specific Rotation using 63.0°C second trial data:
Observed Angle: 74 2
Immersed light path: 10.5 0.3cm
g
Concentration of sucrose solution: 0.25
cm 3
8. 66 2
Actual Specific Rotation: 25.1429 cm
g
(0.25 g 3 )(10.5cm)
cm
(66 1) 2
Maximum Specific Rotation: 26.2745 cm
g
(0.25 g 3 )(10.5 0.3)cm
cm
(66 1) 2
Minimum Specific Rotation: 24.0741 cm
g
(0.25 g )(10.5 0.3)cm
cm3
(26.2745 24.0741) cm2 2 2
Half range: 1.1002 cm 1 cm
2 g g g
2
Specific Rotation: 25 1 cm
g
Sample calculation for Optical Rotation using 44.0°C third trial data:
2
Specific rotation: 27 2 cm
g
Immersed light path: 10.5 0.3cm
Concentration of sucrose solution: 0.25
g
cm 3
(0.25 g
2
)(10.5cm)(27 cm )
3
cm g
Actual Optical Rotation: 0.70875
100
(0.25 g
2
)(10.5 0.3cm)(27 1 cm )
3
cm g
Maximum Optical Rotation: 0.75600
100
(0.25 g 3 )(10.5 0.3cm)(27 1 cm )
2
cm g
Minimum Optical Rotation: 0.66300
100
(0.75600 0.66300)
Half range: 0.0465 0.05
2
Optical Rotation: 0.71 0.05
Conclusion
According to the results, this research has shown that the varying temperature has effects on the
optical activity or rotation of 20% sucrose solution. From Equation 2, it can be seen that the
relationship between temperature and optical rotation is direct, because temperature is related to
specific rotation of any optically active materials. Thus, at the beginning it was predicted that the
results will not follow a proportional trend. Figure 7 clearly illustrates this, as no two data points
could possibly lie on one proportional graph. Thus, no conclusive equation can be presented. However,
it has been found by this research that as temperature increases, the optical rotation of sucrose
increases as well. This means that when sucrose solution is heated, the direction of polarization of
polarized light rays will be rotated more going through the sucrose solution.
9. Based on the fit on Figure 7, some level of confidence is gained, because the trend follows what
Equation 2 predicted; no proportional correlation between temperature and optical rotation. However,
no strong confidence can be gained as not enough of research has been done on this topic to compare
the data with. Also, due to such lack of published knowledge, the actual trend the data should follow
is undetermined, thus lowering the level of confidence in the results of this investigation.
Although no conclusive equation can be stated out of the results of this investigation, the data can still
provide a useful knowledge with certain restrictions to applicability. First, the results gained only
apply for sucrose solution of concentration 20% by mass. This is because both specific and optical
rotation are closely related to the concentration of the solution. Also, the results are only applicable to
tubing of 10.5±0.3cm. This tubing will act as the aquarium in this investigation and as defined in
Equation 1 and 2, immersed light path is also a significant factor in determining optical rotation of
sucrose.
The following document is a published document on the similar topic:
http://www.standardbase.hu/tech/SITechPolar.pdf
However, the results of this published document is based on 1 g 3 concentrated sucrose solution.
cm
Thus, it cannot provide any reference point to the results of this document, as the concentration of
sucrose solution used in this one is 0.25 g 3.
cm
Even with these restrictions in applicability, the results of this investigation proves that 20% sucrose
solution will change its optical rotation as temperature changes. This knowledge can be applied in
electronics, especially in the areas of using screens. With the results from this investigation, it has
been concluded that 20% sucrose solution is not a good substitute for liquid crystals in our LCD
screens.
Evaluation
One main source of error during the course of investigation was in the method of measuring observed
angle. As described in Design section of this report, the method used to measure angle was using
trigonometry. However, by using ruler and computing the angle measure using arccosine, quite a bit
of accuracy of the measure was lost. This lost accuracy will certainly be improved if polarimeter was
used to measure the optical rotation in one step. This is because by going through four calculations to
get to optical rotation, a lot of accuracy would have been lost, but polarimeter is a very accurate
instrument to measure specifically optical rotation of different materials.
Also, the integrity of the data is questionable, because at lower temperatures, condensation occurred
on the glass aquarium. This occurrence of condensation hampered the vision of the experimenter, thus
leading to possible errors in detecting the true angles at which the light ray was totally blocked by the
analyzer. Although the experimenter had wiped the condensation off the walls of the aquarium, an
error could have occurred anywhere in that process. To improve on this problem, the experimenter
should be testing in moister-free lab or a lab at low temperatures, close to what the solution is.
Lastly, heat loss was another factor in error. Because the solution was not at all insulated, heat transfer
with the environment occurred constantly at high and low temperatures. To minimize this effect, the
environment’s temperature could be changed to the temperature of the solution or insulators can be
put around the aquarium, only leaving small aperture for light ray to go through.