SlideShare une entreprise Scribd logo
1  sur  21
Introduction to Visualization Tools and 
Microsoft Power BI
Goal : Scalable and Efficient 
Create a user friendly data platform strategy which 
 Supports data volumes beyond the current Excel limits. 
 Supports automated web-based reporting delivery . 
 Provides an operational framework which increases efficiency. 
This promotes standardisation and empowers A&I to continue 
producing brilliant data work for clients 
2
Tool Set 
Excel 2013 Power BI Omniscope Tableau Qlikview 
3 
Power Pivot 
Power View
What Platforms will we use to do what 
in the future 
4 
Reporting Dashboarding 
Standard 
report 
automation. 
Delivery of 
report in XL, 
direct 
update from 
Datamart. 
Ad-hoc data 
analysis on 
small data 
sets (up to 
10MM cells). 
Not suitable 
for cross 
markets 
dashboards. 
Web-based 
dashboard up 
to 1BN cells / 
1GB data. 
Suitable for 
cross markets 
dashboards. 
Web-based 
dashboard 
over 1BN 
cells/ 1GB 
data. 
Suitable for 
cross markets 
dashboards. 
Power Pivot 
+ Datamart 
Omniscope Tableau + 
Datamart 
QlikView 
Web-based 
dashboard 
over 1BN 
cells/ 1GB 
data. 
Suitable for 
cross markets 
dashboards. 
PowerView
A little bit more about each technology 
Omniscope is the dashboarding technology we have been using the most widely across MEC these 
last 4 years. It is an off the shelf application from Visokio. It allows to combine and clean data 
(Data Manager) as well as visualise the data. A great product we will carry on using for small 
scale implementations. For more info visit the Omniscope group on Planet MEC. 
5 
Omniscope 
PowerPivot is a free add-on to Excel 2010, providing an in-memory data engine capable of 
handling data volumes orders of magnitude larger than Excel alone. Data from the PowerPivot 
engine can be used in Excel reports via a pivot-like interface, and it provides the capability to 
seamlessly connect to a wide range of data sources including Datamart, SQL Server and many 
more. For more information visit http://www.microsoft.com/en-us/bi/powerpivot.aspx 
Tableau is a hybrid in-memory/on-disk dashboarding technology designed to provide a fast web-based 
user experience with support for much larger data volumes than Omniscope. Tableau 
consists of two core components: a desktop-based dashboard design tool and a server-based 
publishing and hosting engine. Tableau also provides a free visualisation tool (Tableau public) 
which is fully functional but limited to small datasets. GroupM currently provides a centralised 
Tableau Server which we will use initially. For more information visit 
http://www.tableausoftware.com/ 
Qlikview is an in-memory dashboarding technology designed to provide a rich, flexible dashboard 
experience via a web interface. Unlike Tableau, Qlikview does not consist of separate design 
and hosting components, but requires a skilled Qlikview developer to implement effectively. It 
supports the largest data volume of all the visualisation platforms we support, but at a 
significantly higher licence cost than Tableau or Omniscope. For more information visit 
http://www.qlikview.com/
MSFT Visualization and Reporting Tools 
6 
How is an organization Positioned : 
With using present structure of 
tools available like Office 2013 
professional pro versions(Some 
users already have office 2013 
professional pro) and Add- in’s like 
power pivot and power query in 
Collaboration with Sharepoint 
2010/2013 . MECGlobal provide 
easy-to-use information directly 
where individuals work, 
collaborate, and make decisions. 
This capability includes reporting, 
analysis, and performance 
management technologies that can 
improve business insight 
MECGlobal BI Solution with MSFT Tools
Points to consider on how has Implementation of Power View and Excel services will 
improve efficiency: 
7 
• Power Pivot empowers users of all levels to 
access and mash up data from virtually any 
source. Users can create their own compelling 
reports and analytical applications, easily share 
insights, and collaborate with colleagues through 
Microsoft Excel and SharePoint. 
• Power View, provides SharePoint users with highly 
interactive, browser-based data exploration, 
visualization, and presentation capabilities. No 
dependency of the version of Office if power 
maps not used. 
• Microsoft SharePoint Server 2010 provides a full 
set of rich dashboard and scorecard capabilities 
including advanced filtering, guided navigation, 
interactive analytics and visualizations. 
• Browser-based mobile access to your corporate BI 
content is provided through Microsoft SharePoint 
Server 2010. Users can navigate existing reports, 
dashboards, scorecards, and analytical 
applications across iOS, Android, and Windows 
devices.
Microsoft Power BI 
Deployment 
75$ per 
internal 
User 
And FREE 
for 
external 
users 
8 
Licensing Basics 
Extranet/Power BI 
Current(2010) New 
(2013) 
Sharepoint Server 
plus CALs for both 
internal and 
External user 
Sharepoint 
Server 2013 plus 
CALs for internal 
users only 
• Extranet Scenario licensed through Sharepoint Server. No CALs required for 
external users, internal users need CALs 
• Internet Sites Scenario licensed through Sharepoint Server 
• External users means users that are not either your or your affiliates’ 
employees or your or your affiliates’ onsite contractors or onsite agents.
What you need to get Started 
9 
Testing and Validation 
•Excel Data Visualization. Even if users will be developing their own 
independent Excel & Power View reports from your data model, they 
may find an Excel worksheet of data visualization to be very helpful 
to get started reporting on the underlying data model. 
•Excel Testing. Test the data model using Excel as the reporting tool. 
Because the data model and Excel data visualization are linked 
together via the Excel file, it’s very easy to iteratively go back and 
forth between windows to finalize the data model. 
•Power View Testing. Test the data model using Power View as the 
reporting tool (if you have SharePoint 2010/2013 and Power View 
available in your environment, or a business edition of Excel 2013).
Power BI Model
Powerful Self- Service BI
Power Query 
 Data discovery, data transformation and enrichment for the desktop to 
the Sharepoint. Easily discover, combine, and refine data for better 
analysis in Excel. 
12 
Import Data from 
External Sources 
Shape data from Multiple 
Sources 
Filter, Sort and Group Data 
Share and Manage Queries
Analyse and Model using Power Pivot
Power Pivot 
Power Pivot is a powerful data mashup and data exploration tool based 
on in-memory technologies providing unmatched analytical 
performance to process billions of rows at the speed of thought. 
1. Work With Very Large Data Sets. 
2. Combine Data From Different 
Sources 
3. Create Visually Appealing Analytical 
Models for Reporting 
4. Use DAX to Create Calculated Fields 
for Slicing and Dicing Data 
5. Publish Reports to SharePoint 2010 
6. PowerPivot needs an external data 
source, so isn’t a direct substitute 
for Access. It can, however, *use* 
Access as a data source. 
7. PowerPivot is designed to work with 
data from multiple sources 
simultaneously.
Power View
Power View 
Power View is a new tool for ad hoc reporting which provides an interactive data exploration, 
visualization, and presentation experience to the business users. Business users can quickly and easily 
create and interact with different views of data from different angles. Power View reports can be based 
on data models on PowerPivot workbooks or tabular models or multi dimensional models 
Multiple Views in a Single 
Slicers Cross Filter Other Report 
Slicers 
Show Items 
with No 
Data rather 
than Null 
value 
Print It! 
PDF Export 
Better Chart 
Features
Power Map with Excel 
2013 
• Power Map. Power Map, previously known by the development name GeoFlow, is 
an add-in to Excel 2013 that provides still more compelling Bing Map powered 
visualizations, extending Power View’s capabilities with 3D map visualizations.
Collaborate and stay connected with Sharepoint 2013 
Benefit of using a Power BI site to store and share your workbooks is that 
workbooks on Power BI sites can be up to 500 megabytes
Works on any Windows Tablet 
• Mobile BI Viewer. Microsoft has a native mobile viewing applications for visualizations 
created in Power View and published to Power BI sites called “ Microsoft Power BI”. The 
mobile components will meet the growing requirement to deliver BI visualizations to 
tablet devices.
Ideal Power BI Scenario 
1 Create a Power Pivot Model 
2 
Publish Power Pivot Model to Sharepoint 
3 
Analyse the model 
using Power view 
Easy to Share 4 
Sharepoint Users
Thank you!

Contenu connexe

Tendances

SYBIS - Power BI
SYBIS - Power BI SYBIS - Power BI
SYBIS - Power BI Iman Ef
 
Microsoft power bi
Microsoft power biMicrosoft power bi
Microsoft power bitechpro360
 
Power BI Made Simple
Power BI Made SimplePower BI Made Simple
Power BI Made SimpleJames Serra
 
Learn How to Use Microsoft Power BI for Office 365 to Analyze Salesforce Data
Learn How to Use Microsoft Power BI for Office 365 to Analyze Salesforce DataLearn How to Use Microsoft Power BI for Office 365 to Analyze Salesforce Data
Learn How to Use Microsoft Power BI for Office 365 to Analyze Salesforce DataNetwoven Inc.
 
Learn Power BI with Power Pivot, Power Query, Power View, Power Map and Q&A
Learn Power BI with Power Pivot, Power Query, Power View, Power Map and Q&ALearn Power BI with Power Pivot, Power Query, Power View, Power Map and Q&A
Learn Power BI with Power Pivot, Power Query, Power View, Power Map and Q&AVishal Pawar
 
Power BI: From the Basics
Power BI: From the BasicsPower BI: From the Basics
Power BI: From the BasicsNikkia Carter
 
vOffice365 - May 2016 - Overview of Microsoft's Power BI - Sean Wallbridge
vOffice365 - May 2016 - Overview of Microsoft's Power BI -  Sean WallbridgevOffice365 - May 2016 - Overview of Microsoft's Power BI -  Sean Wallbridge
vOffice365 - May 2016 - Overview of Microsoft's Power BI - Sean WallbridgeRegroove
 
Power bi (1)Power BI Online Training Hyderabad | power bi online training ben...
Power bi (1)Power BI Online Training Hyderabad | power bi online training ben...Power bi (1)Power BI Online Training Hyderabad | power bi online training ben...
Power bi (1)Power BI Online Training Hyderabad | power bi online training ben...Big IT Trainings
 
Power BI Technical Dive
Power BI Technical DivePower BI Technical Dive
Power BI Technical DiveBhavna K
 
High impact data visualization with power view, power map, and power bi
High impact data visualization with power view, power map, and power biHigh impact data visualization with power view, power map, and power bi
High impact data visualization with power view, power map, and power biHoàng Việt
 
What is Power BI
What is Power BIWhat is Power BI
What is Power BINaseeba P P
 
Microsoft Power BI 101
Microsoft Power BI 101Microsoft Power BI 101
Microsoft Power BI 101Sharon Weaver
 
Introduction to Microsoft Power BI
Introduction to Microsoft Power BIIntroduction to Microsoft Power BI
Introduction to Microsoft Power BIExilesoft
 
Bring your data to life with Power BI
Bring your data to life with Power BIBring your data to life with Power BI
Bring your data to life with Power BIMicrosoft Österreich
 
Leveraging Microsoft Power BI To Support Enterprise Business Intelligence
Leveraging Microsoft Power BI To Support Enterprise Business IntelligenceLeveraging Microsoft Power BI To Support Enterprise Business Intelligence
Leveraging Microsoft Power BI To Support Enterprise Business IntelligenceRightpoint
 
Introduction to Power BI a Business Intelligence Tool by Apurva Ramteke
Introduction to Power BI a Business Intelligence Tool by Apurva RamtekeIntroduction to Power BI a Business Intelligence Tool by Apurva Ramteke
Introduction to Power BI a Business Intelligence Tool by Apurva RamtekeApurva Ramteke
 

Tendances (20)

SYBIS - Power BI
SYBIS - Power BI SYBIS - Power BI
SYBIS - Power BI
 
Microsoft power bi
Microsoft power biMicrosoft power bi
Microsoft power bi
 
Power BI Made Simple
Power BI Made SimplePower BI Made Simple
Power BI Made Simple
 
Learn How to Use Microsoft Power BI for Office 365 to Analyze Salesforce Data
Learn How to Use Microsoft Power BI for Office 365 to Analyze Salesforce DataLearn How to Use Microsoft Power BI for Office 365 to Analyze Salesforce Data
Learn How to Use Microsoft Power BI for Office 365 to Analyze Salesforce Data
 
Learn Power BI with Power Pivot, Power Query, Power View, Power Map and Q&A
Learn Power BI with Power Pivot, Power Query, Power View, Power Map and Q&ALearn Power BI with Power Pivot, Power Query, Power View, Power Map and Q&A
Learn Power BI with Power Pivot, Power Query, Power View, Power Map and Q&A
 
Power BI: From the Basics
Power BI: From the BasicsPower BI: From the Basics
Power BI: From the Basics
 
Power bi overview
Power bi overview Power bi overview
Power bi overview
 
vOffice365 - May 2016 - Overview of Microsoft's Power BI - Sean Wallbridge
vOffice365 - May 2016 - Overview of Microsoft's Power BI -  Sean WallbridgevOffice365 - May 2016 - Overview of Microsoft's Power BI -  Sean Wallbridge
vOffice365 - May 2016 - Overview of Microsoft's Power BI - Sean Wallbridge
 
Power bi (1)Power BI Online Training Hyderabad | power bi online training ben...
Power bi (1)Power BI Online Training Hyderabad | power bi online training ben...Power bi (1)Power BI Online Training Hyderabad | power bi online training ben...
Power bi (1)Power BI Online Training Hyderabad | power bi online training ben...
 
Power BI Technical Dive
Power BI Technical DivePower BI Technical Dive
Power BI Technical Dive
 
High impact data visualization with power view, power map, and power bi
High impact data visualization with power view, power map, and power biHigh impact data visualization with power view, power map, and power bi
High impact data visualization with power view, power map, and power bi
 
What is Power BI
What is Power BIWhat is Power BI
What is Power BI
 
Power of power BI
Power of power BI Power of power BI
Power of power BI
 
Excel to Power BI
Excel to Power BIExcel to Power BI
Excel to Power BI
 
Microsoft Power BI 101
Microsoft Power BI 101Microsoft Power BI 101
Microsoft Power BI 101
 
Introduction to Microsoft Power BI
Introduction to Microsoft Power BIIntroduction to Microsoft Power BI
Introduction to Microsoft Power BI
 
Bring your data to life with Power BI
Bring your data to life with Power BIBring your data to life with Power BI
Bring your data to life with Power BI
 
Leveraging Microsoft Power BI To Support Enterprise Business Intelligence
Leveraging Microsoft Power BI To Support Enterprise Business IntelligenceLeveraging Microsoft Power BI To Support Enterprise Business Intelligence
Leveraging Microsoft Power BI To Support Enterprise Business Intelligence
 
Power bi
Power biPower bi
Power bi
 
Introduction to Power BI a Business Intelligence Tool by Apurva Ramteke
Introduction to Power BI a Business Intelligence Tool by Apurva RamtekeIntroduction to Power BI a Business Intelligence Tool by Apurva Ramteke
Introduction to Power BI a Business Intelligence Tool by Apurva Ramteke
 

Similaire à Summary of all tools and microsoft power bi

Power business intelligence
Power business intelligencePower business intelligence
Power business intelligenceaasthabadoniya1
 
LIBA++Lecture+Notes_Power+BI.docx.pdf
LIBA++Lecture+Notes_Power+BI.docx.pdfLIBA++Lecture+Notes_Power+BI.docx.pdf
LIBA++Lecture+Notes_Power+BI.docx.pdfDivya Thakur
 
Microsoft Power BI Overview
Microsoft Power BI OverviewMicrosoft Power BI Overview
Microsoft Power BI OverviewNetwoven Inc.
 
Sql server 2012_bi_overview_datasheet_apr2012
Sql server 2012_bi_overview_datasheet_apr2012Sql server 2012_bi_overview_datasheet_apr2012
Sql server 2012_bi_overview_datasheet_apr2012Dr. Wilfred Lin (Ph.D.)
 
Power BI by Lamees El-Ghazily.pptx
Power BI by Lamees El-Ghazily.pptxPower BI by Lamees El-Ghazily.pptx
Power BI by Lamees El-Ghazily.pptxLamees EL- Ghazoly
 
Powerbi 130926080957-phpapp02
Powerbi 130926080957-phpapp02Powerbi 130926080957-phpapp02
Powerbi 130926080957-phpapp02MILL5
 
Working with Microsoft Power Business Inteligence Tools - Presented by Atidan
Working with Microsoft Power Business Inteligence Tools - Presented by AtidanWorking with Microsoft Power Business Inteligence Tools - Presented by Atidan
Working with Microsoft Power Business Inteligence Tools - Presented by AtidanDavid J Rosenthal
 
Panorama Business Intelligence Solution
Panorama Business Intelligence SolutionPanorama Business Intelligence Solution
Panorama Business Intelligence Solutionwww.panorama.com
 
Microsoft Power Stack 2019 [Power BI, Excel, Azure & Friends]
Microsoft Power Stack 2019 [Power BI, Excel, Azure & Friends]Microsoft Power Stack 2019 [Power BI, Excel, Azure & Friends]
Microsoft Power Stack 2019 [Power BI, Excel, Azure & Friends]Olivier Travers
 
Business Intelligence in Excel 2013
Business Intelligence in Excel 2013Business Intelligence in Excel 2013
Business Intelligence in Excel 2013Stéphane Fréchette
 
Business Intelligence solutions using Excel 2013 and Power BI
Business Intelligence solutions using Excel 2013 and Power BIBusiness Intelligence solutions using Excel 2013 and Power BI
Business Intelligence solutions using Excel 2013 and Power BIAlan Koo
 
Power Platform Tools of Office 365 What to Use When
Power Platform Tools of Office 365 What to Use WhenPower Platform Tools of Office 365 What to Use When
Power Platform Tools of Office 365 What to Use WhenJoel Oleson
 
Powerbi presentation from Microsoft Corporation
Powerbi presentation from Microsoft CorporationPowerbi presentation from Microsoft Corporation
Powerbi presentation from Microsoft CorporationEngineerMBA1
 
Enabling Self Service Business Intelligence using Excel
Enabling Self Service Business Intelligenceusing ExcelEnabling Self Service Business Intelligenceusing Excel
Enabling Self Service Business Intelligence using ExcelAlan Koo
 
Powerbimadesimple 150206194215-conversion-gate01
Powerbimadesimple 150206194215-conversion-gate01Powerbimadesimple 150206194215-conversion-gate01
Powerbimadesimple 150206194215-conversion-gate01Zeeshan Ikram
 
Power Bi Dashboard for Data Analysis
Power Bi Dashboard for Data AnalysisPower Bi Dashboard for Data Analysis
Power Bi Dashboard for Data AnalysisIRJET Journal
 

Similaire à Summary of all tools and microsoft power bi (20)

Power business intelligence
Power business intelligencePower business intelligence
Power business intelligence
 
Power BI
Power BIPower BI
Power BI
 
LIBA++Lecture+Notes_Power+BI.docx.pdf
LIBA++Lecture+Notes_Power+BI.docx.pdfLIBA++Lecture+Notes_Power+BI.docx.pdf
LIBA++Lecture+Notes_Power+BI.docx.pdf
 
Microsoft Power BI Overview
Microsoft Power BI OverviewMicrosoft Power BI Overview
Microsoft Power BI Overview
 
Sql server 2012_bi_overview_datasheet_apr2012
Sql server 2012_bi_overview_datasheet_apr2012Sql server 2012_bi_overview_datasheet_apr2012
Sql server 2012_bi_overview_datasheet_apr2012
 
Power BI by Lamees El-Ghazily.pptx
Power BI by Lamees El-Ghazily.pptxPower BI by Lamees El-Ghazily.pptx
Power BI by Lamees El-Ghazily.pptx
 
Sap BusinessObjects 4
Sap BusinessObjects 4Sap BusinessObjects 4
Sap BusinessObjects 4
 
Powerbi 130926080957-phpapp02
Powerbi 130926080957-phpapp02Powerbi 130926080957-phpapp02
Powerbi 130926080957-phpapp02
 
Power BI
Power BIPower BI
Power BI
 
Working with Microsoft Power Business Inteligence Tools - Presented by Atidan
Working with Microsoft Power Business Inteligence Tools - Presented by AtidanWorking with Microsoft Power Business Inteligence Tools - Presented by Atidan
Working with Microsoft Power Business Inteligence Tools - Presented by Atidan
 
Panorama Business Intelligence Solution
Panorama Business Intelligence SolutionPanorama Business Intelligence Solution
Panorama Business Intelligence Solution
 
Microsoft Power Stack 2019 [Power BI, Excel, Azure & Friends]
Microsoft Power Stack 2019 [Power BI, Excel, Azure & Friends]Microsoft Power Stack 2019 [Power BI, Excel, Azure & Friends]
Microsoft Power Stack 2019 [Power BI, Excel, Azure & Friends]
 
DA Syllabus outline (2).pptx
DA Syllabus outline (2).pptxDA Syllabus outline (2).pptx
DA Syllabus outline (2).pptx
 
Business Intelligence in Excel 2013
Business Intelligence in Excel 2013Business Intelligence in Excel 2013
Business Intelligence in Excel 2013
 
Business Intelligence solutions using Excel 2013 and Power BI
Business Intelligence solutions using Excel 2013 and Power BIBusiness Intelligence solutions using Excel 2013 and Power BI
Business Intelligence solutions using Excel 2013 and Power BI
 
Power Platform Tools of Office 365 What to Use When
Power Platform Tools of Office 365 What to Use WhenPower Platform Tools of Office 365 What to Use When
Power Platform Tools of Office 365 What to Use When
 
Powerbi presentation from Microsoft Corporation
Powerbi presentation from Microsoft CorporationPowerbi presentation from Microsoft Corporation
Powerbi presentation from Microsoft Corporation
 
Enabling Self Service Business Intelligence using Excel
Enabling Self Service Business Intelligenceusing ExcelEnabling Self Service Business Intelligenceusing Excel
Enabling Self Service Business Intelligence using Excel
 
Powerbimadesimple 150206194215-conversion-gate01
Powerbimadesimple 150206194215-conversion-gate01Powerbimadesimple 150206194215-conversion-gate01
Powerbimadesimple 150206194215-conversion-gate01
 
Power Bi Dashboard for Data Analysis
Power Bi Dashboard for Data AnalysisPower Bi Dashboard for Data Analysis
Power Bi Dashboard for Data Analysis
 

Plus de Omar Khan

Design thinking fuels innovation
Design thinking fuels innovationDesign thinking fuels innovation
Design thinking fuels innovationOmar Khan
 
Strategic thinking for a digital age
Strategic thinking for a digital ageStrategic thinking for a digital age
Strategic thinking for a digital ageOmar Khan
 
Business intelligence competency centre strategy and road map
Business intelligence competency centre strategy and road mapBusiness intelligence competency centre strategy and road map
Business intelligence competency centre strategy and road mapOmar Khan
 
Visualize and explore your google analytics data with power bi
Visualize and explore your google analytics data with power biVisualize and explore your google analytics data with power bi
Visualize and explore your google analytics data with power biOmar Khan
 
Microsoft gets a life on sql and power bi
Microsoft gets a life on sql and power biMicrosoft gets a life on sql and power bi
Microsoft gets a life on sql and power biOmar Khan
 

Plus de Omar Khan (6)

Design thinking fuels innovation
Design thinking fuels innovationDesign thinking fuels innovation
Design thinking fuels innovation
 
Strategic thinking for a digital age
Strategic thinking for a digital ageStrategic thinking for a digital age
Strategic thinking for a digital age
 
Business intelligence competency centre strategy and road map
Business intelligence competency centre strategy and road mapBusiness intelligence competency centre strategy and road map
Business intelligence competency centre strategy and road map
 
Visualize and explore your google analytics data with power bi
Visualize and explore your google analytics data with power biVisualize and explore your google analytics data with power bi
Visualize and explore your google analytics data with power bi
 
Microsoft gets a life on sql and power bi
Microsoft gets a life on sql and power biMicrosoft gets a life on sql and power bi
Microsoft gets a life on sql and power bi
 
Data to d3
Data to d3Data to d3
Data to d3
 

Dernier

Apidays Singapore 2024 - Building Digital Trust in a Digital Economy by Veron...
Apidays Singapore 2024 - Building Digital Trust in a Digital Economy by Veron...Apidays Singapore 2024 - Building Digital Trust in a Digital Economy by Veron...
Apidays Singapore 2024 - Building Digital Trust in a Digital Economy by Veron...apidays
 
EIS-Webinar-Prompt-Knowledge-Eng-2024-04-08.pptx
EIS-Webinar-Prompt-Knowledge-Eng-2024-04-08.pptxEIS-Webinar-Prompt-Knowledge-Eng-2024-04-08.pptx
EIS-Webinar-Prompt-Knowledge-Eng-2024-04-08.pptxEarley Information Science
 
TrustArc Webinar - Stay Ahead of US State Data Privacy Law Developments
TrustArc Webinar - Stay Ahead of US State Data Privacy Law DevelopmentsTrustArc Webinar - Stay Ahead of US State Data Privacy Law Developments
TrustArc Webinar - Stay Ahead of US State Data Privacy Law DevelopmentsTrustArc
 
Histor y of HAM Radio presentation slide
Histor y of HAM Radio presentation slideHistor y of HAM Radio presentation slide
Histor y of HAM Radio presentation slidevu2urc
 
Advantages of Hiring UIUX Design Service Providers for Your Business
Advantages of Hiring UIUX Design Service Providers for Your BusinessAdvantages of Hiring UIUX Design Service Providers for Your Business
Advantages of Hiring UIUX Design Service Providers for Your BusinessPixlogix Infotech
 
2024: Domino Containers - The Next Step. News from the Domino Container commu...
2024: Domino Containers - The Next Step. News from the Domino Container commu...2024: Domino Containers - The Next Step. News from the Domino Container commu...
2024: Domino Containers - The Next Step. News from the Domino Container commu...Martijn de Jong
 
The 7 Things I Know About Cyber Security After 25 Years | April 2024
The 7 Things I Know About Cyber Security After 25 Years | April 2024The 7 Things I Know About Cyber Security After 25 Years | April 2024
The 7 Things I Know About Cyber Security After 25 Years | April 2024Rafal Los
 
Boost Fertility New Invention Ups Success Rates.pdf
Boost Fertility New Invention Ups Success Rates.pdfBoost Fertility New Invention Ups Success Rates.pdf
Boost Fertility New Invention Ups Success Rates.pdfsudhanshuwaghmare1
 
How to convert PDF to text with Nanonets
How to convert PDF to text with NanonetsHow to convert PDF to text with Nanonets
How to convert PDF to text with Nanonetsnaman860154
 
What Are The Drone Anti-jamming Systems Technology?
What Are The Drone Anti-jamming Systems Technology?What Are The Drone Anti-jamming Systems Technology?
What Are The Drone Anti-jamming Systems Technology?Antenna Manufacturer Coco
 
Mastering MySQL Database Architecture: Deep Dive into MySQL Shell and MySQL R...
Mastering MySQL Database Architecture: Deep Dive into MySQL Shell and MySQL R...Mastering MySQL Database Architecture: Deep Dive into MySQL Shell and MySQL R...
Mastering MySQL Database Architecture: Deep Dive into MySQL Shell and MySQL R...Miguel Araújo
 
Real Time Object Detection Using Open CV
Real Time Object Detection Using Open CVReal Time Object Detection Using Open CV
Real Time Object Detection Using Open CVKhem
 
Breaking the Kubernetes Kill Chain: Host Path Mount
Breaking the Kubernetes Kill Chain: Host Path MountBreaking the Kubernetes Kill Chain: Host Path Mount
Breaking the Kubernetes Kill Chain: Host Path MountPuma Security, LLC
 
From Event to Action: Accelerate Your Decision Making with Real-Time Automation
From Event to Action: Accelerate Your Decision Making with Real-Time AutomationFrom Event to Action: Accelerate Your Decision Making with Real-Time Automation
From Event to Action: Accelerate Your Decision Making with Real-Time AutomationSafe Software
 
08448380779 Call Girls In Greater Kailash - I Women Seeking Men
08448380779 Call Girls In Greater Kailash - I Women Seeking Men08448380779 Call Girls In Greater Kailash - I Women Seeking Men
08448380779 Call Girls In Greater Kailash - I Women Seeking MenDelhi Call girls
 
Handwritten Text Recognition for manuscripts and early printed texts
Handwritten Text Recognition for manuscripts and early printed textsHandwritten Text Recognition for manuscripts and early printed texts
Handwritten Text Recognition for manuscripts and early printed textsMaria Levchenko
 
🐬 The future of MySQL is Postgres 🐘
🐬  The future of MySQL is Postgres   🐘🐬  The future of MySQL is Postgres   🐘
🐬 The future of MySQL is Postgres 🐘RTylerCroy
 
How to Troubleshoot Apps for the Modern Connected Worker
How to Troubleshoot Apps for the Modern Connected WorkerHow to Troubleshoot Apps for the Modern Connected Worker
How to Troubleshoot Apps for the Modern Connected WorkerThousandEyes
 
Finology Group – Insurtech Innovation Award 2024
Finology Group – Insurtech Innovation Award 2024Finology Group – Insurtech Innovation Award 2024
Finology Group – Insurtech Innovation Award 2024The Digital Insurer
 
The Codex of Business Writing Software for Real-World Solutions 2.pptx
The Codex of Business Writing Software for Real-World Solutions 2.pptxThe Codex of Business Writing Software for Real-World Solutions 2.pptx
The Codex of Business Writing Software for Real-World Solutions 2.pptxMalak Abu Hammad
 

Dernier (20)

Apidays Singapore 2024 - Building Digital Trust in a Digital Economy by Veron...
Apidays Singapore 2024 - Building Digital Trust in a Digital Economy by Veron...Apidays Singapore 2024 - Building Digital Trust in a Digital Economy by Veron...
Apidays Singapore 2024 - Building Digital Trust in a Digital Economy by Veron...
 
EIS-Webinar-Prompt-Knowledge-Eng-2024-04-08.pptx
EIS-Webinar-Prompt-Knowledge-Eng-2024-04-08.pptxEIS-Webinar-Prompt-Knowledge-Eng-2024-04-08.pptx
EIS-Webinar-Prompt-Knowledge-Eng-2024-04-08.pptx
 
TrustArc Webinar - Stay Ahead of US State Data Privacy Law Developments
TrustArc Webinar - Stay Ahead of US State Data Privacy Law DevelopmentsTrustArc Webinar - Stay Ahead of US State Data Privacy Law Developments
TrustArc Webinar - Stay Ahead of US State Data Privacy Law Developments
 
Histor y of HAM Radio presentation slide
Histor y of HAM Radio presentation slideHistor y of HAM Radio presentation slide
Histor y of HAM Radio presentation slide
 
Advantages of Hiring UIUX Design Service Providers for Your Business
Advantages of Hiring UIUX Design Service Providers for Your BusinessAdvantages of Hiring UIUX Design Service Providers for Your Business
Advantages of Hiring UIUX Design Service Providers for Your Business
 
2024: Domino Containers - The Next Step. News from the Domino Container commu...
2024: Domino Containers - The Next Step. News from the Domino Container commu...2024: Domino Containers - The Next Step. News from the Domino Container commu...
2024: Domino Containers - The Next Step. News from the Domino Container commu...
 
The 7 Things I Know About Cyber Security After 25 Years | April 2024
The 7 Things I Know About Cyber Security After 25 Years | April 2024The 7 Things I Know About Cyber Security After 25 Years | April 2024
The 7 Things I Know About Cyber Security After 25 Years | April 2024
 
Boost Fertility New Invention Ups Success Rates.pdf
Boost Fertility New Invention Ups Success Rates.pdfBoost Fertility New Invention Ups Success Rates.pdf
Boost Fertility New Invention Ups Success Rates.pdf
 
How to convert PDF to text with Nanonets
How to convert PDF to text with NanonetsHow to convert PDF to text with Nanonets
How to convert PDF to text with Nanonets
 
What Are The Drone Anti-jamming Systems Technology?
What Are The Drone Anti-jamming Systems Technology?What Are The Drone Anti-jamming Systems Technology?
What Are The Drone Anti-jamming Systems Technology?
 
Mastering MySQL Database Architecture: Deep Dive into MySQL Shell and MySQL R...
Mastering MySQL Database Architecture: Deep Dive into MySQL Shell and MySQL R...Mastering MySQL Database Architecture: Deep Dive into MySQL Shell and MySQL R...
Mastering MySQL Database Architecture: Deep Dive into MySQL Shell and MySQL R...
 
Real Time Object Detection Using Open CV
Real Time Object Detection Using Open CVReal Time Object Detection Using Open CV
Real Time Object Detection Using Open CV
 
Breaking the Kubernetes Kill Chain: Host Path Mount
Breaking the Kubernetes Kill Chain: Host Path MountBreaking the Kubernetes Kill Chain: Host Path Mount
Breaking the Kubernetes Kill Chain: Host Path Mount
 
From Event to Action: Accelerate Your Decision Making with Real-Time Automation
From Event to Action: Accelerate Your Decision Making with Real-Time AutomationFrom Event to Action: Accelerate Your Decision Making with Real-Time Automation
From Event to Action: Accelerate Your Decision Making with Real-Time Automation
 
08448380779 Call Girls In Greater Kailash - I Women Seeking Men
08448380779 Call Girls In Greater Kailash - I Women Seeking Men08448380779 Call Girls In Greater Kailash - I Women Seeking Men
08448380779 Call Girls In Greater Kailash - I Women Seeking Men
 
Handwritten Text Recognition for manuscripts and early printed texts
Handwritten Text Recognition for manuscripts and early printed textsHandwritten Text Recognition for manuscripts and early printed texts
Handwritten Text Recognition for manuscripts and early printed texts
 
🐬 The future of MySQL is Postgres 🐘
🐬  The future of MySQL is Postgres   🐘🐬  The future of MySQL is Postgres   🐘
🐬 The future of MySQL is Postgres 🐘
 
How to Troubleshoot Apps for the Modern Connected Worker
How to Troubleshoot Apps for the Modern Connected WorkerHow to Troubleshoot Apps for the Modern Connected Worker
How to Troubleshoot Apps for the Modern Connected Worker
 
Finology Group – Insurtech Innovation Award 2024
Finology Group – Insurtech Innovation Award 2024Finology Group – Insurtech Innovation Award 2024
Finology Group – Insurtech Innovation Award 2024
 
The Codex of Business Writing Software for Real-World Solutions 2.pptx
The Codex of Business Writing Software for Real-World Solutions 2.pptxThe Codex of Business Writing Software for Real-World Solutions 2.pptx
The Codex of Business Writing Software for Real-World Solutions 2.pptx
 

Summary of all tools and microsoft power bi

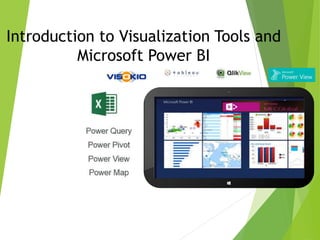
  • 1. Introduction to Visualization Tools and Microsoft Power BI
  • 2. Goal : Scalable and Efficient Create a user friendly data platform strategy which  Supports data volumes beyond the current Excel limits.  Supports automated web-based reporting delivery .  Provides an operational framework which increases efficiency. This promotes standardisation and empowers A&I to continue producing brilliant data work for clients 2
  • 3. Tool Set Excel 2013 Power BI Omniscope Tableau Qlikview 3 Power Pivot Power View
  • 4. What Platforms will we use to do what in the future 4 Reporting Dashboarding Standard report automation. Delivery of report in XL, direct update from Datamart. Ad-hoc data analysis on small data sets (up to 10MM cells). Not suitable for cross markets dashboards. Web-based dashboard up to 1BN cells / 1GB data. Suitable for cross markets dashboards. Web-based dashboard over 1BN cells/ 1GB data. Suitable for cross markets dashboards. Power Pivot + Datamart Omniscope Tableau + Datamart QlikView Web-based dashboard over 1BN cells/ 1GB data. Suitable for cross markets dashboards. PowerView
  • 5. A little bit more about each technology Omniscope is the dashboarding technology we have been using the most widely across MEC these last 4 years. It is an off the shelf application from Visokio. It allows to combine and clean data (Data Manager) as well as visualise the data. A great product we will carry on using for small scale implementations. For more info visit the Omniscope group on Planet MEC. 5 Omniscope PowerPivot is a free add-on to Excel 2010, providing an in-memory data engine capable of handling data volumes orders of magnitude larger than Excel alone. Data from the PowerPivot engine can be used in Excel reports via a pivot-like interface, and it provides the capability to seamlessly connect to a wide range of data sources including Datamart, SQL Server and many more. For more information visit http://www.microsoft.com/en-us/bi/powerpivot.aspx Tableau is a hybrid in-memory/on-disk dashboarding technology designed to provide a fast web-based user experience with support for much larger data volumes than Omniscope. Tableau consists of two core components: a desktop-based dashboard design tool and a server-based publishing and hosting engine. Tableau also provides a free visualisation tool (Tableau public) which is fully functional but limited to small datasets. GroupM currently provides a centralised Tableau Server which we will use initially. For more information visit http://www.tableausoftware.com/ Qlikview is an in-memory dashboarding technology designed to provide a rich, flexible dashboard experience via a web interface. Unlike Tableau, Qlikview does not consist of separate design and hosting components, but requires a skilled Qlikview developer to implement effectively. It supports the largest data volume of all the visualisation platforms we support, but at a significantly higher licence cost than Tableau or Omniscope. For more information visit http://www.qlikview.com/
  • 6. MSFT Visualization and Reporting Tools 6 How is an organization Positioned : With using present structure of tools available like Office 2013 professional pro versions(Some users already have office 2013 professional pro) and Add- in’s like power pivot and power query in Collaboration with Sharepoint 2010/2013 . MECGlobal provide easy-to-use information directly where individuals work, collaborate, and make decisions. This capability includes reporting, analysis, and performance management technologies that can improve business insight MECGlobal BI Solution with MSFT Tools
  • 7. Points to consider on how has Implementation of Power View and Excel services will improve efficiency: 7 • Power Pivot empowers users of all levels to access and mash up data from virtually any source. Users can create their own compelling reports and analytical applications, easily share insights, and collaborate with colleagues through Microsoft Excel and SharePoint. • Power View, provides SharePoint users with highly interactive, browser-based data exploration, visualization, and presentation capabilities. No dependency of the version of Office if power maps not used. • Microsoft SharePoint Server 2010 provides a full set of rich dashboard and scorecard capabilities including advanced filtering, guided navigation, interactive analytics and visualizations. • Browser-based mobile access to your corporate BI content is provided through Microsoft SharePoint Server 2010. Users can navigate existing reports, dashboards, scorecards, and analytical applications across iOS, Android, and Windows devices.
  • 8. Microsoft Power BI Deployment 75$ per internal User And FREE for external users 8 Licensing Basics Extranet/Power BI Current(2010) New (2013) Sharepoint Server plus CALs for both internal and External user Sharepoint Server 2013 plus CALs for internal users only • Extranet Scenario licensed through Sharepoint Server. No CALs required for external users, internal users need CALs • Internet Sites Scenario licensed through Sharepoint Server • External users means users that are not either your or your affiliates’ employees or your or your affiliates’ onsite contractors or onsite agents.
  • 9. What you need to get Started 9 Testing and Validation •Excel Data Visualization. Even if users will be developing their own independent Excel & Power View reports from your data model, they may find an Excel worksheet of data visualization to be very helpful to get started reporting on the underlying data model. •Excel Testing. Test the data model using Excel as the reporting tool. Because the data model and Excel data visualization are linked together via the Excel file, it’s very easy to iteratively go back and forth between windows to finalize the data model. •Power View Testing. Test the data model using Power View as the reporting tool (if you have SharePoint 2010/2013 and Power View available in your environment, or a business edition of Excel 2013).
  • 12. Power Query  Data discovery, data transformation and enrichment for the desktop to the Sharepoint. Easily discover, combine, and refine data for better analysis in Excel. 12 Import Data from External Sources Shape data from Multiple Sources Filter, Sort and Group Data Share and Manage Queries
  • 13. Analyse and Model using Power Pivot
  • 14. Power Pivot Power Pivot is a powerful data mashup and data exploration tool based on in-memory technologies providing unmatched analytical performance to process billions of rows at the speed of thought. 1. Work With Very Large Data Sets. 2. Combine Data From Different Sources 3. Create Visually Appealing Analytical Models for Reporting 4. Use DAX to Create Calculated Fields for Slicing and Dicing Data 5. Publish Reports to SharePoint 2010 6. PowerPivot needs an external data source, so isn’t a direct substitute for Access. It can, however, *use* Access as a data source. 7. PowerPivot is designed to work with data from multiple sources simultaneously.
  • 16. Power View Power View is a new tool for ad hoc reporting which provides an interactive data exploration, visualization, and presentation experience to the business users. Business users can quickly and easily create and interact with different views of data from different angles. Power View reports can be based on data models on PowerPivot workbooks or tabular models or multi dimensional models Multiple Views in a Single Slicers Cross Filter Other Report Slicers Show Items with No Data rather than Null value Print It! PDF Export Better Chart Features
  • 17. Power Map with Excel 2013 • Power Map. Power Map, previously known by the development name GeoFlow, is an add-in to Excel 2013 that provides still more compelling Bing Map powered visualizations, extending Power View’s capabilities with 3D map visualizations.
  • 18. Collaborate and stay connected with Sharepoint 2013 Benefit of using a Power BI site to store and share your workbooks is that workbooks on Power BI sites can be up to 500 megabytes
  • 19. Works on any Windows Tablet • Mobile BI Viewer. Microsoft has a native mobile viewing applications for visualizations created in Power View and published to Power BI sites called “ Microsoft Power BI”. The mobile components will meet the growing requirement to deliver BI visualizations to tablet devices.
  • 20. Ideal Power BI Scenario 1 Create a Power Pivot Model 2 Publish Power Pivot Model to Sharepoint 3 Analyse the model using Power view Easy to Share 4 Sharepoint Users