SlideShare a Scribd company logo
1 of 19
Download to read offline
Chapter 19B. Analysis of Imaging Spectrometer Data for the
Dudkash Area of Interest
By Raymond F. Kokaly and Michaela R. Johnson


Abstract
        Imaging spectrometer data collected over the Dudkash area of interest (AOI) in northeastern
Afghanistan were analyzed with spectroscopic methods to identify the occurrence of selected materials
at the surface. Absorption features in the spectra of HyMap data were compared to a reference library of
spectra of known materials. Carbonates and muscovites cover most of the Dudkash AOI. Distinct
patterns of kaolinite occur in localized patterns, especially in the center of the AOI. An analysis of
HyMap data to detect gypsum found only a few pixels containing this mineral, adjacent to the mapped
locations of the bedded gypsum mineral deposit of Shuraw. The known coal deposits in the Dudkash
AOI appear to be associated with areas of kaolinite, kaolinite mixed with muscovite/clay/calcite, and
calcite mixed with muscovite/illite. This pattern was also observed in preliminary analysis of imaging
spectrometer data for the Takhar AOI. The limestone host rock of celestite was detected; however, more
detailed studies of the spectral characteristics of the celestite deposit and its host rocks are needed in
order to characterize the resource using imaging spectrometer data.

19B.1 Introduction
        Past studies of geologic data of Afghanistan revealed numerous areas with indications of
potential mineral resources of various types (Peters and others, 2007; Abdullah and others, 1977).
Several of these areas were selected for follow-on studies using imaging spectroscopy to characterize
surface materials. Imaging spectroscopy is an advanced type of remote sensing that is also known as
hyperspectral remote sensing. One of those areas selected for follow-on studies is the Dudkash area of
interest (AOI) in northeastern Afghanistan, which is approximately 160 km north of Kabul (fig. 19B–1).
The area is believed to have the potential for gypsum and celestite. To help assess these potential
resources, high-resolution imaging spectrometer data were analyzed to detect the presence of selected
minerals that may be indicative of past mineralization processes. This report contains the results of the
spectroscopic data analyses and identifies sites within the Dudkash AOI that deserve further
investigation, especially detailed geological mapping, lithologic sampling, and geochemical studies.

19B.2     Data Collection and Processing
        In 2007, imaging spectrometer data were acquired over most of Afghanistan as part of the
U.S. Geological Survey (USGS) project "Oil and Gas Resources Assessment of the Katawaz and
Helmand Basins.” These data were collected to characterize surface materials in support of assessments
of resources (coal, water, minerals, and oil and gas) and earthquake hazards in the country (King and
others, 2010). Imaging spectrometers measure the reflectance of visible and near-infrared light from the
Earth’s surface in many narrow channels, producing a reflectance spectrum for each image pixel. These
reflectance spectra can be interpreted to identify absorption features that arise from specific chemical
transitions and molecular bonds that provide compositional information about surface materials.
Imaging spectrometer data can only be used to characterize the upper surface materials and not
subsurface composition or structure. However, subsurface processes can be indicated by the distribution
of surface materials.
Figure 19B–1. Index map of the Dudkash area of interest in northeastern Afghanistan.

19B.2.1 Collection of Imaging Spectrometer Data
        The HyMap imaging spectrometer (Cocks and others, 1998) was flown over Afghanistan from
August 22 to October 2, 2007 (Kokaly and others, 2008). HyMap has 512 cross-track pixels and covers
the wavelength range 0.43 to 2.48 microns (µm) in 128 channels. The imaging spectrometer was flown
on a WB-57 high-altitude aircraft at approximately 50,000 ft. There were 207 standard data flight lines
and 11 cross-cutting calibration lines collected over Afghanistan for a total of 218 flight lines, covering
a surface area of 438,012 km2 (Kokaly and others, 2008). Data were received in scaled radiance
(calibrated to National Institute of Standards and Technology reference materials). Before processing,
four channels that had low signal-to-noise and (or) were in wavelength regions that overlapped between
detectors were removed from the HyMap data. Each flight line was georeferenced to Landsat base
imagery in UTM projection (Davis, 2007).

19B.2.2 Calibration
        HyMap data were converted from radiance to reflectance using a multistep process. This
calibration process removed the influence of the solar irradiance function, atmospheric absorptions, and
residual instrument artifacts, resulting in reflectance spectra that have spectral features that arise from
the material composition of the surface. Because of the extreme topographic relief and restricted access
to ground calibration sites, modifications to the typical USGS calibration procedures were required to
calibrate the 2007 Afghanistan HyMap dataset (Hoefen and others, 2010). In the first step of the
calibration process, the radiance data were converted to apparent surface reflectance using the radiative
                                    Chapter 19B. Analysis of Imaging Spectrometer Data for the Dudkash Area of Interest   1383
transfer correction program Atmospheric CORrection Now (ACORN; ImSpec LLC, Palmdale, Calif.).
ACORN was run multiple times for each flight line, using average elevations in 100-m increments,
covering the range of minimum to maximum elevation within the flight line. A single atmospherically
corrected image was assembled from these elevation-incremented ACORN results. This was done by
determining the elevation of each HyMap pixel and selecting the atmospherically corrected pixel from
the 100-m increment closest to that elevation.
         Each assembled atmospherically corrected image was further empirically adjusted using ground-
based reflectance measurements from a ground calibration site. Spectra of five ground calibration sites
were collected in Afghanistan: Kandahar Air Field, Bagram Air Base, and Mazar-e-Sharif Airport, as
well as soil samples from two fallow fields in Kabul. These were used to calculate empirical correction
factors using the pixels of atmospherically corrected HyMap data in the flight lines that passed over the
sites. The empirical correction from the closest calibration site to each flight line was applied.
         To further improve data quality, an additional calibration step was taken to address the
atmospheric differences caused, in part, by the large distances from calibration sites to where the
HyMap data were acquired. The large distances were a result of the lack of safe access to ground
calibration sites. The duration of the airborne survey and variation in time of day when flight lines were
acquired also resulted in differences in atmospheric conditions between standard flight lines and lines
over ground calibration sites, which were used to derive the empirical correction factors. During the
time of data collection, sun angle, atmospheric water vapor, and atmospheric scattering differed for each
flight line. To compensate for this, cross-cutting calibration flight lines over the ground calibration areas
were acquired (Kokaly and others, 2008) and used to refine data quality of standard data lines. A
multiplier correction for each standard data line, typically oriented north-south, was derived using the
pixels of overlap with the well-calibrated cross-cutting line that intersected it, subject to slope,
vegetation cover, and other restrictions on pixel selection (Hoefen and others, 2010). As a result, the
localized cross-calibration multiplier, derived from the overlap region, corrected residual atmospheric
contamination in the imaging spectrometer data that may have been present after the ground calibration
step.

19B.2.3 Materials Maps and Presentation
        After undergoing a complex and rigorous data calibration process, the georeferenced and
calibrated reflectance data were analyzed using the Material Identification and Characterization
Algorithm (MICA), a module of the USGS Processing Routines in IDL (Interactive Data Language) for
Spectroscopic Measurements (PRISM) software (Kokaly, 2011). The MICA analysis compared the
reflectance spectrum of each pixel of HyMap data to entries in a reference spectral library of minerals,
vegetation, water, and other materials. The HyMap data were compared to 97 reference spectra of
well-characterized mineral and material standards. The best spectral match to each pixel was determined
and the results were clustered into classes of materials discussed below. The resulting maps of material
distribution, resampled to a 23 × 23 m square pixel grid, were mosaicked to create thematic maps of
surface mineral occurrences over the full dataset covering Afghanistan.
        MICA was applied to HyMap data twice in order to present the distribution of two categories of
minerals that are naturally separated in the wavelength regions of their primary absorption features.
MICA was applied using the subset of minerals with absorption features in the visible and near-infrared
wavelength region, producing a 1-µm map of iron-bearing minerals and other materials (King and
others, 2011), and MICA was applied again using the subset of minerals with absorption features in the
shortwave infrared, producing a 2-µm map of carbonates, phyllosilicates, sulfates, altered minerals, and
other materials (Kokaly and others, 2011). For clarity of presentation, some individual classes in these
two maps were bundled by combining selected mineral types (for example, all montmorillonites or all
kaolinites) and representing them with the same color in order to reduce the number of colors required to
represent the mineral classes.


1384   Summaries of Important Areas for Mineral Investment and Production Opportunities of Nonfuel Minerals in Afghanistan
The iron-bearing minerals map has 27 identified classes. Iron-bearing minerals with different
mineral compositions but similar broad spectral features are difficult to classify as specific mineral
species. Thus, generic spectral classes, including several minerals with similar absorption features, such
as Fe3+ type 1 and Fe3+ type 2, are depicted on the map. The carbonates, phyllosilicates, sulfates, and
altered minerals map has 31 identified classes. Minerals with slightly different mineral compositions but
comparable spectral features are less easily discriminated; thus, some identified classes consist of
several minerals with similar spectra, such as the chlorite or epidote class. When comparisons with
reference spectra resulted in no viable match, a designation of “not classified” was assigned to the pixel.

19B.3 Geologic Setting of the Dudkash AOI
        The Dudkash AOI is mainly within the Baghlan Province in northeast Afghanistan, but the
northeast part of it lies within Kunduz and Takhar provinces. The contrast-enhanced stretch of the
natural-color composite of Landsat Thematic Mapper bands in figure 19B–2 provides a general
overview of the Dudkash AOI terrain and is useful for understanding the general characteristics and
distribution of surficial material including rocks and soil, unconsolidated sediments, vegetation, and
hydrologic features.

19B.3.1 Topography
        Elevations in the Dudkash AOI range between 474 and 4,087 m (fig. 19B–3). The highest areas
are in the northeast corner of the Dudkash AOI in sharply defined mountain ranges and foothills that are
commonly controlled by faults. The low areas include large agricultural areas in the central and north-
central parts of the AOI around the district center of Pul-i-Khumry and the province capitol of Baghlan.
Other population centers include the towns of Nahrin in the east and Dushi in the south.

19B.3.2 Lithology and Structure
        The oldest rocks in the Dudkash AOI are Middle Proterozoic greenschists, gneiss, quartzite,
marble, and amphibolite, exposed in the south-central portion of the area (fig. 19B–4; Abdullah and
Chmyriov, 1977; Doebrich and others, 2006). Ordovician sandstones and shales and Silurian–Devonian
limestones and dolomites are exposed at the higher elevations along the southeastern edge of the area;
however, most of the Dudkash AOI is covered by younger rocks. Lower elevation areas are covered by
Paleocene and Late Cretaceous limestones, sandstones, siltstones, and clays, with small occurrences of
Eocene rocks of similar type. Lowest elevations are covered by Miocene clays and limestones and
Quaternary surficial deposits. Mississippian diorite, granodiorites, and granites and Late Triassic granitic
rocks intrude Namurian-stage (Carboniferous), Ordovician, and Silurian–Devonian strata along the
southeastern edge of the Dudkash AOI.

19B.3.3 Known Mineralization
        Figure 19B–5 shows 12 locations where mineralization with a potential for mineral resource
development may exist (Peters and others, 2007). A number of different types of mineral deposits,
particularly strontium-bearing celestite and gypsum deposits are present within the Dudkash AOI. The
mineralogical characteristics of the mineralized locations are summarized in table 19B–1. Clay and
limestone resources and showings of copper (Cu) and zinc (Zn) are also indicated as occurring in the
AOI.
        Celestite in the Tangi-Murch deposit is hosted in bituminous limestone. Paleogene carbonate
rocks crop out in the area (Abdullah and others, 1977). Beds as much as 170 m long with thicknesses
from 0.4 to 1.67 m are indicated (Abdullah and others, 1977).
        Bedded gypsum (Dudkash Gypsum) has been found in beds as much as 6 m thick with
extensions as much as 12 km in an Upper Jurassic sequence (Abdullah and others, 1977). Gypsum beds
at the Shuraw mineral occurrence are 1 m thick and occur in Jurassic sandstone and clay (Abdullah and
others, 1977).

                                   Chapter 19B. Analysis of Imaging Spectrometer Data for the Dudkash Area of Interest   1385
Paleocene limestone beds at the Pul-i-Khumry mineral occurrence have been exploited for raw
material for a nearby cement plant. The rock is light-colored, thick-bedded, fine-crystalline and found in
beds 300 to 400 m thick exposed over an area of several thousand square kilometers (Abdullah and
others, 1977).


Figure 19B–2. Contrast-enhanced Landsat Thematic Mapper natural-color image of the Dudkash area of
interest.

19B.4 Mineral Maps of the Dudkash Area of Interest
       Analysis of the HyMap imaging spectrometer data of the Dudkash AOI using spectroscopic
methods resulted in the identification of a wide variety of minerals exposed at the surface. Although the
occurrence of certain minerals may suggest that mineralization processes may have once operated in the
area, many of the minerals that were identified are also common rock-forming minerals or minerals that
1386   Summaries of Important Areas for Mineral Investment and Production Opportunities of Nonfuel Minerals in Afghanistan
can be derived from the weathering of a wide variety of rock types. Consequently, the distribution
patterns of the identified minerals and the geologic context in which they occur are extremely important
in understanding the causes of mapped mineral occurrences and evaluating the possible potential for
related mineral deposits.
        Figure 19B–6 depicts the results of the MICA analyses of the HyMap data for the Dudkash AOI
for the 2-µm wavelength materials, which include clays, carbonates, phyllosilicates, sulfates, altered
minerals and other materials. Figure 19B–7 shows the results for the iron-bearing minerals. The
carbonates cover most of the Dudkash AOI, mostly indicated by pixels containing calcite and calcite
mixed with clay/mica. However, pixels matched to pure muscovite spectra occur over large contiguous
areas both within mapped boundaries of intrusive units but also outside the boundaries and in other
areas. Distinct patterns of kaolinite clays occur in localized patterns, especially in the center of the AOI.
Epidote and chlorite were found in spatially consistent patterns in the northeast and were especially
concentrated near the southern corner of the AOI (see fig. 19B–6). Strong gypsum signatures were only
found in three pixels in the 2-µm material mapping.
        Because of the large number of classes represented and the subtleties of the distribution patterns
represented in these image maps, it is instructive to display these results as a series of image maps each
depicting a selected group of minerals that are mineralogically related or commonly occur together in
special geologic environments (figs. 19B–8 to 19B–12). Figure 19B–8 shows the distribution of
carbonate minerals in the Dudkash AOI, whereas figure 19B–9 shows where clay minerals and micas
occur. The distribution of iron oxide and hydroxide minerals are displayed in figure 19B–10. Minerals
commonly found in hydrothermally altered rocks are mapped in figure 19B–11 and secondary minerals
often associated with mineralized and (or) weathered rocks are mapped in figure 19B–12.

19B.4.1 Carbonate Minerals
         Carbonate minerals, either calcite or dolomite, were mapped over a large majority of the
Dudkash AOI (fig. 19B–8). In general, calcite is mapped within every geologic unit. Dolomite mixed
with calcite and (or) clay occurs in a less spatially extensive pattern, but does occur in localized
concentrations and in linear patterns 4 to 8 km in length. None of the known mineralized areas are
highlighted by the carbonate minerals map. Because of the ubiquitous nature of carbonate, the Pul-i-
Khumry area of limestone mineralization is not uniquely identified, but does occur within a large area of
pixels mapped as matching the strong absorption features of abundant calcite. The Dudkash Stone
mineral occurrence is found in an area of concentrations of pixels that were matched to dolomite +
calcite and clay, consistent with the expected dolomite mineralogy for this fluxstone. The Dudkash Lime
mineral deposit is found in an area of pixels that mapped as kaolinite + calcite, calcite + clay, and
calcite, consistent with the description of the deposit as limestone beds that crop out between Jurassic
clays and siltstones (Abdullah and others, 1977).

19B.4.2 Clays and Micas
        Abundant muscovites were detected in the mapped units of Mississippian and Late Triassic
intrusive rocks near the town of Dushi in the southwest part of the Dudkash AOI (fig. 19B–9). In
addition, muscovites were also found distributed within nearby Silurian and Jurassic stratified rock
units, suggesting that mineral distributions detected with HyMap data could help in the refinement of
lithologic contacts. Muscovite was found with strong spectral signatures and spatially coherent patterns
in association with Namurian stage stratified rock units. Kaolinites were distributed mostly in Lower to
Middle Jurassic units both in the central area of the AOI and near the town of Nahrin, with additional
occurrences of spatially consistent groups of pixels in adjacent Early Cretaceous and Late Jurassic units,
similar in distribution to the kaolinites in the Takhar AOI (Kokaly and Johnson, chap. 26, this volume).
The occurrences of Kaukpar bentonite and Surkhab clay are not near any large areas of mapped
montmorillonite, although the pixels around the indicated locations contain a mixture of carbonates and
clays.

                                    Chapter 19B. Analysis of Imaging Spectrometer Data for the Dudkash Area of Interest   1387
Figure 19B–3. Elevations and topography of the Dudkash area of interest.

19B.4.3 Iron Oxides and Hydroxides
       Conspicuous areas of hematite are found in the center of the Dudkash AOI (fig. 19B–10) in an
early Cretaceous unit, the description of which includes red sandstones as rocks that occur within the
unit (Abdullah and Chmyriov, 1977; Doebrich and others, 2006). Large concentrations of hematite also
appear along the eastern part of the northern edge of the AOI in early Miocene and Eocene units.
Goethite andiron hydroxide are more widespread across the AOI compared to hematite. Similar to the
2-µm class of epidote or chlorite, the 1-µm epidote class is found in the southwest part of the AOI.


1388   Summaries of Important Areas for Mineral Investment and Production Opportunities of Nonfuel Minerals in Afghanistan
Figure 19B–4. Geologic map of the Dudkash area of interest from digital geologic map of Afghanistan (Abdullah
and Chmyriov, 1977; Doebrich and others, 2006).

19B.4.4 Common Alteration Minerals
        Most of the minerals in this group are commonly present in hydrothermally altered rocks
associated with epithermal mineral deposits (fig. 19B–11). Consequently, where they occur in distinct
clusters is of great interest in terms of potential mineral deposits. However, the mineral distributions do
not occur in distributions that are suggestive of such alteration in the Dudkash AOI.

19B.4.5 Common Secondary Minerals
        Secondary minerals, in the epidote and chlorite or epidote classes (fig. 19B–12), occur mostly
along the southern edge of the Dudkash AOI, near the town of Dushi. In addition, there are
concentrations of pixels matched to the epidote and chlorite or epidote classes in the northeast part of the
Dudkash AOI, northeast of the town of Nahrin. In both these areas, epidote and chlorite are mapped
within Namurian stage and Mississippian stratified rocks, similar to the distributions of epidote and
chlorite pixels in rocks of these ages in the Takhar AOI (Kokaly and Johnson, chap. 26B of this report).

19B.4.6 Gypsum
       A MICA analysis using only gypsum in the reference spectral library was conducted to expand
the mapping of gypsum for greater detail. However, that resulted in only a few isolated, small
concentrations of gypsum being detected in the Dudkash area. A grouping of four pixels containing
                                    Chapter 19B. Analysis of Imaging Spectrometer Data for the Dudkash Area of Interest   1389
gypsum was found near the Shuraw mineral deposit, surrounded by pixels containing montmorillonite
and calcite + clay, consistent with the mineral deposit description (Abdullah and others, 1977). Gypsum
was not detected near the Dudkash Gypsum mineral deposit, although that site was located near pixels
containing kaolinite and calcite and unmapped pixels in a pattern consistent with Chal, Chal-I, and
Chal-II gypsum and salt deposits in the Takhar AOI (Kokaly and Johnson, chap. 26, this volume).


Figure 19B–5. Sites of known mineralization by deposit type (Peters and others, 2007) on the geologic map of the
Dudkash area of interest from digital geologic map of Afghanistan (Abdullah and Chmyriov, 1977; Doebrich and
others, 2006).

Table 19B–1. Sites of known mineralization in the Dudkash area of interest.
[Data are from Peters and others (2007). nd, no data]
                                     Major
     Name         Deposit type                     Deposit size, description                Alteration            Mineralogy   Gangue
                                  commodity
Kaukpar         Sedimentary Brick clay Small, thickness: 11 to 17 m                   nd                     nd                nd
                   bentonite
Surkhab         Unknown clay Brick clay Small                                         nd                     nd                nd
Shenivaghur Unknown stoneBuilding             Small, thickness: 80 m, extent: 1       nd                     nd                nd
                                   stone         km
Unnamed         Unknown         Copper        Showing                                 nd                     Sulfides          nd
                   copper
Unnamed         Unclassified Copper           Showing, 0.1 x 2 m                      nd                     Copper sulfides nd


1390    Summaries of Important Areas for Mineral Investment and Production Opportunities of Nonfuel Minerals in Afghanistan
Major
    Name       Deposit type                Deposit size, description                     Alteration           Mineralogy    Gangue
                            commodity
Dudkash stone Unknown stoneFluxstone Small, thickness: 3.9 m                       nd                    Dolomite           nd
Shuraw        Bedded       Gypsum     Occurrence, thickness: 1 m                   nd                    Gypsum             nd
                gypsum
Dudkash       Bedded       Gypsum     Occurrence, thickness: 1.5 to 2 m            nd                    Gypsum             nd
  gypsum        gypsum                  (occasionally
                                        up to 6 m), extent: up to 12 km
Dudkash lime Limestone     Limestone Small, thickness: 30 m                        nd                    nd                 nd
Pul-i-Khumry Limestone     Limestone Small, thickness: 300 to 500 m,               nd                    nd                 nd
                                        area: a few
                                        thousand m2
Unnamed       Polymetallic Zinc       Showing, thickness: 0.5 m                    Quartz alteration;    Chalcopyrite;      Quartz
                vein                                                                  silicification;      galena;
                                                                                      limonitization       malachite
Tangi-Murch   Bedded          Celestite      Small, thickness: 0.4 to 1.67 m,      nd                    Celestite          nd
                celestite                      extent: up to 170 m

19B.4.7 Coal
        Direct detection of coal was not attempted using spectral feature analysis of imaging
spectrometer data, due to coal’s lack of diagnostic absorption features. A comparison of the 2-µm map
of materials, which includes clays, carbonates, phyllosilicates, sulfates, and altered minerals, to known
occurrences of coal (Abdullah and others, 1977) and the Lower to Middle Jurassic geologic unit
associated with coal is shown in figure 19B–13. The known coal deposits appear to be associated with
areas of kaolinite, kaolinite mixed with muscovite/clay/calcite, and calcite mixed with muscovite/illite.
This pattern of minerals detected in the HyMap data within and around the Lower to Middle Jurassic
geologic unit is the same pattern observed in the Takhar AOI (Kokaly and Johnson, chap. 26, this
volume). Given this indication, further study of these associations and refinement of HyMap analysis
using spectral measurements of field samples of surface materials common to the known coal resources
is warranted.

19B.4.8 Celestite
        Celestite was not included as a reference material in the 1-µm or 2-µm MICA analyses of
imaging spectrometer data. An examination of the 2-µm map of materials, which includes clays,
carbonates, phyllosilicates, sulfates, and altered minerals, to the location of the Tangi-Murch celestite
deposit (Abdullah and others, 1977) revealed the site to be surrounded by pixels that mapped as calcite.
This is consistent with the deposit description as celestite hosted by bituminous limestone and
surrounded by carbonate rocks. As described previously, calcite is the most abundantly mapped mineral
in the area and, therefore, additional understanding of the spectral characteristics of the celestite mineral
and the deposit need to be developed in order to derive methods to differentiate the deposit from other
limestones and calcite-bearing rocks.

19B.5 Summary
        Carbonate minerals cover most of the Dudkash AOI. Muscovites were detected in greatest
concentration in the mapped units of Mississippian and Late Triassic intrusive rocks in the southwest
part of the Dudkash AOI and in the adjacent units, suggesting that mineral distributions detected with
HyMap data could help in the refinement of lithologic contacts. Epidote and chlorite were found in
spatially consistent patterns near the southern edge of the AOI in association with Namurian stage and
Mississippian stratified rock units, also suggesting the mineral classes derived from imaging
spectrometer data is revealing subdivisions in the mapped unit. Distinct patterns of kaolinite clays and
gypsum occur in localized patterns, especially in the center of the AOI. Kaolinites were distributed
mostly in Early and Middle Jurassic units, with additional occurrences of spatially consistent groups of
pixels in Late Jurassic and Late Cretaceous units. In the center of the Dudkash AOI, kaolinite is found in

                                          Chapter 19B. Analysis of Imaging Spectrometer Data for the Dudkash Area of Interest    1391
association with the Dudkash bedded gypsum mineral deposit. The spectral signature of gypsum was
detected in the HyMap data in just a few pixels, some of which were adjacent to the mapped locations of
the bedded gypsum mineral occurrence of Shuraw. Within and around rocks of Early to Middle Jurassic
age, the known coal deposits appear to be associated with pixels in which kaolinite mixed with other
materials was mapped in the HyMap data, an association also observed in the Takhar AOI (Kokaly and
Johnson, chap. 26, this volume). Given these indications, more detailed analysis of HyMap data around
these coal occurrences may help characterize and refine the distribution of this resource. The limestone
host rock of celestite was detected; however, more detailed studies of the spectral characteristics of the
celestite deposit and its host rocks are needed in order to characterize the resource and map its
distribution using the HyMap imaging spectrometer data covering the Dudkash AOI.


Figure 19B–6. Map of carbonates, phyllosilicates, sulfates, altered minerals, and other materials derived from
HyMap data in the Dudkash area of interest.


1392   Summaries of Important Areas for Mineral Investment and Production Opportunities of Nonfuel Minerals in Afghanistan
Figure 19B–7. Map of iron-bearing minerals and other materials derived from HyMap data in the Dudkash area of
interest.


                                    Chapter 19B. Analysis of Imaging Spectrometer Data for the Dudkash Area of Interest   1393
Figure 19B–8. Map of distribution of carbonate minerals derived from HyMap data in the Dudkash area of
interest.


1394   Summaries of Important Areas for Mineral Investment and Production Opportunities of Nonfuel Minerals in Afghanistan
Figure 19B–9. Map of distribution of clay and mica minerals derived from HyMap data in the Dudkash area of
interest.


                                    Chapter 19B. Analysis of Imaging Spectrometer Data for the Dudkash Area of Interest   1395
Figure 19B–10. Map of distribution of iron oxide and hydroxide derived from HyMap data in the Dudkash area of
interest.


1396   Summaries of Important Areas for Mineral Investment and Production Opportunities of Nonfuel Minerals in Afghanistan
Figure 19B–11. Map of distribution of common alteration minerals derived from HyMap data in the Dudkash area
of interest.


                                    Chapter 19B. Analysis of Imaging Spectrometer Data for the Dudkash Area of Interest   1397
Figure 19B–12. Map of distribution of common secondary minerals derived from HyMap data in the Dudkash area
of interest.


1398   Summaries of Important Areas for Mineral Investment and Production Opportunities of Nonfuel Minerals in Afghanistan
Figure 19B–13. Map of carbonates, phyllosilicates, sulfates, altered minerals, and other materials derived from
HyMap data in relation to known coal occurrences (Abdullah and others, 1977) in the Dudkash area of interest.

19B.6 References Cited
Abdullah, Sh., and Chmyriov, V.M., 1977, Geological map of Afghanistan: Kabul, Afghanistan,
 Ministry of Mining and Industry of the Democratic Republic of Afghanistan, scale 1:500,000.
Abdullah, Sh., Chmyriov, V.M., Stazhilo-Alekseev, K.F., Dronov, V.I., Gannan, P.J., Rossovskiy, L.N.,
 Kafarskiy, A.Kh., and Malyarov, E.P., 1977, Mineral resources of Afghanistan (2d ed.): Kabul,
 Afghanistan, Republic of Afghanistan Geological and Mineral Survey, 419 p.
Cocks, T., Jenssen, R., Stewart, A., Wilson, I., and Shields, T., 1998, The HyMap airborne hyperspectral
 sensor—The system, calibration and performance, in Schaepman, M., Schlapfer, D., and Itten, K.I.,
 eds., Proceedings of the 1st EARSeL Workshop on Imaging Spectroscopy, 6–8 October 1998, Zurich:
 Paris, European Association of Remote Sensing Laboratories, p. 37–43.
Davis, P.A., 2007, Landsat ETM+ false-color image mosaics of Afghanistan: U.S. Geological Survey
 Open-File Report 2007–1029, 22 p. (Also available at http://pubs.usgs.gov/of/2007/1029/.)
Doebrich, J.L., and Wahl, R.R., comps., with contributions by Doebrich, J.L., Wahl, R.R., Ludington,
 S.D., Chirico, P.G., Wandrey, C.J., Bohannon, R.G., Orris, G.J., Bliss, J.D., Wasy, Abdul, and
 Younusi, M.O., 2006, Geologic and mineral resource map of Afghanistan: U.S. Geological Survey
 Open File Report 2006–1038, scale 1:850,000, available at http://pubs.usgs.gov/of/2006/1038/.


                                     Chapter 19B. Analysis of Imaging Spectrometer Data for the Dudkash Area of Interest   1399
Hoefen, T.M., Kokaly, R.F., and King, T.V.V., 2010, Calibration of HyMap data covering the country
  of Afghanistan, in Proceedings of the 15th Australasian Remote Sensing and Photogrammetry
  Conference, Alice Springs, Australia, September 12–17, 2010, p. 409, available at
  http://dl.dropbox.com/u/81114/15ARSPC-Proceedings.zip/.
King, T.V.V., Kokaly, R.F., Hoefen, T.M., and Knepper, D.H., 2010, Resource mapping in Afghanistan
  using HyMap data, in Proceedings of the 15th Australasian Remote Sensing and Photogrammetry
  Conference, Alice Springs, Australia, September 12–17, 2010, p. 500, available at
  http://dl.dropbox.com/u/81114/15ARSPC-Proceedings.zip/.
King, T.V.V., Kokaly, R.F., Hoefen, T.M., Dudek, K. and Livo, K.E., 2011, Surface materials map of
  Afghanistan—Iron-bearing minerals and other materials: U.S. Geological Survey Scientific
  Investigations Map 3152–B.
Kokaly, R.F., King, T.V.V., and Livo, K.E., 2008, Airborne hyperspectral survey of Afghanistan 2007:
  Flight line planning and HyMap data collection: U.S. Geological Survey Open-File Report
  2008–1235, 14 p.
Kokaly, Ray, 2011, PRISM—Processing routines in IDL for spectroscopic measurements:
  U.S. Geological Survey Open-File Report 2011–1155, available at http://pubs.usgs.gov/of/2011/1155/.
Kokaly, R.F., King, T.V.V., Hoefen, T.M., Dudek, K. and Livo, K.E., 2011, Surface materials map of
  Afghanistan—Carbonates, phyllosilicates, sulfates, altered minerals, and other materials:
  U.S. Geological Survey Scientific Investigations Map 3152–A.
Peters, S.G., Ludington, S.D., Orris, G.J., Sutphin, D.M., Bliss, J.D., and Rytuba, J.J., eds., and the
  U.S. Geological Survey-Afghanistan Ministry of Mines Joint Mineral Resource Assessment Team,
  2007, Preliminary non-fuel mineral resource assessment of Afghanistan: U.S. Geological Survey
  Open-File Report 2007–1214, 810 p., 1 CD–ROM. (Also available at
  http://pubs.usgs.gov/of/2007/1214/.)


1400   Summaries of Important Areas for Mineral Investment and Production Opportunities of Nonfuel Minerals in Afghanistan

More Related Content

What's hot

Helen Chedzey_The derivation and application of the MODIS 19-band reflectance...
Helen Chedzey_The derivation and application of the MODIS 19-band reflectance...Helen Chedzey_The derivation and application of the MODIS 19-band reflectance...
Helen Chedzey_The derivation and application of the MODIS 19-band reflectance...TERN Australia
 
ILWIS GIS for Monitoring Landscapes in Tundra Ecosystems: Yamal Peninsula, Ru...
ILWIS GIS for Monitoring Landscapes in Tundra Ecosystems: Yamal Peninsula, Ru...ILWIS GIS for Monitoring Landscapes in Tundra Ecosystems: Yamal Peninsula, Ru...
ILWIS GIS for Monitoring Landscapes in Tundra Ecosystems: Yamal Peninsula, Ru...Universität Salzburg
 
Urban Land Cover Change Detection Analysis and Modelling Spatio-Temporal Grow...
Urban Land Cover Change Detection Analysis and Modelling Spatio-Temporal Grow...Urban Land Cover Change Detection Analysis and Modelling Spatio-Temporal Grow...
Urban Land Cover Change Detection Analysis and Modelling Spatio-Temporal Grow...Bayes Ahmed
 
Langhammer, Miřijovský
Langhammer, MiřijovskýLanghammer, Miřijovský
Langhammer, Miřijovskýmirijovsky
 
Belmont Res.Kibby Basin,NV. Property Gravity Survey Basin Model
Belmont Res.Kibby Basin,NV. Property Gravity Survey Basin ModelBelmont Res.Kibby Basin,NV. Property Gravity Survey Basin Model
Belmont Res.Kibby Basin,NV. Property Gravity Survey Basin ModelFollow me on Twitter @Stockshaman
 
09155183 d essay
09155183 d essay09155183 d essay
09155183 d essaylsgi4321
 
Archaeological and groundwater investigations
Archaeological and groundwater investigationsArchaeological and groundwater investigations
Archaeological and groundwater investigationsZaidoon Taha
 
First results from_the_hubble_opal_program_jupiter_in_2015
First results from_the_hubble_opal_program_jupiter_in_2015First results from_the_hubble_opal_program_jupiter_in_2015
First results from_the_hubble_opal_program_jupiter_in_2015Sérgio Sacani
 
2009 Dransfield - conforming falcon gravity and the global gravity anomaly
2009 Dransfield - conforming falcon gravity and the global gravity anomaly2009 Dransfield - conforming falcon gravity and the global gravity anomaly
2009 Dransfield - conforming falcon gravity and the global gravity anomalyBrett Johnson
 
“The strong attraction of gravity at Geoscience Australia” (Richard Lane, Geo...
“The strong attraction of gravity at Geoscience Australia” (Richard Lane, Geo...“The strong attraction of gravity at Geoscience Australia” (Richard Lane, Geo...
“The strong attraction of gravity at Geoscience Australia” (Richard Lane, Geo...Richard Lane
 
20110728_IGARSS_GDPS(ryu)fin1.pptx
20110728_IGARSS_GDPS(ryu)fin1.pptx20110728_IGARSS_GDPS(ryu)fin1.pptx
20110728_IGARSS_GDPS(ryu)fin1.pptxgrssieee
 
Turkey’s National Geospatial Soil Organic Carbon Information System
Turkey’s National Geospatial Soil Organic Carbon Information SystemTurkey’s National Geospatial Soil Organic Carbon Information System
Turkey’s National Geospatial Soil Organic Carbon Information SystemExternalEvents
 
TOTAL EARTH SOLUTIONS OIL AND GAS SERVICES
TOTAL EARTH SOLUTIONS OIL AND GAS SERVICESTOTAL EARTH SOLUTIONS OIL AND GAS SERVICES
TOTAL EARTH SOLUTIONS OIL AND GAS SERVICESBrett Johnson
 

What's hot (20)

Helen Chedzey_The derivation and application of the MODIS 19-band reflectance...
Helen Chedzey_The derivation and application of the MODIS 19-band reflectance...Helen Chedzey_The derivation and application of the MODIS 19-band reflectance...
Helen Chedzey_The derivation and application of the MODIS 19-band reflectance...
 
ILWIS GIS for Monitoring Landscapes in Tundra Ecosystems: Yamal Peninsula, Ru...
ILWIS GIS for Monitoring Landscapes in Tundra Ecosystems: Yamal Peninsula, Ru...ILWIS GIS for Monitoring Landscapes in Tundra Ecosystems: Yamal Peninsula, Ru...
ILWIS GIS for Monitoring Landscapes in Tundra Ecosystems: Yamal Peninsula, Ru...
 
Urban Land Cover Change Detection Analysis and Modelling Spatio-Temporal Grow...
Urban Land Cover Change Detection Analysis and Modelling Spatio-Temporal Grow...Urban Land Cover Change Detection Analysis and Modelling Spatio-Temporal Grow...
Urban Land Cover Change Detection Analysis and Modelling Spatio-Temporal Grow...
 
Langhammer, Miřijovský
Langhammer, MiřijovskýLanghammer, Miřijovský
Langhammer, Miřijovský
 
Belmont Res.Kibby Basin,NV. Property Gravity Survey Basin Model
Belmont Res.Kibby Basin,NV. Property Gravity Survey Basin ModelBelmont Res.Kibby Basin,NV. Property Gravity Survey Basin Model
Belmont Res.Kibby Basin,NV. Property Gravity Survey Basin Model
 
Poster_jayson_v3
Poster_jayson_v3Poster_jayson_v3
Poster_jayson_v3
 
09155183 d essay
09155183 d essay09155183 d essay
09155183 d essay
 
Archaeological and groundwater investigations
Archaeological and groundwater investigationsArchaeological and groundwater investigations
Archaeological and groundwater investigations
 
First results from_the_hubble_opal_program_jupiter_in_2015
First results from_the_hubble_opal_program_jupiter_in_2015First results from_the_hubble_opal_program_jupiter_in_2015
First results from_the_hubble_opal_program_jupiter_in_2015
 
Gomez tagle chavez et al 2002 patzcuaro
Gomez tagle chavez et al 2002 patzcuaroGomez tagle chavez et al 2002 patzcuaro
Gomez tagle chavez et al 2002 patzcuaro
 
2009 Dransfield - conforming falcon gravity and the global gravity anomaly
2009 Dransfield - conforming falcon gravity and the global gravity anomaly2009 Dransfield - conforming falcon gravity and the global gravity anomaly
2009 Dransfield - conforming falcon gravity and the global gravity anomaly
 
“The strong attraction of gravity at Geoscience Australia” (Richard Lane, Geo...
“The strong attraction of gravity at Geoscience Australia” (Richard Lane, Geo...“The strong attraction of gravity at Geoscience Australia” (Richard Lane, Geo...
“The strong attraction of gravity at Geoscience Australia” (Richard Lane, Geo...
 
20110728_IGARSS_GDPS(ryu)fin1.pptx
20110728_IGARSS_GDPS(ryu)fin1.pptx20110728_IGARSS_GDPS(ryu)fin1.pptx
20110728_IGARSS_GDPS(ryu)fin1.pptx
 
IMWA2011_Turner_311
IMWA2011_Turner_311IMWA2011_Turner_311
IMWA2011_Turner_311
 
Trial and error in determining carbon budgets at policy relevant scales
Trial and error in determining carbon budgets at policy relevant scalesTrial and error in determining carbon budgets at policy relevant scales
Trial and error in determining carbon budgets at policy relevant scales
 
Turkey’s National Geospatial Soil Organic Carbon Information System
Turkey’s National Geospatial Soil Organic Carbon Information SystemTurkey’s National Geospatial Soil Organic Carbon Information System
Turkey’s National Geospatial Soil Organic Carbon Information System
 
TOTAL EARTH SOLUTIONS OIL AND GAS SERVICES
TOTAL EARTH SOLUTIONS OIL AND GAS SERVICESTOTAL EARTH SOLUTIONS OIL AND GAS SERVICES
TOTAL EARTH SOLUTIONS OIL AND GAS SERVICES
 
GeoCarbon_v2.4
GeoCarbon_v2.4GeoCarbon_v2.4
GeoCarbon_v2.4
 
ESPL1351
ESPL1351ESPL1351
ESPL1351
 
Observing methane flux distributions using high resolution air-borne mapping
Observing methane flux distributions using high resolution air-borne mappingObserving methane flux distributions using high resolution air-borne mapping
Observing methane flux distributions using high resolution air-borne mapping
 

Similar to 19 b

Integration of data for mineral explorataion
Integration of data for mineral explorataionIntegration of data for mineral explorataion
Integration of data for mineral explorataionkrishanunath1
 
D41037045
D41037045D41037045
D41037045inventy
 
Characterization_and_mapping_of_hematite.pdf
Characterization_and_mapping_of_hematite.pdfCharacterization_and_mapping_of_hematite.pdf
Characterization_and_mapping_of_hematite.pdfssuser36e17c
 
study and analysis of hy si data in 400 to 500
study and analysis of hy si data in 400 to 500study and analysis of hy si data in 400 to 500
study and analysis of hy si data in 400 to 500IJAEMSJORNAL
 
Mapping Hydrothermal Mineral Deposits Using PCA and BR Methods in Baft 1:1000...
Mapping Hydrothermal Mineral Deposits Using PCA and BR Methods in Baft 1:1000...Mapping Hydrothermal Mineral Deposits Using PCA and BR Methods in Baft 1:1000...
Mapping Hydrothermal Mineral Deposits Using PCA and BR Methods in Baft 1:1000...INFOGAIN PUBLICATION
 
Using Remote Sensing Techniques For Monitoring Ecological Changes In Lakes: C...
Using Remote Sensing Techniques For Monitoring Ecological Changes In Lakes: C...Using Remote Sensing Techniques For Monitoring Ecological Changes In Lakes: C...
Using Remote Sensing Techniques For Monitoring Ecological Changes In Lakes: C...IJERA Editor
 
Diffuse reflectance spectroscopy to estimate soil attributes of Brazilian wet...
Diffuse reflectance spectroscopy to estimate soil attributes of Brazilian wet...Diffuse reflectance spectroscopy to estimate soil attributes of Brazilian wet...
Diffuse reflectance spectroscopy to estimate soil attributes of Brazilian wet...Agriculture Journal IJOEAR
 
High Resolution Seismic: Coal Mine Fields
High Resolution Seismic: Coal Mine FieldsHigh Resolution Seismic: Coal Mine Fields
High Resolution Seismic: Coal Mine FieldsAli Osman Öncel
 
Isprsarchives xl-7-w3-897-2015
Isprsarchives xl-7-w3-897-2015Isprsarchives xl-7-w3-897-2015
Isprsarchives xl-7-w3-897-2015bayrmgl
 
2 d seismic refraction tomography investigation of a sewage treatment site
2 d seismic refraction tomography investigation of a sewage treatment site2 d seismic refraction tomography investigation of a sewage treatment site
2 d seismic refraction tomography investigation of a sewage treatment siteAlexander Decker
 
Mapping of hydrothermal alteration in mount berecha area of main ethiopian ri...
Mapping of hydrothermal alteration in mount berecha area of main ethiopian ri...Mapping of hydrothermal alteration in mount berecha area of main ethiopian ri...
Mapping of hydrothermal alteration in mount berecha area of main ethiopian ri...Alexander Decker
 
_104_Geop_Lec_8_Airborne_&_Marin_Mag_Surveys_2.pdf
_104_Geop_Lec_8_Airborne_&_Marin_Mag_Surveys_2.pdf_104_Geop_Lec_8_Airborne_&_Marin_Mag_Surveys_2.pdf
_104_Geop_Lec_8_Airborne_&_Marin_Mag_Surveys_2.pdfYoussofNosseir
 
Chronological Calibration Methods for Landsat Satellite Images
Chronological Calibration Methods for Landsat Satellite Images Chronological Calibration Methods for Landsat Satellite Images
Chronological Calibration Methods for Landsat Satellite Images iosrjce
 
UAV Mangroves Rev 0 colour
UAV Mangroves Rev 0 colourUAV Mangroves Rev 0 colour
UAV Mangroves Rev 0 colourPeter Mellor
 
2. virat arora, s. s. rao, e. amminedu and p. jagadeeswara rao
2. virat arora, s. s. rao, e. amminedu and p. jagadeeswara rao2. virat arora, s. s. rao, e. amminedu and p. jagadeeswara rao
2. virat arora, s. s. rao, e. amminedu and p. jagadeeswara raoJournal of Global Resources
 
CLIMATE CHANGE IMPACT ASSESSMENT ON MELTING GLACIERS USING RS & GIS
CLIMATE CHANGE IMPACT ASSESSMENT ON MELTING GLACIERS USING RS & GISCLIMATE CHANGE IMPACT ASSESSMENT ON MELTING GLACIERS USING RS & GIS
CLIMATE CHANGE IMPACT ASSESSMENT ON MELTING GLACIERS USING RS & GISAbhiram Kanigolla
 
Integration of Aeromagntic Data and Landsat Imagery for structural Analysis f...
Integration of Aeromagntic Data and Landsat Imagery for structural Analysis f...Integration of Aeromagntic Data and Landsat Imagery for structural Analysis f...
Integration of Aeromagntic Data and Landsat Imagery for structural Analysis f...iosrjce
 

Similar to 19 b (20)

Integration of data for mineral explorataion
Integration of data for mineral explorataionIntegration of data for mineral explorataion
Integration of data for mineral explorataion
 
D41037045
D41037045D41037045
D41037045
 
Characterization_and_mapping_of_hematite.pdf
Characterization_and_mapping_of_hematite.pdfCharacterization_and_mapping_of_hematite.pdf
Characterization_and_mapping_of_hematite.pdf
 
ndx_odumade
ndx_odumadendx_odumade
ndx_odumade
 
study and analysis of hy si data in 400 to 500
study and analysis of hy si data in 400 to 500study and analysis of hy si data in 400 to 500
study and analysis of hy si data in 400 to 500
 
Mapping Hydrothermal Mineral Deposits Using PCA and BR Methods in Baft 1:1000...
Mapping Hydrothermal Mineral Deposits Using PCA and BR Methods in Baft 1:1000...Mapping Hydrothermal Mineral Deposits Using PCA and BR Methods in Baft 1:1000...
Mapping Hydrothermal Mineral Deposits Using PCA and BR Methods in Baft 1:1000...
 
Using Remote Sensing Techniques For Monitoring Ecological Changes In Lakes: C...
Using Remote Sensing Techniques For Monitoring Ecological Changes In Lakes: C...Using Remote Sensing Techniques For Monitoring Ecological Changes In Lakes: C...
Using Remote Sensing Techniques For Monitoring Ecological Changes In Lakes: C...
 
Using Remote Sensing Techniques For Monitoring Ecological Changes In Lakes: C...
Using Remote Sensing Techniques For Monitoring Ecological Changes In Lakes: C...Using Remote Sensing Techniques For Monitoring Ecological Changes In Lakes: C...
Using Remote Sensing Techniques For Monitoring Ecological Changes In Lakes: C...
 
Diffuse reflectance spectroscopy to estimate soil attributes of Brazilian wet...
Diffuse reflectance spectroscopy to estimate soil attributes of Brazilian wet...Diffuse reflectance spectroscopy to estimate soil attributes of Brazilian wet...
Diffuse reflectance spectroscopy to estimate soil attributes of Brazilian wet...
 
High Resolution Seismic: Coal Mine Fields
High Resolution Seismic: Coal Mine FieldsHigh Resolution Seismic: Coal Mine Fields
High Resolution Seismic: Coal Mine Fields
 
Isprsarchives xl-7-w3-897-2015
Isprsarchives xl-7-w3-897-2015Isprsarchives xl-7-w3-897-2015
Isprsarchives xl-7-w3-897-2015
 
report_final
report_finalreport_final
report_final
 
2 d seismic refraction tomography investigation of a sewage treatment site
2 d seismic refraction tomography investigation of a sewage treatment site2 d seismic refraction tomography investigation of a sewage treatment site
2 d seismic refraction tomography investigation of a sewage treatment site
 
Mapping of hydrothermal alteration in mount berecha area of main ethiopian ri...
Mapping of hydrothermal alteration in mount berecha area of main ethiopian ri...Mapping of hydrothermal alteration in mount berecha area of main ethiopian ri...
Mapping of hydrothermal alteration in mount berecha area of main ethiopian ri...
 
_104_Geop_Lec_8_Airborne_&_Marin_Mag_Surveys_2.pdf
_104_Geop_Lec_8_Airborne_&_Marin_Mag_Surveys_2.pdf_104_Geop_Lec_8_Airborne_&_Marin_Mag_Surveys_2.pdf
_104_Geop_Lec_8_Airborne_&_Marin_Mag_Surveys_2.pdf
 
Chronological Calibration Methods for Landsat Satellite Images
Chronological Calibration Methods for Landsat Satellite Images Chronological Calibration Methods for Landsat Satellite Images
Chronological Calibration Methods for Landsat Satellite Images
 
UAV Mangroves Rev 0 colour
UAV Mangroves Rev 0 colourUAV Mangroves Rev 0 colour
UAV Mangroves Rev 0 colour
 
2. virat arora, s. s. rao, e. amminedu and p. jagadeeswara rao
2. virat arora, s. s. rao, e. amminedu and p. jagadeeswara rao2. virat arora, s. s. rao, e. amminedu and p. jagadeeswara rao
2. virat arora, s. s. rao, e. amminedu and p. jagadeeswara rao
 
CLIMATE CHANGE IMPACT ASSESSMENT ON MELTING GLACIERS USING RS & GIS
CLIMATE CHANGE IMPACT ASSESSMENT ON MELTING GLACIERS USING RS & GISCLIMATE CHANGE IMPACT ASSESSMENT ON MELTING GLACIERS USING RS & GIS
CLIMATE CHANGE IMPACT ASSESSMENT ON MELTING GLACIERS USING RS & GIS
 
Integration of Aeromagntic Data and Landsat Imagery for structural Analysis f...
Integration of Aeromagntic Data and Landsat Imagery for structural Analysis f...Integration of Aeromagntic Data and Landsat Imagery for structural Analysis f...
Integration of Aeromagntic Data and Landsat Imagery for structural Analysis f...
 

Recently uploaded

Developer Data Modeling Mistakes: From Postgres to NoSQL
Developer Data Modeling Mistakes: From Postgres to NoSQLDeveloper Data Modeling Mistakes: From Postgres to NoSQL
Developer Data Modeling Mistakes: From Postgres to NoSQLScyllaDB
 
The Ultimate Guide to Choosing WordPress Pros and Cons
The Ultimate Guide to Choosing WordPress Pros and ConsThe Ultimate Guide to Choosing WordPress Pros and Cons
The Ultimate Guide to Choosing WordPress Pros and ConsPixlogix Infotech
 
DSPy a system for AI to Write Prompts and Do Fine Tuning
DSPy a system for AI to Write Prompts and Do Fine TuningDSPy a system for AI to Write Prompts and Do Fine Tuning
DSPy a system for AI to Write Prompts and Do Fine TuningLars Bell
 
SIP trunking in Janus @ Kamailio World 2024
SIP trunking in Janus @ Kamailio World 2024SIP trunking in Janus @ Kamailio World 2024
SIP trunking in Janus @ Kamailio World 2024Lorenzo Miniero
 
New from BookNet Canada for 2024: BNC CataList - Tech Forum 2024
New from BookNet Canada for 2024: BNC CataList - Tech Forum 2024New from BookNet Canada for 2024: BNC CataList - Tech Forum 2024
New from BookNet Canada for 2024: BNC CataList - Tech Forum 2024BookNet Canada
 
Streamlining Python Development: A Guide to a Modern Project Setup
Streamlining Python Development: A Guide to a Modern Project SetupStreamlining Python Development: A Guide to a Modern Project Setup
Streamlining Python Development: A Guide to a Modern Project SetupFlorian Wilhelm
 
New from BookNet Canada for 2024: Loan Stars - Tech Forum 2024
New from BookNet Canada for 2024: Loan Stars - Tech Forum 2024New from BookNet Canada for 2024: Loan Stars - Tech Forum 2024
New from BookNet Canada for 2024: Loan Stars - Tech Forum 2024BookNet Canada
 
Transcript: New from BookNet Canada for 2024: BNC CataList - Tech Forum 2024
Transcript: New from BookNet Canada for 2024: BNC CataList - Tech Forum 2024Transcript: New from BookNet Canada for 2024: BNC CataList - Tech Forum 2024
Transcript: New from BookNet Canada for 2024: BNC CataList - Tech Forum 2024BookNet Canada
 
From Family Reminiscence to Scholarly Archive .
From Family Reminiscence to Scholarly Archive .From Family Reminiscence to Scholarly Archive .
From Family Reminiscence to Scholarly Archive .Alan Dix
 
TrustArc Webinar - How to Build Consumer Trust Through Data Privacy
TrustArc Webinar - How to Build Consumer Trust Through Data PrivacyTrustArc Webinar - How to Build Consumer Trust Through Data Privacy
TrustArc Webinar - How to Build Consumer Trust Through Data PrivacyTrustArc
 
Merck Moving Beyond Passwords: FIDO Paris Seminar.pptx
Merck Moving Beyond Passwords: FIDO Paris Seminar.pptxMerck Moving Beyond Passwords: FIDO Paris Seminar.pptx
Merck Moving Beyond Passwords: FIDO Paris Seminar.pptxLoriGlavin3
 
unit 4 immunoblotting technique complete.pptx
unit 4 immunoblotting technique complete.pptxunit 4 immunoblotting technique complete.pptx
unit 4 immunoblotting technique complete.pptxBkGupta21
 
Transcript: New from BookNet Canada for 2024: Loan Stars - Tech Forum 2024
Transcript: New from BookNet Canada for 2024: Loan Stars - Tech Forum 2024Transcript: New from BookNet Canada for 2024: Loan Stars - Tech Forum 2024
Transcript: New from BookNet Canada for 2024: Loan Stars - Tech Forum 2024BookNet Canada
 
"ML in Production",Oleksandr Bagan
"ML in Production",Oleksandr Bagan"ML in Production",Oleksandr Bagan
"ML in Production",Oleksandr BaganFwdays
 
"Subclassing and Composition – A Pythonic Tour of Trade-Offs", Hynek Schlawack
"Subclassing and Composition – A Pythonic Tour of Trade-Offs", Hynek Schlawack"Subclassing and Composition – A Pythonic Tour of Trade-Offs", Hynek Schlawack
"Subclassing and Composition – A Pythonic Tour of Trade-Offs", Hynek SchlawackFwdays
 
SALESFORCE EDUCATION CLOUD | FEXLE SERVICES
SALESFORCE EDUCATION CLOUD | FEXLE SERVICESSALESFORCE EDUCATION CLOUD | FEXLE SERVICES
SALESFORCE EDUCATION CLOUD | FEXLE SERVICESmohitsingh558521
 
Scanning the Internet for External Cloud Exposures via SSL Certs
Scanning the Internet for External Cloud Exposures via SSL CertsScanning the Internet for External Cloud Exposures via SSL Certs
Scanning the Internet for External Cloud Exposures via SSL CertsRizwan Syed
 
Passkey Providers and Enabling Portability: FIDO Paris Seminar.pptx
Passkey Providers and Enabling Portability: FIDO Paris Seminar.pptxPasskey Providers and Enabling Portability: FIDO Paris Seminar.pptx
Passkey Providers and Enabling Portability: FIDO Paris Seminar.pptxLoriGlavin3
 
DevoxxFR 2024 Reproducible Builds with Apache Maven
DevoxxFR 2024 Reproducible Builds with Apache MavenDevoxxFR 2024 Reproducible Builds with Apache Maven
DevoxxFR 2024 Reproducible Builds with Apache MavenHervé Boutemy
 

Recently uploaded (20)

Developer Data Modeling Mistakes: From Postgres to NoSQL
Developer Data Modeling Mistakes: From Postgres to NoSQLDeveloper Data Modeling Mistakes: From Postgres to NoSQL
Developer Data Modeling Mistakes: From Postgres to NoSQL
 
The Ultimate Guide to Choosing WordPress Pros and Cons
The Ultimate Guide to Choosing WordPress Pros and ConsThe Ultimate Guide to Choosing WordPress Pros and Cons
The Ultimate Guide to Choosing WordPress Pros and Cons
 
DSPy a system for AI to Write Prompts and Do Fine Tuning
DSPy a system for AI to Write Prompts and Do Fine TuningDSPy a system for AI to Write Prompts and Do Fine Tuning
DSPy a system for AI to Write Prompts and Do Fine Tuning
 
SIP trunking in Janus @ Kamailio World 2024
SIP trunking in Janus @ Kamailio World 2024SIP trunking in Janus @ Kamailio World 2024
SIP trunking in Janus @ Kamailio World 2024
 
New from BookNet Canada for 2024: BNC CataList - Tech Forum 2024
New from BookNet Canada for 2024: BNC CataList - Tech Forum 2024New from BookNet Canada for 2024: BNC CataList - Tech Forum 2024
New from BookNet Canada for 2024: BNC CataList - Tech Forum 2024
 
Streamlining Python Development: A Guide to a Modern Project Setup
Streamlining Python Development: A Guide to a Modern Project SetupStreamlining Python Development: A Guide to a Modern Project Setup
Streamlining Python Development: A Guide to a Modern Project Setup
 
New from BookNet Canada for 2024: Loan Stars - Tech Forum 2024
New from BookNet Canada for 2024: Loan Stars - Tech Forum 2024New from BookNet Canada for 2024: Loan Stars - Tech Forum 2024
New from BookNet Canada for 2024: Loan Stars - Tech Forum 2024
 
Transcript: New from BookNet Canada for 2024: BNC CataList - Tech Forum 2024
Transcript: New from BookNet Canada for 2024: BNC CataList - Tech Forum 2024Transcript: New from BookNet Canada for 2024: BNC CataList - Tech Forum 2024
Transcript: New from BookNet Canada for 2024: BNC CataList - Tech Forum 2024
 
From Family Reminiscence to Scholarly Archive .
From Family Reminiscence to Scholarly Archive .From Family Reminiscence to Scholarly Archive .
From Family Reminiscence to Scholarly Archive .
 
TrustArc Webinar - How to Build Consumer Trust Through Data Privacy
TrustArc Webinar - How to Build Consumer Trust Through Data PrivacyTrustArc Webinar - How to Build Consumer Trust Through Data Privacy
TrustArc Webinar - How to Build Consumer Trust Through Data Privacy
 
Merck Moving Beyond Passwords: FIDO Paris Seminar.pptx
Merck Moving Beyond Passwords: FIDO Paris Seminar.pptxMerck Moving Beyond Passwords: FIDO Paris Seminar.pptx
Merck Moving Beyond Passwords: FIDO Paris Seminar.pptx
 
unit 4 immunoblotting technique complete.pptx
unit 4 immunoblotting technique complete.pptxunit 4 immunoblotting technique complete.pptx
unit 4 immunoblotting technique complete.pptx
 
Transcript: New from BookNet Canada for 2024: Loan Stars - Tech Forum 2024
Transcript: New from BookNet Canada for 2024: Loan Stars - Tech Forum 2024Transcript: New from BookNet Canada for 2024: Loan Stars - Tech Forum 2024
Transcript: New from BookNet Canada for 2024: Loan Stars - Tech Forum 2024
 
DMCC Future of Trade Web3 - Special Edition
DMCC Future of Trade Web3 - Special EditionDMCC Future of Trade Web3 - Special Edition
DMCC Future of Trade Web3 - Special Edition
 
"ML in Production",Oleksandr Bagan
"ML in Production",Oleksandr Bagan"ML in Production",Oleksandr Bagan
"ML in Production",Oleksandr Bagan
 
"Subclassing and Composition – A Pythonic Tour of Trade-Offs", Hynek Schlawack
"Subclassing and Composition – A Pythonic Tour of Trade-Offs", Hynek Schlawack"Subclassing and Composition – A Pythonic Tour of Trade-Offs", Hynek Schlawack
"Subclassing and Composition – A Pythonic Tour of Trade-Offs", Hynek Schlawack
 
SALESFORCE EDUCATION CLOUD | FEXLE SERVICES
SALESFORCE EDUCATION CLOUD | FEXLE SERVICESSALESFORCE EDUCATION CLOUD | FEXLE SERVICES
SALESFORCE EDUCATION CLOUD | FEXLE SERVICES
 
Scanning the Internet for External Cloud Exposures via SSL Certs
Scanning the Internet for External Cloud Exposures via SSL CertsScanning the Internet for External Cloud Exposures via SSL Certs
Scanning the Internet for External Cloud Exposures via SSL Certs
 
Passkey Providers and Enabling Portability: FIDO Paris Seminar.pptx
Passkey Providers and Enabling Portability: FIDO Paris Seminar.pptxPasskey Providers and Enabling Portability: FIDO Paris Seminar.pptx
Passkey Providers and Enabling Portability: FIDO Paris Seminar.pptx
 
DevoxxFR 2024 Reproducible Builds with Apache Maven
DevoxxFR 2024 Reproducible Builds with Apache MavenDevoxxFR 2024 Reproducible Builds with Apache Maven
DevoxxFR 2024 Reproducible Builds with Apache Maven
 

19 b

  • 1. Chapter 19B. Analysis of Imaging Spectrometer Data for the Dudkash Area of Interest By Raymond F. Kokaly and Michaela R. Johnson Abstract Imaging spectrometer data collected over the Dudkash area of interest (AOI) in northeastern Afghanistan were analyzed with spectroscopic methods to identify the occurrence of selected materials at the surface. Absorption features in the spectra of HyMap data were compared to a reference library of spectra of known materials. Carbonates and muscovites cover most of the Dudkash AOI. Distinct patterns of kaolinite occur in localized patterns, especially in the center of the AOI. An analysis of HyMap data to detect gypsum found only a few pixels containing this mineral, adjacent to the mapped locations of the bedded gypsum mineral deposit of Shuraw. The known coal deposits in the Dudkash AOI appear to be associated with areas of kaolinite, kaolinite mixed with muscovite/clay/calcite, and calcite mixed with muscovite/illite. This pattern was also observed in preliminary analysis of imaging spectrometer data for the Takhar AOI. The limestone host rock of celestite was detected; however, more detailed studies of the spectral characteristics of the celestite deposit and its host rocks are needed in order to characterize the resource using imaging spectrometer data. 19B.1 Introduction Past studies of geologic data of Afghanistan revealed numerous areas with indications of potential mineral resources of various types (Peters and others, 2007; Abdullah and others, 1977). Several of these areas were selected for follow-on studies using imaging spectroscopy to characterize surface materials. Imaging spectroscopy is an advanced type of remote sensing that is also known as hyperspectral remote sensing. One of those areas selected for follow-on studies is the Dudkash area of interest (AOI) in northeastern Afghanistan, which is approximately 160 km north of Kabul (fig. 19B–1). The area is believed to have the potential for gypsum and celestite. To help assess these potential resources, high-resolution imaging spectrometer data were analyzed to detect the presence of selected minerals that may be indicative of past mineralization processes. This report contains the results of the spectroscopic data analyses and identifies sites within the Dudkash AOI that deserve further investigation, especially detailed geological mapping, lithologic sampling, and geochemical studies. 19B.2 Data Collection and Processing In 2007, imaging spectrometer data were acquired over most of Afghanistan as part of the U.S. Geological Survey (USGS) project "Oil and Gas Resources Assessment of the Katawaz and Helmand Basins.” These data were collected to characterize surface materials in support of assessments of resources (coal, water, minerals, and oil and gas) and earthquake hazards in the country (King and others, 2010). Imaging spectrometers measure the reflectance of visible and near-infrared light from the Earth’s surface in many narrow channels, producing a reflectance spectrum for each image pixel. These reflectance spectra can be interpreted to identify absorption features that arise from specific chemical transitions and molecular bonds that provide compositional information about surface materials. Imaging spectrometer data can only be used to characterize the upper surface materials and not subsurface composition or structure. However, subsurface processes can be indicated by the distribution of surface materials.
  • 2. Figure 19B–1. Index map of the Dudkash area of interest in northeastern Afghanistan. 19B.2.1 Collection of Imaging Spectrometer Data The HyMap imaging spectrometer (Cocks and others, 1998) was flown over Afghanistan from August 22 to October 2, 2007 (Kokaly and others, 2008). HyMap has 512 cross-track pixels and covers the wavelength range 0.43 to 2.48 microns (µm) in 128 channels. The imaging spectrometer was flown on a WB-57 high-altitude aircraft at approximately 50,000 ft. There were 207 standard data flight lines and 11 cross-cutting calibration lines collected over Afghanistan for a total of 218 flight lines, covering a surface area of 438,012 km2 (Kokaly and others, 2008). Data were received in scaled radiance (calibrated to National Institute of Standards and Technology reference materials). Before processing, four channels that had low signal-to-noise and (or) were in wavelength regions that overlapped between detectors were removed from the HyMap data. Each flight line was georeferenced to Landsat base imagery in UTM projection (Davis, 2007). 19B.2.2 Calibration HyMap data were converted from radiance to reflectance using a multistep process. This calibration process removed the influence of the solar irradiance function, atmospheric absorptions, and residual instrument artifacts, resulting in reflectance spectra that have spectral features that arise from the material composition of the surface. Because of the extreme topographic relief and restricted access to ground calibration sites, modifications to the typical USGS calibration procedures were required to calibrate the 2007 Afghanistan HyMap dataset (Hoefen and others, 2010). In the first step of the calibration process, the radiance data were converted to apparent surface reflectance using the radiative Chapter 19B. Analysis of Imaging Spectrometer Data for the Dudkash Area of Interest 1383
  • 3. transfer correction program Atmospheric CORrection Now (ACORN; ImSpec LLC, Palmdale, Calif.). ACORN was run multiple times for each flight line, using average elevations in 100-m increments, covering the range of minimum to maximum elevation within the flight line. A single atmospherically corrected image was assembled from these elevation-incremented ACORN results. This was done by determining the elevation of each HyMap pixel and selecting the atmospherically corrected pixel from the 100-m increment closest to that elevation. Each assembled atmospherically corrected image was further empirically adjusted using ground- based reflectance measurements from a ground calibration site. Spectra of five ground calibration sites were collected in Afghanistan: Kandahar Air Field, Bagram Air Base, and Mazar-e-Sharif Airport, as well as soil samples from two fallow fields in Kabul. These were used to calculate empirical correction factors using the pixels of atmospherically corrected HyMap data in the flight lines that passed over the sites. The empirical correction from the closest calibration site to each flight line was applied. To further improve data quality, an additional calibration step was taken to address the atmospheric differences caused, in part, by the large distances from calibration sites to where the HyMap data were acquired. The large distances were a result of the lack of safe access to ground calibration sites. The duration of the airborne survey and variation in time of day when flight lines were acquired also resulted in differences in atmospheric conditions between standard flight lines and lines over ground calibration sites, which were used to derive the empirical correction factors. During the time of data collection, sun angle, atmospheric water vapor, and atmospheric scattering differed for each flight line. To compensate for this, cross-cutting calibration flight lines over the ground calibration areas were acquired (Kokaly and others, 2008) and used to refine data quality of standard data lines. A multiplier correction for each standard data line, typically oriented north-south, was derived using the pixels of overlap with the well-calibrated cross-cutting line that intersected it, subject to slope, vegetation cover, and other restrictions on pixel selection (Hoefen and others, 2010). As a result, the localized cross-calibration multiplier, derived from the overlap region, corrected residual atmospheric contamination in the imaging spectrometer data that may have been present after the ground calibration step. 19B.2.3 Materials Maps and Presentation After undergoing a complex and rigorous data calibration process, the georeferenced and calibrated reflectance data were analyzed using the Material Identification and Characterization Algorithm (MICA), a module of the USGS Processing Routines in IDL (Interactive Data Language) for Spectroscopic Measurements (PRISM) software (Kokaly, 2011). The MICA analysis compared the reflectance spectrum of each pixel of HyMap data to entries in a reference spectral library of minerals, vegetation, water, and other materials. The HyMap data were compared to 97 reference spectra of well-characterized mineral and material standards. The best spectral match to each pixel was determined and the results were clustered into classes of materials discussed below. The resulting maps of material distribution, resampled to a 23 × 23 m square pixel grid, were mosaicked to create thematic maps of surface mineral occurrences over the full dataset covering Afghanistan. MICA was applied to HyMap data twice in order to present the distribution of two categories of minerals that are naturally separated in the wavelength regions of their primary absorption features. MICA was applied using the subset of minerals with absorption features in the visible and near-infrared wavelength region, producing a 1-µm map of iron-bearing minerals and other materials (King and others, 2011), and MICA was applied again using the subset of minerals with absorption features in the shortwave infrared, producing a 2-µm map of carbonates, phyllosilicates, sulfates, altered minerals, and other materials (Kokaly and others, 2011). For clarity of presentation, some individual classes in these two maps were bundled by combining selected mineral types (for example, all montmorillonites or all kaolinites) and representing them with the same color in order to reduce the number of colors required to represent the mineral classes. 1384 Summaries of Important Areas for Mineral Investment and Production Opportunities of Nonfuel Minerals in Afghanistan
  • 4. The iron-bearing minerals map has 27 identified classes. Iron-bearing minerals with different mineral compositions but similar broad spectral features are difficult to classify as specific mineral species. Thus, generic spectral classes, including several minerals with similar absorption features, such as Fe3+ type 1 and Fe3+ type 2, are depicted on the map. The carbonates, phyllosilicates, sulfates, and altered minerals map has 31 identified classes. Minerals with slightly different mineral compositions but comparable spectral features are less easily discriminated; thus, some identified classes consist of several minerals with similar spectra, such as the chlorite or epidote class. When comparisons with reference spectra resulted in no viable match, a designation of “not classified” was assigned to the pixel. 19B.3 Geologic Setting of the Dudkash AOI The Dudkash AOI is mainly within the Baghlan Province in northeast Afghanistan, but the northeast part of it lies within Kunduz and Takhar provinces. The contrast-enhanced stretch of the natural-color composite of Landsat Thematic Mapper bands in figure 19B–2 provides a general overview of the Dudkash AOI terrain and is useful for understanding the general characteristics and distribution of surficial material including rocks and soil, unconsolidated sediments, vegetation, and hydrologic features. 19B.3.1 Topography Elevations in the Dudkash AOI range between 474 and 4,087 m (fig. 19B–3). The highest areas are in the northeast corner of the Dudkash AOI in sharply defined mountain ranges and foothills that are commonly controlled by faults. The low areas include large agricultural areas in the central and north- central parts of the AOI around the district center of Pul-i-Khumry and the province capitol of Baghlan. Other population centers include the towns of Nahrin in the east and Dushi in the south. 19B.3.2 Lithology and Structure The oldest rocks in the Dudkash AOI are Middle Proterozoic greenschists, gneiss, quartzite, marble, and amphibolite, exposed in the south-central portion of the area (fig. 19B–4; Abdullah and Chmyriov, 1977; Doebrich and others, 2006). Ordovician sandstones and shales and Silurian–Devonian limestones and dolomites are exposed at the higher elevations along the southeastern edge of the area; however, most of the Dudkash AOI is covered by younger rocks. Lower elevation areas are covered by Paleocene and Late Cretaceous limestones, sandstones, siltstones, and clays, with small occurrences of Eocene rocks of similar type. Lowest elevations are covered by Miocene clays and limestones and Quaternary surficial deposits. Mississippian diorite, granodiorites, and granites and Late Triassic granitic rocks intrude Namurian-stage (Carboniferous), Ordovician, and Silurian–Devonian strata along the southeastern edge of the Dudkash AOI. 19B.3.3 Known Mineralization Figure 19B–5 shows 12 locations where mineralization with a potential for mineral resource development may exist (Peters and others, 2007). A number of different types of mineral deposits, particularly strontium-bearing celestite and gypsum deposits are present within the Dudkash AOI. The mineralogical characteristics of the mineralized locations are summarized in table 19B–1. Clay and limestone resources and showings of copper (Cu) and zinc (Zn) are also indicated as occurring in the AOI. Celestite in the Tangi-Murch deposit is hosted in bituminous limestone. Paleogene carbonate rocks crop out in the area (Abdullah and others, 1977). Beds as much as 170 m long with thicknesses from 0.4 to 1.67 m are indicated (Abdullah and others, 1977). Bedded gypsum (Dudkash Gypsum) has been found in beds as much as 6 m thick with extensions as much as 12 km in an Upper Jurassic sequence (Abdullah and others, 1977). Gypsum beds at the Shuraw mineral occurrence are 1 m thick and occur in Jurassic sandstone and clay (Abdullah and others, 1977). Chapter 19B. Analysis of Imaging Spectrometer Data for the Dudkash Area of Interest 1385
  • 5. Paleocene limestone beds at the Pul-i-Khumry mineral occurrence have been exploited for raw material for a nearby cement plant. The rock is light-colored, thick-bedded, fine-crystalline and found in beds 300 to 400 m thick exposed over an area of several thousand square kilometers (Abdullah and others, 1977). Figure 19B–2. Contrast-enhanced Landsat Thematic Mapper natural-color image of the Dudkash area of interest. 19B.4 Mineral Maps of the Dudkash Area of Interest Analysis of the HyMap imaging spectrometer data of the Dudkash AOI using spectroscopic methods resulted in the identification of a wide variety of minerals exposed at the surface. Although the occurrence of certain minerals may suggest that mineralization processes may have once operated in the area, many of the minerals that were identified are also common rock-forming minerals or minerals that 1386 Summaries of Important Areas for Mineral Investment and Production Opportunities of Nonfuel Minerals in Afghanistan
  • 6. can be derived from the weathering of a wide variety of rock types. Consequently, the distribution patterns of the identified minerals and the geologic context in which they occur are extremely important in understanding the causes of mapped mineral occurrences and evaluating the possible potential for related mineral deposits. Figure 19B–6 depicts the results of the MICA analyses of the HyMap data for the Dudkash AOI for the 2-µm wavelength materials, which include clays, carbonates, phyllosilicates, sulfates, altered minerals and other materials. Figure 19B–7 shows the results for the iron-bearing minerals. The carbonates cover most of the Dudkash AOI, mostly indicated by pixels containing calcite and calcite mixed with clay/mica. However, pixels matched to pure muscovite spectra occur over large contiguous areas both within mapped boundaries of intrusive units but also outside the boundaries and in other areas. Distinct patterns of kaolinite clays occur in localized patterns, especially in the center of the AOI. Epidote and chlorite were found in spatially consistent patterns in the northeast and were especially concentrated near the southern corner of the AOI (see fig. 19B–6). Strong gypsum signatures were only found in three pixels in the 2-µm material mapping. Because of the large number of classes represented and the subtleties of the distribution patterns represented in these image maps, it is instructive to display these results as a series of image maps each depicting a selected group of minerals that are mineralogically related or commonly occur together in special geologic environments (figs. 19B–8 to 19B–12). Figure 19B–8 shows the distribution of carbonate minerals in the Dudkash AOI, whereas figure 19B–9 shows where clay minerals and micas occur. The distribution of iron oxide and hydroxide minerals are displayed in figure 19B–10. Minerals commonly found in hydrothermally altered rocks are mapped in figure 19B–11 and secondary minerals often associated with mineralized and (or) weathered rocks are mapped in figure 19B–12. 19B.4.1 Carbonate Minerals Carbonate minerals, either calcite or dolomite, were mapped over a large majority of the Dudkash AOI (fig. 19B–8). In general, calcite is mapped within every geologic unit. Dolomite mixed with calcite and (or) clay occurs in a less spatially extensive pattern, but does occur in localized concentrations and in linear patterns 4 to 8 km in length. None of the known mineralized areas are highlighted by the carbonate minerals map. Because of the ubiquitous nature of carbonate, the Pul-i- Khumry area of limestone mineralization is not uniquely identified, but does occur within a large area of pixels mapped as matching the strong absorption features of abundant calcite. The Dudkash Stone mineral occurrence is found in an area of concentrations of pixels that were matched to dolomite + calcite and clay, consistent with the expected dolomite mineralogy for this fluxstone. The Dudkash Lime mineral deposit is found in an area of pixels that mapped as kaolinite + calcite, calcite + clay, and calcite, consistent with the description of the deposit as limestone beds that crop out between Jurassic clays and siltstones (Abdullah and others, 1977). 19B.4.2 Clays and Micas Abundant muscovites were detected in the mapped units of Mississippian and Late Triassic intrusive rocks near the town of Dushi in the southwest part of the Dudkash AOI (fig. 19B–9). In addition, muscovites were also found distributed within nearby Silurian and Jurassic stratified rock units, suggesting that mineral distributions detected with HyMap data could help in the refinement of lithologic contacts. Muscovite was found with strong spectral signatures and spatially coherent patterns in association with Namurian stage stratified rock units. Kaolinites were distributed mostly in Lower to Middle Jurassic units both in the central area of the AOI and near the town of Nahrin, with additional occurrences of spatially consistent groups of pixels in adjacent Early Cretaceous and Late Jurassic units, similar in distribution to the kaolinites in the Takhar AOI (Kokaly and Johnson, chap. 26, this volume). The occurrences of Kaukpar bentonite and Surkhab clay are not near any large areas of mapped montmorillonite, although the pixels around the indicated locations contain a mixture of carbonates and clays. Chapter 19B. Analysis of Imaging Spectrometer Data for the Dudkash Area of Interest 1387
  • 7. Figure 19B–3. Elevations and topography of the Dudkash area of interest. 19B.4.3 Iron Oxides and Hydroxides Conspicuous areas of hematite are found in the center of the Dudkash AOI (fig. 19B–10) in an early Cretaceous unit, the description of which includes red sandstones as rocks that occur within the unit (Abdullah and Chmyriov, 1977; Doebrich and others, 2006). Large concentrations of hematite also appear along the eastern part of the northern edge of the AOI in early Miocene and Eocene units. Goethite andiron hydroxide are more widespread across the AOI compared to hematite. Similar to the 2-µm class of epidote or chlorite, the 1-µm epidote class is found in the southwest part of the AOI. 1388 Summaries of Important Areas for Mineral Investment and Production Opportunities of Nonfuel Minerals in Afghanistan
  • 8. Figure 19B–4. Geologic map of the Dudkash area of interest from digital geologic map of Afghanistan (Abdullah and Chmyriov, 1977; Doebrich and others, 2006). 19B.4.4 Common Alteration Minerals Most of the minerals in this group are commonly present in hydrothermally altered rocks associated with epithermal mineral deposits (fig. 19B–11). Consequently, where they occur in distinct clusters is of great interest in terms of potential mineral deposits. However, the mineral distributions do not occur in distributions that are suggestive of such alteration in the Dudkash AOI. 19B.4.5 Common Secondary Minerals Secondary minerals, in the epidote and chlorite or epidote classes (fig. 19B–12), occur mostly along the southern edge of the Dudkash AOI, near the town of Dushi. In addition, there are concentrations of pixels matched to the epidote and chlorite or epidote classes in the northeast part of the Dudkash AOI, northeast of the town of Nahrin. In both these areas, epidote and chlorite are mapped within Namurian stage and Mississippian stratified rocks, similar to the distributions of epidote and chlorite pixels in rocks of these ages in the Takhar AOI (Kokaly and Johnson, chap. 26B of this report). 19B.4.6 Gypsum A MICA analysis using only gypsum in the reference spectral library was conducted to expand the mapping of gypsum for greater detail. However, that resulted in only a few isolated, small concentrations of gypsum being detected in the Dudkash area. A grouping of four pixels containing Chapter 19B. Analysis of Imaging Spectrometer Data for the Dudkash Area of Interest 1389
  • 9. gypsum was found near the Shuraw mineral deposit, surrounded by pixels containing montmorillonite and calcite + clay, consistent with the mineral deposit description (Abdullah and others, 1977). Gypsum was not detected near the Dudkash Gypsum mineral deposit, although that site was located near pixels containing kaolinite and calcite and unmapped pixels in a pattern consistent with Chal, Chal-I, and Chal-II gypsum and salt deposits in the Takhar AOI (Kokaly and Johnson, chap. 26, this volume). Figure 19B–5. Sites of known mineralization by deposit type (Peters and others, 2007) on the geologic map of the Dudkash area of interest from digital geologic map of Afghanistan (Abdullah and Chmyriov, 1977; Doebrich and others, 2006). Table 19B–1. Sites of known mineralization in the Dudkash area of interest. [Data are from Peters and others (2007). nd, no data] Major Name Deposit type Deposit size, description Alteration Mineralogy Gangue commodity Kaukpar Sedimentary Brick clay Small, thickness: 11 to 17 m nd nd nd bentonite Surkhab Unknown clay Brick clay Small nd nd nd Shenivaghur Unknown stoneBuilding Small, thickness: 80 m, extent: 1 nd nd nd stone km Unnamed Unknown Copper Showing nd Sulfides nd copper Unnamed Unclassified Copper Showing, 0.1 x 2 m nd Copper sulfides nd 1390 Summaries of Important Areas for Mineral Investment and Production Opportunities of Nonfuel Minerals in Afghanistan
  • 10. Major Name Deposit type Deposit size, description Alteration Mineralogy Gangue commodity Dudkash stone Unknown stoneFluxstone Small, thickness: 3.9 m nd Dolomite nd Shuraw Bedded Gypsum Occurrence, thickness: 1 m nd Gypsum nd gypsum Dudkash Bedded Gypsum Occurrence, thickness: 1.5 to 2 m nd Gypsum nd gypsum gypsum (occasionally up to 6 m), extent: up to 12 km Dudkash lime Limestone Limestone Small, thickness: 30 m nd nd nd Pul-i-Khumry Limestone Limestone Small, thickness: 300 to 500 m, nd nd nd area: a few thousand m2 Unnamed Polymetallic Zinc Showing, thickness: 0.5 m Quartz alteration; Chalcopyrite; Quartz vein silicification; galena; limonitization malachite Tangi-Murch Bedded Celestite Small, thickness: 0.4 to 1.67 m, nd Celestite nd celestite extent: up to 170 m 19B.4.7 Coal Direct detection of coal was not attempted using spectral feature analysis of imaging spectrometer data, due to coal’s lack of diagnostic absorption features. A comparison of the 2-µm map of materials, which includes clays, carbonates, phyllosilicates, sulfates, and altered minerals, to known occurrences of coal (Abdullah and others, 1977) and the Lower to Middle Jurassic geologic unit associated with coal is shown in figure 19B–13. The known coal deposits appear to be associated with areas of kaolinite, kaolinite mixed with muscovite/clay/calcite, and calcite mixed with muscovite/illite. This pattern of minerals detected in the HyMap data within and around the Lower to Middle Jurassic geologic unit is the same pattern observed in the Takhar AOI (Kokaly and Johnson, chap. 26, this volume). Given this indication, further study of these associations and refinement of HyMap analysis using spectral measurements of field samples of surface materials common to the known coal resources is warranted. 19B.4.8 Celestite Celestite was not included as a reference material in the 1-µm or 2-µm MICA analyses of imaging spectrometer data. An examination of the 2-µm map of materials, which includes clays, carbonates, phyllosilicates, sulfates, and altered minerals, to the location of the Tangi-Murch celestite deposit (Abdullah and others, 1977) revealed the site to be surrounded by pixels that mapped as calcite. This is consistent with the deposit description as celestite hosted by bituminous limestone and surrounded by carbonate rocks. As described previously, calcite is the most abundantly mapped mineral in the area and, therefore, additional understanding of the spectral characteristics of the celestite mineral and the deposit need to be developed in order to derive methods to differentiate the deposit from other limestones and calcite-bearing rocks. 19B.5 Summary Carbonate minerals cover most of the Dudkash AOI. Muscovites were detected in greatest concentration in the mapped units of Mississippian and Late Triassic intrusive rocks in the southwest part of the Dudkash AOI and in the adjacent units, suggesting that mineral distributions detected with HyMap data could help in the refinement of lithologic contacts. Epidote and chlorite were found in spatially consistent patterns near the southern edge of the AOI in association with Namurian stage and Mississippian stratified rock units, also suggesting the mineral classes derived from imaging spectrometer data is revealing subdivisions in the mapped unit. Distinct patterns of kaolinite clays and gypsum occur in localized patterns, especially in the center of the AOI. Kaolinites were distributed mostly in Early and Middle Jurassic units, with additional occurrences of spatially consistent groups of pixels in Late Jurassic and Late Cretaceous units. In the center of the Dudkash AOI, kaolinite is found in Chapter 19B. Analysis of Imaging Spectrometer Data for the Dudkash Area of Interest 1391
  • 11. association with the Dudkash bedded gypsum mineral deposit. The spectral signature of gypsum was detected in the HyMap data in just a few pixels, some of which were adjacent to the mapped locations of the bedded gypsum mineral occurrence of Shuraw. Within and around rocks of Early to Middle Jurassic age, the known coal deposits appear to be associated with pixels in which kaolinite mixed with other materials was mapped in the HyMap data, an association also observed in the Takhar AOI (Kokaly and Johnson, chap. 26, this volume). Given these indications, more detailed analysis of HyMap data around these coal occurrences may help characterize and refine the distribution of this resource. The limestone host rock of celestite was detected; however, more detailed studies of the spectral characteristics of the celestite deposit and its host rocks are needed in order to characterize the resource and map its distribution using the HyMap imaging spectrometer data covering the Dudkash AOI. Figure 19B–6. Map of carbonates, phyllosilicates, sulfates, altered minerals, and other materials derived from HyMap data in the Dudkash area of interest. 1392 Summaries of Important Areas for Mineral Investment and Production Opportunities of Nonfuel Minerals in Afghanistan
  • 12. Figure 19B–7. Map of iron-bearing minerals and other materials derived from HyMap data in the Dudkash area of interest. Chapter 19B. Analysis of Imaging Spectrometer Data for the Dudkash Area of Interest 1393
  • 13. Figure 19B–8. Map of distribution of carbonate minerals derived from HyMap data in the Dudkash area of interest. 1394 Summaries of Important Areas for Mineral Investment and Production Opportunities of Nonfuel Minerals in Afghanistan
  • 14. Figure 19B–9. Map of distribution of clay and mica minerals derived from HyMap data in the Dudkash area of interest. Chapter 19B. Analysis of Imaging Spectrometer Data for the Dudkash Area of Interest 1395
  • 15. Figure 19B–10. Map of distribution of iron oxide and hydroxide derived from HyMap data in the Dudkash area of interest. 1396 Summaries of Important Areas for Mineral Investment and Production Opportunities of Nonfuel Minerals in Afghanistan
  • 16. Figure 19B–11. Map of distribution of common alteration minerals derived from HyMap data in the Dudkash area of interest. Chapter 19B. Analysis of Imaging Spectrometer Data for the Dudkash Area of Interest 1397
  • 17. Figure 19B–12. Map of distribution of common secondary minerals derived from HyMap data in the Dudkash area of interest. 1398 Summaries of Important Areas for Mineral Investment and Production Opportunities of Nonfuel Minerals in Afghanistan
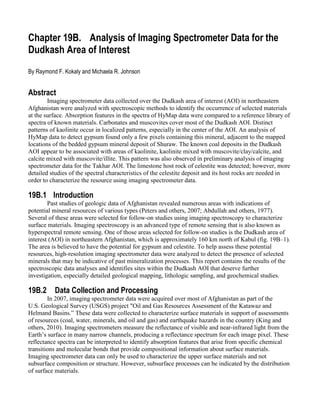
  • 18. Figure 19B–13. Map of carbonates, phyllosilicates, sulfates, altered minerals, and other materials derived from HyMap data in relation to known coal occurrences (Abdullah and others, 1977) in the Dudkash area of interest. 19B.6 References Cited Abdullah, Sh., and Chmyriov, V.M., 1977, Geological map of Afghanistan: Kabul, Afghanistan, Ministry of Mining and Industry of the Democratic Republic of Afghanistan, scale 1:500,000. Abdullah, Sh., Chmyriov, V.M., Stazhilo-Alekseev, K.F., Dronov, V.I., Gannan, P.J., Rossovskiy, L.N., Kafarskiy, A.Kh., and Malyarov, E.P., 1977, Mineral resources of Afghanistan (2d ed.): Kabul, Afghanistan, Republic of Afghanistan Geological and Mineral Survey, 419 p. Cocks, T., Jenssen, R., Stewart, A., Wilson, I., and Shields, T., 1998, The HyMap airborne hyperspectral sensor—The system, calibration and performance, in Schaepman, M., Schlapfer, D., and Itten, K.I., eds., Proceedings of the 1st EARSeL Workshop on Imaging Spectroscopy, 6–8 October 1998, Zurich: Paris, European Association of Remote Sensing Laboratories, p. 37–43. Davis, P.A., 2007, Landsat ETM+ false-color image mosaics of Afghanistan: U.S. Geological Survey Open-File Report 2007–1029, 22 p. (Also available at http://pubs.usgs.gov/of/2007/1029/.) Doebrich, J.L., and Wahl, R.R., comps., with contributions by Doebrich, J.L., Wahl, R.R., Ludington, S.D., Chirico, P.G., Wandrey, C.J., Bohannon, R.G., Orris, G.J., Bliss, J.D., Wasy, Abdul, and Younusi, M.O., 2006, Geologic and mineral resource map of Afghanistan: U.S. Geological Survey Open File Report 2006–1038, scale 1:850,000, available at http://pubs.usgs.gov/of/2006/1038/. Chapter 19B. Analysis of Imaging Spectrometer Data for the Dudkash Area of Interest 1399
  • 19. Hoefen, T.M., Kokaly, R.F., and King, T.V.V., 2010, Calibration of HyMap data covering the country of Afghanistan, in Proceedings of the 15th Australasian Remote Sensing and Photogrammetry Conference, Alice Springs, Australia, September 12–17, 2010, p. 409, available at http://dl.dropbox.com/u/81114/15ARSPC-Proceedings.zip/. King, T.V.V., Kokaly, R.F., Hoefen, T.M., and Knepper, D.H., 2010, Resource mapping in Afghanistan using HyMap data, in Proceedings of the 15th Australasian Remote Sensing and Photogrammetry Conference, Alice Springs, Australia, September 12–17, 2010, p. 500, available at http://dl.dropbox.com/u/81114/15ARSPC-Proceedings.zip/. King, T.V.V., Kokaly, R.F., Hoefen, T.M., Dudek, K. and Livo, K.E., 2011, Surface materials map of Afghanistan—Iron-bearing minerals and other materials: U.S. Geological Survey Scientific Investigations Map 3152–B. Kokaly, R.F., King, T.V.V., and Livo, K.E., 2008, Airborne hyperspectral survey of Afghanistan 2007: Flight line planning and HyMap data collection: U.S. Geological Survey Open-File Report 2008–1235, 14 p. Kokaly, Ray, 2011, PRISM—Processing routines in IDL for spectroscopic measurements: U.S. Geological Survey Open-File Report 2011–1155, available at http://pubs.usgs.gov/of/2011/1155/. Kokaly, R.F., King, T.V.V., Hoefen, T.M., Dudek, K. and Livo, K.E., 2011, Surface materials map of Afghanistan—Carbonates, phyllosilicates, sulfates, altered minerals, and other materials: U.S. Geological Survey Scientific Investigations Map 3152–A. Peters, S.G., Ludington, S.D., Orris, G.J., Sutphin, D.M., Bliss, J.D., and Rytuba, J.J., eds., and the U.S. Geological Survey-Afghanistan Ministry of Mines Joint Mineral Resource Assessment Team, 2007, Preliminary non-fuel mineral resource assessment of Afghanistan: U.S. Geological Survey Open-File Report 2007–1214, 810 p., 1 CD–ROM. (Also available at http://pubs.usgs.gov/of/2007/1214/.) 1400 Summaries of Important Areas for Mineral Investment and Production Opportunities of Nonfuel Minerals in Afghanistan