SlideShare a Scribd company logo
1 of 12
Stock Price per Month
               7
              6.5
Stock Price


               6
              5.5
               5
              4.5
               4
                    0   2        4       6      8   10   12
                                       Month
   The first step in creating a graph is collecting
    the data. This data could vary depending on
    what type of graph you are attempting to
    create. Typically this data is collected in the
    field through
    surveys, measurements, counting, collecting
    information, etc.
   Before putting your data together, you have
    to find a computer with Microsoft Excel
    loaded on it. Once you have found a
    computer, turn it on and search for Excel.
    Open the application, and you are prepared
    to start your graph.
   Be sure to save your spreadsheet before you
    begin. Ensure you remember the location to
    which you are saving it, either your hard drive
    or flash drive and the name of the file. It is
    standard to name the file something relevant
    to the data you researched.
   From here you can began entering your
    data into rows or columns. It’s ideal to
    create a table with the title of each row
    or column before the information in
    order to keep it well organized. As you
    can see to the right the information
    collected is placed below the title. To
    place the data in Excel, simply click on
    the cell (box) in which you want the
    information to go and type the
    information collected.
   Now you are prepared to insert your graph. Look at
    the top of Excel for a tab labeled insert. Click this tab
    and a menu of options appears as shown
    below, choose the type of graph that will best
    represent your information. This can either be a
    line, column, pie, bar, area, scatter, or many other
    graphs. The most common graph is a scatter plot.
   Have the data you want on the graph highlighted.
    Then select the type of graph you want. The graph
    should appear automatically. If the graph didn’t
    automatically appear, you will need to take another
    step to get the data on the graph.
   Right click on the empty chart and choose select data. Once
    this new window opens, you will select add. Here you can do
    a couple things. You can label the title of the graph by typing
    under the series name. This image is pictured below. Then
    you can add your data. Here you can click in the box for
    Series X values and then click and scroll through the data
    you would like on the x-axis (example here 1 through 12).
    From here you can do the same for the data on the y-axis.
   To create labels on the x and y axis, you will first need to click
    on an open area of the graph. Once you have done this, you
    should see an option at the top of Excel labeled Chart Tools
    and Layout. Select Layout and locate the item Axis Titles.
    Here you can select the vertical and horizontal axis titles and
    where you want them located on the graph. Once you select
    the type you would like, type the title of the axis.
   From the same layout
    tab you could create a
    legend by selecting
    the location you
    would want your
    legend. This will
    allow the person
    viewing your graph to
    have a better
    understanding of
    what is going on.
   Looking under the chart tools tab at the top of
    the screen, you can add many different features
    to your graph. From the design tab you can
    change the color, change the layout design, and
    switch the column and rows. From the Layout
    tab you can add pictures, shapes, text
    box, titles, add gridlines and trendlines, change
    chart name, and customize your axes. Then
    from the format tab, you can change the colors
    of various parts of the graph and add different
    effects to emphasize different points of the
    graph.
   It’s very simple to edit your
    graph. You can do this by
    double clicking or right
    clicking and choosing format
    on the item you want edited.
    This can either be the
    axis, chart
    title, gridlines, legend, data
    points, or the line. From here
    you can choose to change the
    colors, numbers, alignment, a
    nd various options depending
    on what you are trying to
    edit.

More Related Content

What's hot

What's hot (20)

Introduction of ms excel
Introduction of ms excelIntroduction of ms excel
Introduction of ms excel
 
Charts in EXCEL
Charts in EXCELCharts in EXCEL
Charts in EXCEL
 
Ms excel
Ms excelMs excel
Ms excel
 
Text formatting in ms word ppt
Text formatting in ms word pptText formatting in ms word ppt
Text formatting in ms word ppt
 
Microsoft Excel Basics
Microsoft Excel BasicsMicrosoft Excel Basics
Microsoft Excel Basics
 
Training On Microsoft Excel
Training On Microsoft ExcelTraining On Microsoft Excel
Training On Microsoft Excel
 
Excel Tutorial
Excel TutorialExcel Tutorial
Excel Tutorial
 
MS Excel 2nd
MS Excel 2ndMS Excel 2nd
MS Excel 2nd
 
ms excel presentation...
ms excel presentation...ms excel presentation...
ms excel presentation...
 
Excel lesson01
Excel lesson01Excel lesson01
Excel lesson01
 
Charts and graphs in excel
Charts and graphs in excelCharts and graphs in excel
Charts and graphs in excel
 
Making a Chart Using Excel
Making a Chart Using ExcelMaking a Chart Using Excel
Making a Chart Using Excel
 
Spreadsheet Concepts
Spreadsheet ConceptsSpreadsheet Concepts
Spreadsheet Concepts
 
Introduction to Microsoft Excel for beginners
Introduction to Microsoft Excel for beginnersIntroduction to Microsoft Excel for beginners
Introduction to Microsoft Excel for beginners
 
03 Excel formulas and functions
03 Excel formulas and functions03 Excel formulas and functions
03 Excel formulas and functions
 
Microsoft word
Microsoft wordMicrosoft word
Microsoft word
 
sorting and filtering data in excel
sorting and filtering data in excelsorting and filtering data in excel
sorting and filtering data in excel
 
Excel PowerPoint
Excel PowerPointExcel PowerPoint
Excel PowerPoint
 
Ms excel
Ms excelMs excel
Ms excel
 
Ms excel ppt
Ms excel pptMs excel ppt
Ms excel ppt
 

Viewers also liked

Creating tables and graphs (excel) 2011 2012
Creating tables and graphs (excel) 2011 2012Creating tables and graphs (excel) 2011 2012
Creating tables and graphs (excel) 2011 2012giordepasamba
 
How to graph in excel
How to graph in excelHow to graph in excel
How to graph in excelilanasaxe
 
How to Insert a Graph into Microsoft Excel 2007
How to Insert a Graph into Microsoft Excel 2007How to Insert a Graph into Microsoft Excel 2007
How to Insert a Graph into Microsoft Excel 2007nfasano
 
MS EXCEL PPT PRESENTATION
MS EXCEL PPT PRESENTATIONMS EXCEL PPT PRESENTATION
MS EXCEL PPT PRESENTATIONMridul Bansal
 
20160727 - How to Create a Stacked-Cluster Graph in Excel
20160727 - How to Create a Stacked-Cluster Graph in Excel20160727 - How to Create a Stacked-Cluster Graph in Excel
20160727 - How to Create a Stacked-Cluster Graph in ExcelZaid Kadwa
 
Types of graphs
Types of graphsTypes of graphs
Types of graphsbweldon
 
Teaching Excel
Teaching ExcelTeaching Excel
Teaching Excelsam ran
 
Excel graphs & charts final narration
Excel graphs & charts final narrationExcel graphs & charts final narration
Excel graphs & charts final narrationjmd197961
 
$5 COUPON LINK - Excel Udemy Course: Excel with Excel Dynamic Graphs, Dashboa...
$5 COUPON LINK - Excel Udemy Course: Excel with Excel Dynamic Graphs, Dashboa...$5 COUPON LINK - Excel Udemy Course: Excel with Excel Dynamic Graphs, Dashboa...
$5 COUPON LINK - Excel Udemy Course: Excel with Excel Dynamic Graphs, Dashboa...mellontraining
 
Graph project
Graph projectGraph project
Graph projectdiazjhhs
 
Excel graphs & charts
Excel graphs & chartsExcel graphs & charts
Excel graphs & chartsjmd197961
 
Chicken Hypnosis & Bad Presentations #PresentationTips
Chicken Hypnosis & Bad Presentations #PresentationTipsChicken Hypnosis & Bad Presentations #PresentationTips
Chicken Hypnosis & Bad Presentations #PresentationTipsNadine Hanafi
 
If Function In Excel
If Function In ExcelIf Function In Excel
If Function In Exceldinesh takyar
 
Show, Don't (Just) Tell: The Visual Proposal That Landed Me a Dream Gig! #Pre...
Show, Don't (Just) Tell: The Visual Proposal That Landed Me a Dream Gig! #Pre...Show, Don't (Just) Tell: The Visual Proposal That Landed Me a Dream Gig! #Pre...
Show, Don't (Just) Tell: The Visual Proposal That Landed Me a Dream Gig! #Pre...Nadine Hanafi
 

Viewers also liked (20)

Creating tables and graphs (excel) 2011 2012
Creating tables and graphs (excel) 2011 2012Creating tables and graphs (excel) 2011 2012
Creating tables and graphs (excel) 2011 2012
 
How to graph in excel
How to graph in excelHow to graph in excel
How to graph in excel
 
How to Insert a Graph into Microsoft Excel 2007
How to Insert a Graph into Microsoft Excel 2007How to Insert a Graph into Microsoft Excel 2007
How to Insert a Graph into Microsoft Excel 2007
 
Excel Graph Steps
Excel Graph StepsExcel Graph Steps
Excel Graph Steps
 
MS EXCEL PPT PRESENTATION
MS EXCEL PPT PRESENTATIONMS EXCEL PPT PRESENTATION
MS EXCEL PPT PRESENTATION
 
20160727 - How to Create a Stacked-Cluster Graph in Excel
20160727 - How to Create a Stacked-Cluster Graph in Excel20160727 - How to Create a Stacked-Cluster Graph in Excel
20160727 - How to Create a Stacked-Cluster Graph in Excel
 
Charts And Graphs
Charts And GraphsCharts And Graphs
Charts And Graphs
 
Types of graphs
Types of graphsTypes of graphs
Types of graphs
 
Graphs ppt
Graphs pptGraphs ppt
Graphs ppt
 
Teaching Excel
Teaching ExcelTeaching Excel
Teaching Excel
 
Excel graphs & charts final narration
Excel graphs & charts final narrationExcel graphs & charts final narration
Excel graphs & charts final narration
 
$5 COUPON LINK - Excel Udemy Course: Excel with Excel Dynamic Graphs, Dashboa...
$5 COUPON LINK - Excel Udemy Course: Excel with Excel Dynamic Graphs, Dashboa...$5 COUPON LINK - Excel Udemy Course: Excel with Excel Dynamic Graphs, Dashboa...
$5 COUPON LINK - Excel Udemy Course: Excel with Excel Dynamic Graphs, Dashboa...
 
Graph project
Graph projectGraph project
Graph project
 
Chapter10
Chapter10Chapter10
Chapter10
 
Excel graphs & charts
Excel graphs & chartsExcel graphs & charts
Excel graphs & charts
 
Chapter9
Chapter9Chapter9
Chapter9
 
Chicken Hypnosis & Bad Presentations #PresentationTips
Chicken Hypnosis & Bad Presentations #PresentationTipsChicken Hypnosis & Bad Presentations #PresentationTips
Chicken Hypnosis & Bad Presentations #PresentationTips
 
If Function In Excel
If Function In ExcelIf Function In Excel
If Function In Excel
 
Show, Don't (Just) Tell: The Visual Proposal That Landed Me a Dream Gig! #Pre...
Show, Don't (Just) Tell: The Visual Proposal That Landed Me a Dream Gig! #Pre...Show, Don't (Just) Tell: The Visual Proposal That Landed Me a Dream Gig! #Pre...
Show, Don't (Just) Tell: The Visual Proposal That Landed Me a Dream Gig! #Pre...
 
Pie Chart In Excel
Pie Chart In ExcelPie Chart In Excel
Pie Chart In Excel
 

Similar to Creating a graph in excel

How to Insert a Graph Into Microsoft Excel 2007
How to Insert a Graph Into Microsoft Excel 2007How to Insert a Graph Into Microsoft Excel 2007
How to Insert a Graph Into Microsoft Excel 2007nfasano
 
Graphing Using Excel Part Ii 2008 Finished
Graphing Using Excel Part Ii 2008 FinishedGraphing Using Excel Part Ii 2008 Finished
Graphing Using Excel Part Ii 2008 FinishedStephanie
 
Lesson 16 Working With Charts
Lesson 16   Working With ChartsLesson 16   Working With Charts
Lesson 16 Working With Chartsguevarra_2000
 
Lesson11 working with charts
Lesson11 working with chartsLesson11 working with charts
Lesson11 working with chartsricsanmae
 
Pivot-Table-Handout1-projectcubicle lecture notes
Pivot-Table-Handout1-projectcubicle lecture notesPivot-Table-Handout1-projectcubicle lecture notes
Pivot-Table-Handout1-projectcubicle lecture notesProject Cubicle
 
Lesson 11 working with charts
Lesson 11   working with chartsLesson 11   working with charts
Lesson 11 working with chartsguevarra_2000
 
Lesson 10 working with charts
Lesson 10   working with chartsLesson 10   working with charts
Lesson 10 working with chartsguevarra_2000
 
Excel Graphs Charts
Excel Graphs ChartsExcel Graphs Charts
Excel Graphs Chartssimply_coool
 
Introduction to Excel
Introduction to ExcelIntroduction to Excel
Introduction to ExcelNajma Alam
 
Exp2003 exl ppt_03
Exp2003 exl ppt_03Exp2003 exl ppt_03
Exp2003 exl ppt_03lonetree
 
Excel 2007 create a chart
Excel 2007    create a chartExcel 2007    create a chart
Excel 2007 create a chartrezaulslide
 

Similar to Creating a graph in excel (20)

How to Insert a Graph Into Microsoft Excel 2007
How to Insert a Graph Into Microsoft Excel 2007How to Insert a Graph Into Microsoft Excel 2007
How to Insert a Graph Into Microsoft Excel 2007
 
Print16
Print16Print16
Print16
 
Graphing Using Excel Part Ii 2008 Finished
Graphing Using Excel Part Ii 2008 FinishedGraphing Using Excel Part Ii 2008 Finished
Graphing Using Excel Part Ii 2008 Finished
 
Lesson 16 Working With Charts
Lesson 16   Working With ChartsLesson 16   Working With Charts
Lesson 16 Working With Charts
 
Lesson11 working with charts
Lesson11 working with chartsLesson11 working with charts
Lesson11 working with charts
 
04 ms excel
04 ms excel04 ms excel
04 ms excel
 
Pivot-Table-Handout1-projectcubicle lecture notes
Pivot-Table-Handout1-projectcubicle lecture notesPivot-Table-Handout1-projectcubicle lecture notes
Pivot-Table-Handout1-projectcubicle lecture notes
 
Dealing with data-excel
Dealing with data-excelDealing with data-excel
Dealing with data-excel
 
MS Excel 2010 tutorial 6
MS Excel 2010 tutorial 6MS Excel 2010 tutorial 6
MS Excel 2010 tutorial 6
 
Computer midterms
Computer midtermsComputer midterms
Computer midterms
 
Lesson 11 working with charts
Lesson 11   working with chartsLesson 11   working with charts
Lesson 11 working with charts
 
Lesson 10 working with charts
Lesson 10   working with chartsLesson 10   working with charts
Lesson 10 working with charts
 
Excel training create a chart
Excel training create a chartExcel training create a chart
Excel training create a chart
 
Excel 2007 - Create a chart
Excel 2007 - Create a chartExcel 2007 - Create a chart
Excel 2007 - Create a chart
 
Excel Graphs Charts
Excel Graphs ChartsExcel Graphs Charts
Excel Graphs Charts
 
Introduction to Excel
Introduction to ExcelIntroduction to Excel
Introduction to Excel
 
excell.pdf
excell.pdfexcell.pdf
excell.pdf
 
ms_excel.pdf
ms_excel.pdfms_excel.pdf
ms_excel.pdf
 
Exp2003 exl ppt_03
Exp2003 exl ppt_03Exp2003 exl ppt_03
Exp2003 exl ppt_03
 
Excel 2007 create a chart
Excel 2007    create a chartExcel 2007    create a chart
Excel 2007 create a chart
 

Recently uploaded

Presentation on how to chat with PDF using ChatGPT code interpreter
Presentation on how to chat with PDF using ChatGPT code interpreterPresentation on how to chat with PDF using ChatGPT code interpreter
Presentation on how to chat with PDF using ChatGPT code interpreternaman860154
 
Benefits Of Flutter Compared To Other Frameworks
Benefits Of Flutter Compared To Other FrameworksBenefits Of Flutter Compared To Other Frameworks
Benefits Of Flutter Compared To Other FrameworksSoftradix Technologies
 
Transcript: #StandardsGoals for 2024: What’s new for BISAC - Tech Forum 2024
Transcript: #StandardsGoals for 2024: What’s new for BISAC - Tech Forum 2024Transcript: #StandardsGoals for 2024: What’s new for BISAC - Tech Forum 2024
Transcript: #StandardsGoals for 2024: What’s new for BISAC - Tech Forum 2024BookNet Canada
 
FULL ENJOY 🔝 8264348440 🔝 Call Girls in Diplomatic Enclave | Delhi
FULL ENJOY 🔝 8264348440 🔝 Call Girls in Diplomatic Enclave | DelhiFULL ENJOY 🔝 8264348440 🔝 Call Girls in Diplomatic Enclave | Delhi
FULL ENJOY 🔝 8264348440 🔝 Call Girls in Diplomatic Enclave | Delhisoniya singh
 
Transforming Data Streams with Kafka Connect: An Introduction to Single Messa...
Transforming Data Streams with Kafka Connect: An Introduction to Single Messa...Transforming Data Streams with Kafka Connect: An Introduction to Single Messa...
Transforming Data Streams with Kafka Connect: An Introduction to Single Messa...HostedbyConfluent
 
[2024]Digital Global Overview Report 2024 Meltwater.pdf
[2024]Digital Global Overview Report 2024 Meltwater.pdf[2024]Digital Global Overview Report 2024 Meltwater.pdf
[2024]Digital Global Overview Report 2024 Meltwater.pdfhans926745
 
Install Stable Diffusion in windows machine
Install Stable Diffusion in windows machineInstall Stable Diffusion in windows machine
Install Stable Diffusion in windows machinePadma Pradeep
 
From Event to Action: Accelerate Your Decision Making with Real-Time Automation
From Event to Action: Accelerate Your Decision Making with Real-Time AutomationFrom Event to Action: Accelerate Your Decision Making with Real-Time Automation
From Event to Action: Accelerate Your Decision Making with Real-Time AutomationSafe Software
 
Swan(sea) Song – personal research during my six years at Swansea ... and bey...
Swan(sea) Song – personal research during my six years at Swansea ... and bey...Swan(sea) Song – personal research during my six years at Swansea ... and bey...
Swan(sea) Song – personal research during my six years at Swansea ... and bey...Alan Dix
 
Beyond Boundaries: Leveraging No-Code Solutions for Industry Innovation
Beyond Boundaries: Leveraging No-Code Solutions for Industry InnovationBeyond Boundaries: Leveraging No-Code Solutions for Industry Innovation
Beyond Boundaries: Leveraging No-Code Solutions for Industry InnovationSafe Software
 
How to convert PDF to text with Nanonets
How to convert PDF to text with NanonetsHow to convert PDF to text with Nanonets
How to convert PDF to text with Nanonetsnaman860154
 
Handwritten Text Recognition for manuscripts and early printed texts
Handwritten Text Recognition for manuscripts and early printed textsHandwritten Text Recognition for manuscripts and early printed texts
Handwritten Text Recognition for manuscripts and early printed textsMaria Levchenko
 
Human Factors of XR: Using Human Factors to Design XR Systems
Human Factors of XR: Using Human Factors to Design XR SystemsHuman Factors of XR: Using Human Factors to Design XR Systems
Human Factors of XR: Using Human Factors to Design XR SystemsMark Billinghurst
 
08448380779 Call Girls In Greater Kailash - I Women Seeking Men
08448380779 Call Girls In Greater Kailash - I Women Seeking Men08448380779 Call Girls In Greater Kailash - I Women Seeking Men
08448380779 Call Girls In Greater Kailash - I Women Seeking MenDelhi Call girls
 
08448380779 Call Girls In Friends Colony Women Seeking Men
08448380779 Call Girls In Friends Colony Women Seeking Men08448380779 Call Girls In Friends Colony Women Seeking Men
08448380779 Call Girls In Friends Colony Women Seeking MenDelhi Call girls
 
Pigging Solutions in Pet Food Manufacturing
Pigging Solutions in Pet Food ManufacturingPigging Solutions in Pet Food Manufacturing
Pigging Solutions in Pet Food ManufacturingPigging Solutions
 
Neo4j - How KGs are shaping the future of Generative AI at AWS Summit London ...
Neo4j - How KGs are shaping the future of Generative AI at AWS Summit London ...Neo4j - How KGs are shaping the future of Generative AI at AWS Summit London ...
Neo4j - How KGs are shaping the future of Generative AI at AWS Summit London ...Neo4j
 
#StandardsGoals for 2024: What’s new for BISAC - Tech Forum 2024
#StandardsGoals for 2024: What’s new for BISAC - Tech Forum 2024#StandardsGoals for 2024: What’s new for BISAC - Tech Forum 2024
#StandardsGoals for 2024: What’s new for BISAC - Tech Forum 2024BookNet Canada
 
Enhancing Worker Digital Experience: A Hands-on Workshop for Partners
Enhancing Worker Digital Experience: A Hands-on Workshop for PartnersEnhancing Worker Digital Experience: A Hands-on Workshop for Partners
Enhancing Worker Digital Experience: A Hands-on Workshop for PartnersThousandEyes
 
08448380779 Call Girls In Diplomatic Enclave Women Seeking Men
08448380779 Call Girls In Diplomatic Enclave Women Seeking Men08448380779 Call Girls In Diplomatic Enclave Women Seeking Men
08448380779 Call Girls In Diplomatic Enclave Women Seeking MenDelhi Call girls
 

Recently uploaded (20)

Presentation on how to chat with PDF using ChatGPT code interpreter
Presentation on how to chat with PDF using ChatGPT code interpreterPresentation on how to chat with PDF using ChatGPT code interpreter
Presentation on how to chat with PDF using ChatGPT code interpreter
 
Benefits Of Flutter Compared To Other Frameworks
Benefits Of Flutter Compared To Other FrameworksBenefits Of Flutter Compared To Other Frameworks
Benefits Of Flutter Compared To Other Frameworks
 
Transcript: #StandardsGoals for 2024: What’s new for BISAC - Tech Forum 2024
Transcript: #StandardsGoals for 2024: What’s new for BISAC - Tech Forum 2024Transcript: #StandardsGoals for 2024: What’s new for BISAC - Tech Forum 2024
Transcript: #StandardsGoals for 2024: What’s new for BISAC - Tech Forum 2024
 
FULL ENJOY 🔝 8264348440 🔝 Call Girls in Diplomatic Enclave | Delhi
FULL ENJOY 🔝 8264348440 🔝 Call Girls in Diplomatic Enclave | DelhiFULL ENJOY 🔝 8264348440 🔝 Call Girls in Diplomatic Enclave | Delhi
FULL ENJOY 🔝 8264348440 🔝 Call Girls in Diplomatic Enclave | Delhi
 
Transforming Data Streams with Kafka Connect: An Introduction to Single Messa...
Transforming Data Streams with Kafka Connect: An Introduction to Single Messa...Transforming Data Streams with Kafka Connect: An Introduction to Single Messa...
Transforming Data Streams with Kafka Connect: An Introduction to Single Messa...
 
[2024]Digital Global Overview Report 2024 Meltwater.pdf
[2024]Digital Global Overview Report 2024 Meltwater.pdf[2024]Digital Global Overview Report 2024 Meltwater.pdf
[2024]Digital Global Overview Report 2024 Meltwater.pdf
 
Install Stable Diffusion in windows machine
Install Stable Diffusion in windows machineInstall Stable Diffusion in windows machine
Install Stable Diffusion in windows machine
 
From Event to Action: Accelerate Your Decision Making with Real-Time Automation
From Event to Action: Accelerate Your Decision Making with Real-Time AutomationFrom Event to Action: Accelerate Your Decision Making with Real-Time Automation
From Event to Action: Accelerate Your Decision Making with Real-Time Automation
 
Swan(sea) Song – personal research during my six years at Swansea ... and bey...
Swan(sea) Song – personal research during my six years at Swansea ... and bey...Swan(sea) Song – personal research during my six years at Swansea ... and bey...
Swan(sea) Song – personal research during my six years at Swansea ... and bey...
 
Beyond Boundaries: Leveraging No-Code Solutions for Industry Innovation
Beyond Boundaries: Leveraging No-Code Solutions for Industry InnovationBeyond Boundaries: Leveraging No-Code Solutions for Industry Innovation
Beyond Boundaries: Leveraging No-Code Solutions for Industry Innovation
 
How to convert PDF to text with Nanonets
How to convert PDF to text with NanonetsHow to convert PDF to text with Nanonets
How to convert PDF to text with Nanonets
 
Handwritten Text Recognition for manuscripts and early printed texts
Handwritten Text Recognition for manuscripts and early printed textsHandwritten Text Recognition for manuscripts and early printed texts
Handwritten Text Recognition for manuscripts and early printed texts
 
Human Factors of XR: Using Human Factors to Design XR Systems
Human Factors of XR: Using Human Factors to Design XR SystemsHuman Factors of XR: Using Human Factors to Design XR Systems
Human Factors of XR: Using Human Factors to Design XR Systems
 
08448380779 Call Girls In Greater Kailash - I Women Seeking Men
08448380779 Call Girls In Greater Kailash - I Women Seeking Men08448380779 Call Girls In Greater Kailash - I Women Seeking Men
08448380779 Call Girls In Greater Kailash - I Women Seeking Men
 
08448380779 Call Girls In Friends Colony Women Seeking Men
08448380779 Call Girls In Friends Colony Women Seeking Men08448380779 Call Girls In Friends Colony Women Seeking Men
08448380779 Call Girls In Friends Colony Women Seeking Men
 
Pigging Solutions in Pet Food Manufacturing
Pigging Solutions in Pet Food ManufacturingPigging Solutions in Pet Food Manufacturing
Pigging Solutions in Pet Food Manufacturing
 
Neo4j - How KGs are shaping the future of Generative AI at AWS Summit London ...
Neo4j - How KGs are shaping the future of Generative AI at AWS Summit London ...Neo4j - How KGs are shaping the future of Generative AI at AWS Summit London ...
Neo4j - How KGs are shaping the future of Generative AI at AWS Summit London ...
 
#StandardsGoals for 2024: What’s new for BISAC - Tech Forum 2024
#StandardsGoals for 2024: What’s new for BISAC - Tech Forum 2024#StandardsGoals for 2024: What’s new for BISAC - Tech Forum 2024
#StandardsGoals for 2024: What’s new for BISAC - Tech Forum 2024
 
Enhancing Worker Digital Experience: A Hands-on Workshop for Partners
Enhancing Worker Digital Experience: A Hands-on Workshop for PartnersEnhancing Worker Digital Experience: A Hands-on Workshop for Partners
Enhancing Worker Digital Experience: A Hands-on Workshop for Partners
 
08448380779 Call Girls In Diplomatic Enclave Women Seeking Men
08448380779 Call Girls In Diplomatic Enclave Women Seeking Men08448380779 Call Girls In Diplomatic Enclave Women Seeking Men
08448380779 Call Girls In Diplomatic Enclave Women Seeking Men
 

Creating a graph in excel

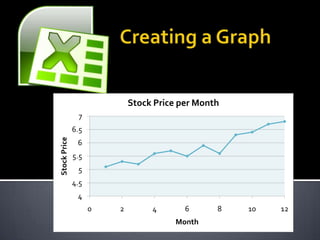
  • 1. Stock Price per Month 7 6.5 Stock Price 6 5.5 5 4.5 4 0 2 4 6 8 10 12 Month
  • 2. The first step in creating a graph is collecting the data. This data could vary depending on what type of graph you are attempting to create. Typically this data is collected in the field through surveys, measurements, counting, collecting information, etc.
  • 3. Before putting your data together, you have to find a computer with Microsoft Excel loaded on it. Once you have found a computer, turn it on and search for Excel. Open the application, and you are prepared to start your graph.
  • 4. Be sure to save your spreadsheet before you begin. Ensure you remember the location to which you are saving it, either your hard drive or flash drive and the name of the file. It is standard to name the file something relevant to the data you researched.
  • 5. From here you can began entering your data into rows or columns. It’s ideal to create a table with the title of each row or column before the information in order to keep it well organized. As you can see to the right the information collected is placed below the title. To place the data in Excel, simply click on the cell (box) in which you want the information to go and type the information collected.
  • 6. Now you are prepared to insert your graph. Look at the top of Excel for a tab labeled insert. Click this tab and a menu of options appears as shown below, choose the type of graph that will best represent your information. This can either be a line, column, pie, bar, area, scatter, or many other graphs. The most common graph is a scatter plot.
  • 7. Have the data you want on the graph highlighted. Then select the type of graph you want. The graph should appear automatically. If the graph didn’t automatically appear, you will need to take another step to get the data on the graph.
  • 8. Right click on the empty chart and choose select data. Once this new window opens, you will select add. Here you can do a couple things. You can label the title of the graph by typing under the series name. This image is pictured below. Then you can add your data. Here you can click in the box for Series X values and then click and scroll through the data you would like on the x-axis (example here 1 through 12). From here you can do the same for the data on the y-axis.
  • 9. To create labels on the x and y axis, you will first need to click on an open area of the graph. Once you have done this, you should see an option at the top of Excel labeled Chart Tools and Layout. Select Layout and locate the item Axis Titles. Here you can select the vertical and horizontal axis titles and where you want them located on the graph. Once you select the type you would like, type the title of the axis.
  • 10. From the same layout tab you could create a legend by selecting the location you would want your legend. This will allow the person viewing your graph to have a better understanding of what is going on.
  • 11. Looking under the chart tools tab at the top of the screen, you can add many different features to your graph. From the design tab you can change the color, change the layout design, and switch the column and rows. From the Layout tab you can add pictures, shapes, text box, titles, add gridlines and trendlines, change chart name, and customize your axes. Then from the format tab, you can change the colors of various parts of the graph and add different effects to emphasize different points of the graph.
  • 12. It’s very simple to edit your graph. You can do this by double clicking or right clicking and choosing format on the item you want edited. This can either be the axis, chart title, gridlines, legend, data points, or the line. From here you can choose to change the colors, numbers, alignment, a nd various options depending on what you are trying to edit.