SlideShare une entreprise Scribd logo
1  sur  8
hombres: 45,95 muertes/1.000 nacimientos
mujeres: 38,18 muertes/1.000 nacimientos (2011 est.)


                Tasa de
                                                Cambio           Fecha de la
    Año        mortalidad      Posición
                                               Porcentual       Información
                infantil
       2003          56.05                64                       2003 est.
       2004          53.11                62       -5.25%          2004 est.
       2005          53.11                61        0.00%          2005 est.
       2006          51.77                61       -2.52%          2006 est.
       2007          50.43                58       -2.59%          2007 est.
       2008          49.09                55       -2.66%          2008 est.
       2009          44.66                58       -9.02%          2009 est.
       2010          43.41                62       -2.80%          2010 est.
       2011          42.16                60       -2.88%          2011 est


              Tasa de mortalidad infantil: total: 42,16 muertes/1.000 nacimientos
              hombres: 45,95 muertes/1.000 nacimientos
              mujeres: 38,18 muertes/1.000 nacimientos (2011 est.)

              Año            Tasa de mortalidad infantil Cambio Porcentual de la Información
                                           Posición                   Fecha
                      2003           56.05            64              2003 est.
                      2004           53.11            62      -5.25% 2004 est.
                      2005           53.11            61       0.00% 2005 est.
                      2006           51.77            61      -2.52% 2006 est.
                      2007           50.43            58      -2.59% 2007 est.
                      2008           49.09            55      -2.66% 2008 est.
                      2009           44.66            58      -9.02% 2009 est.
                      2010           43.41            62      -2.80% 2010 est.
                      2011           42.16            60      -2.88% 2011 est


                               Tasa de                           Cambio         Fecha de la
                    Año                         Posición
                              natalidad                         Porcentual     Información
                      2003          25.53                  81                     2003 est.
                      2004          23.76                  81        -6.93%       2004 est.
                      2005          23.76                  81         0.00%       2005 est.
                      2006           23.3                  81        -1.94%       2006 est.
                      2007          22.82                  85        -2.06%       2007 est.
                      2008          22.31                  85        -2.23%       2008 est.
                      2009          25.82                  66        15.73%       2009 est.
2010         25.16              63       -2.56%       2010 est.
  2011         24.71              64       -1.79%       2011 est


          Tasa de                       Cambio       Fecha de la
Año                    Posición
         fertilidad                    Porcentual   Información
  2003          3.23              80                    2003 est.
  2004          2.94              87       -8.98%       2004 est.
  2005          2.94              88        0.00%       2005 est.
  2006          2.85              88       -3.06%       2006 est.
  2007          2.76              88       -3.16%       2007 est.
  2008          2.67              88       -3.26%       2008 est.
  2009          3.17              66       18.73%       2009 est.
  2010          3.07              64       -3.15%       2010 est.
  2011             3              65       -2.28%       2011 est.


                                        Cambio       Fecha de la
Año      Población     Posición
                                       Porcentual   Información


  2003    8,586,443               86                July 2003 est.

  2004    8,857,870               86        3.16% July 2005 est.

  2005    8,857,870               86        0.00% July 2005 est.

  2006    8,989,046               86        1.48% July 2006 est.

  2007    9,119,152               86        1.45% July 2007 est.

  2008    9,247,816               87        1.41% July 2008 est.

  2009    9,775,246               84        5.70% July 2009 est.

  2010    9,947,418               84        1.76% July 2010 est.

  2011   10,118,683               83        1.72% July 2011 est.


       Expectativa
                                        Cambio       Fecha de la
Año     de vida al     Posición
                                       Porcentual   Información
          nacer
  2003        64.78          153                        2003 est.
  2004         65.5          154            1.11%       2004 est.
2005    65.5   155   0.00%   2005 est.
2006   65.84   155   0.52%   2006 est.
2007   66.19   153   0.53%   2007 est.
2008   66.53   155   0.51%   2008 est.
2009   66.89   155   0.54%   2009 est.
2010   67.23   155   0.51%   2010 est.
2011   67.57   156   0.51%   2011 est.
Fecha de la Información
Distribución por edad: 0-14 años: 34,6% (hombres 1.785.453/mujeres 1.719.173)
15-64 años: 60,7% (hombres 3.014.419/mujeres 3.129.942)


65 años y más: 4,6% (hombres 207.792/mujeres 261.904) (2011 est.)


Distribución por sexo: al nacer: 1,05 hombre(s)/mujer
menores de 15 años: 1,04 hombre(s)/mujer
15-64 años: 0,96 hombre(s)/mujer
65 años y más: 0,79 hombre(s)/mujer
población total: 0,98 hombre(s)/mujer (2011 est.)
53/mujeres 1.719.173)

Contenu connexe

En vedette

2024 State of Marketing Report – by Hubspot
2024 State of Marketing Report – by Hubspot2024 State of Marketing Report – by Hubspot
2024 State of Marketing Report – by HubspotMarius Sescu
 
Everything You Need To Know About ChatGPT
Everything You Need To Know About ChatGPTEverything You Need To Know About ChatGPT
Everything You Need To Know About ChatGPTExpeed Software
 
Product Design Trends in 2024 | Teenage Engineerings
Product Design Trends in 2024 | Teenage EngineeringsProduct Design Trends in 2024 | Teenage Engineerings
Product Design Trends in 2024 | Teenage EngineeringsPixeldarts
 
How Race, Age and Gender Shape Attitudes Towards Mental Health
How Race, Age and Gender Shape Attitudes Towards Mental HealthHow Race, Age and Gender Shape Attitudes Towards Mental Health
How Race, Age and Gender Shape Attitudes Towards Mental HealthThinkNow
 
AI Trends in Creative Operations 2024 by Artwork Flow.pdf
AI Trends in Creative Operations 2024 by Artwork Flow.pdfAI Trends in Creative Operations 2024 by Artwork Flow.pdf
AI Trends in Creative Operations 2024 by Artwork Flow.pdfmarketingartwork
 
PEPSICO Presentation to CAGNY Conference Feb 2024
PEPSICO Presentation to CAGNY Conference Feb 2024PEPSICO Presentation to CAGNY Conference Feb 2024
PEPSICO Presentation to CAGNY Conference Feb 2024Neil Kimberley
 
Content Methodology: A Best Practices Report (Webinar)
Content Methodology: A Best Practices Report (Webinar)Content Methodology: A Best Practices Report (Webinar)
Content Methodology: A Best Practices Report (Webinar)contently
 
How to Prepare For a Successful Job Search for 2024
How to Prepare For a Successful Job Search for 2024How to Prepare For a Successful Job Search for 2024
How to Prepare For a Successful Job Search for 2024Albert Qian
 
Social Media Marketing Trends 2024 // The Global Indie Insights
Social Media Marketing Trends 2024 // The Global Indie InsightsSocial Media Marketing Trends 2024 // The Global Indie Insights
Social Media Marketing Trends 2024 // The Global Indie InsightsKurio // The Social Media Age(ncy)
 
Trends In Paid Search: Navigating The Digital Landscape In 2024
Trends In Paid Search: Navigating The Digital Landscape In 2024Trends In Paid Search: Navigating The Digital Landscape In 2024
Trends In Paid Search: Navigating The Digital Landscape In 2024Search Engine Journal
 
5 Public speaking tips from TED - Visualized summary
5 Public speaking tips from TED - Visualized summary5 Public speaking tips from TED - Visualized summary
5 Public speaking tips from TED - Visualized summarySpeakerHub
 
ChatGPT and the Future of Work - Clark Boyd
ChatGPT and the Future of Work - Clark Boyd ChatGPT and the Future of Work - Clark Boyd
ChatGPT and the Future of Work - Clark Boyd Clark Boyd
 
Getting into the tech field. what next
Getting into the tech field. what next Getting into the tech field. what next
Getting into the tech field. what next Tessa Mero
 
Google's Just Not That Into You: Understanding Core Updates & Search Intent
Google's Just Not That Into You: Understanding Core Updates & Search IntentGoogle's Just Not That Into You: Understanding Core Updates & Search Intent
Google's Just Not That Into You: Understanding Core Updates & Search IntentLily Ray
 
Time Management & Productivity - Best Practices
Time Management & Productivity -  Best PracticesTime Management & Productivity -  Best Practices
Time Management & Productivity - Best PracticesVit Horky
 
The six step guide to practical project management
The six step guide to practical project managementThe six step guide to practical project management
The six step guide to practical project managementMindGenius
 
Beginners Guide to TikTok for Search - Rachel Pearson - We are Tilt __ Bright...
Beginners Guide to TikTok for Search - Rachel Pearson - We are Tilt __ Bright...Beginners Guide to TikTok for Search - Rachel Pearson - We are Tilt __ Bright...
Beginners Guide to TikTok for Search - Rachel Pearson - We are Tilt __ Bright...RachelPearson36
 

En vedette (20)

2024 State of Marketing Report – by Hubspot
2024 State of Marketing Report – by Hubspot2024 State of Marketing Report – by Hubspot
2024 State of Marketing Report – by Hubspot
 
Everything You Need To Know About ChatGPT
Everything You Need To Know About ChatGPTEverything You Need To Know About ChatGPT
Everything You Need To Know About ChatGPT
 
Product Design Trends in 2024 | Teenage Engineerings
Product Design Trends in 2024 | Teenage EngineeringsProduct Design Trends in 2024 | Teenage Engineerings
Product Design Trends in 2024 | Teenage Engineerings
 
How Race, Age and Gender Shape Attitudes Towards Mental Health
How Race, Age and Gender Shape Attitudes Towards Mental HealthHow Race, Age and Gender Shape Attitudes Towards Mental Health
How Race, Age and Gender Shape Attitudes Towards Mental Health
 
AI Trends in Creative Operations 2024 by Artwork Flow.pdf
AI Trends in Creative Operations 2024 by Artwork Flow.pdfAI Trends in Creative Operations 2024 by Artwork Flow.pdf
AI Trends in Creative Operations 2024 by Artwork Flow.pdf
 
Skeleton Culture Code
Skeleton Culture CodeSkeleton Culture Code
Skeleton Culture Code
 
PEPSICO Presentation to CAGNY Conference Feb 2024
PEPSICO Presentation to CAGNY Conference Feb 2024PEPSICO Presentation to CAGNY Conference Feb 2024
PEPSICO Presentation to CAGNY Conference Feb 2024
 
Content Methodology: A Best Practices Report (Webinar)
Content Methodology: A Best Practices Report (Webinar)Content Methodology: A Best Practices Report (Webinar)
Content Methodology: A Best Practices Report (Webinar)
 
How to Prepare For a Successful Job Search for 2024
How to Prepare For a Successful Job Search for 2024How to Prepare For a Successful Job Search for 2024
How to Prepare For a Successful Job Search for 2024
 
Social Media Marketing Trends 2024 // The Global Indie Insights
Social Media Marketing Trends 2024 // The Global Indie InsightsSocial Media Marketing Trends 2024 // The Global Indie Insights
Social Media Marketing Trends 2024 // The Global Indie Insights
 
Trends In Paid Search: Navigating The Digital Landscape In 2024
Trends In Paid Search: Navigating The Digital Landscape In 2024Trends In Paid Search: Navigating The Digital Landscape In 2024
Trends In Paid Search: Navigating The Digital Landscape In 2024
 
5 Public speaking tips from TED - Visualized summary
5 Public speaking tips from TED - Visualized summary5 Public speaking tips from TED - Visualized summary
5 Public speaking tips from TED - Visualized summary
 
ChatGPT and the Future of Work - Clark Boyd
ChatGPT and the Future of Work - Clark Boyd ChatGPT and the Future of Work - Clark Boyd
ChatGPT and the Future of Work - Clark Boyd
 
Getting into the tech field. what next
Getting into the tech field. what next Getting into the tech field. what next
Getting into the tech field. what next
 
Google's Just Not That Into You: Understanding Core Updates & Search Intent
Google's Just Not That Into You: Understanding Core Updates & Search IntentGoogle's Just Not That Into You: Understanding Core Updates & Search Intent
Google's Just Not That Into You: Understanding Core Updates & Search Intent
 
How to have difficult conversations
How to have difficult conversations How to have difficult conversations
How to have difficult conversations
 
Introduction to Data Science
Introduction to Data ScienceIntroduction to Data Science
Introduction to Data Science
 
Time Management & Productivity - Best Practices
Time Management & Productivity -  Best PracticesTime Management & Productivity -  Best Practices
Time Management & Productivity - Best Practices
 
The six step guide to practical project management
The six step guide to practical project managementThe six step guide to practical project management
The six step guide to practical project management
 
Beginners Guide to TikTok for Search - Rachel Pearson - We are Tilt __ Bright...
Beginners Guide to TikTok for Search - Rachel Pearson - We are Tilt __ Bright...Beginners Guide to TikTok for Search - Rachel Pearson - We are Tilt __ Bright...
Beginners Guide to TikTok for Search - Rachel Pearson - We are Tilt __ Bright...
 

Para demo g

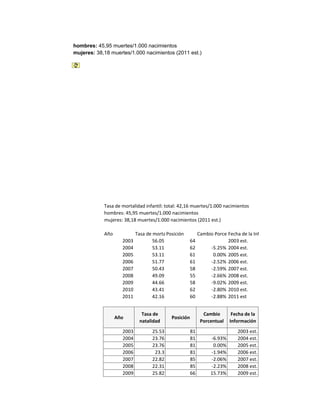
  • 1. hombres: 45,95 muertes/1.000 nacimientos mujeres: 38,18 muertes/1.000 nacimientos (2011 est.) Tasa de Cambio Fecha de la Año mortalidad Posición Porcentual Información infantil 2003 56.05 64 2003 est. 2004 53.11 62 -5.25% 2004 est. 2005 53.11 61 0.00% 2005 est. 2006 51.77 61 -2.52% 2006 est. 2007 50.43 58 -2.59% 2007 est. 2008 49.09 55 -2.66% 2008 est. 2009 44.66 58 -9.02% 2009 est. 2010 43.41 62 -2.80% 2010 est. 2011 42.16 60 -2.88% 2011 est Tasa de mortalidad infantil: total: 42,16 muertes/1.000 nacimientos hombres: 45,95 muertes/1.000 nacimientos mujeres: 38,18 muertes/1.000 nacimientos (2011 est.) Año Tasa de mortalidad infantil Cambio Porcentual de la Información Posición Fecha 2003 56.05 64 2003 est. 2004 53.11 62 -5.25% 2004 est. 2005 53.11 61 0.00% 2005 est. 2006 51.77 61 -2.52% 2006 est. 2007 50.43 58 -2.59% 2007 est. 2008 49.09 55 -2.66% 2008 est. 2009 44.66 58 -9.02% 2009 est. 2010 43.41 62 -2.80% 2010 est. 2011 42.16 60 -2.88% 2011 est Tasa de Cambio Fecha de la Año Posición natalidad Porcentual Información 2003 25.53 81 2003 est. 2004 23.76 81 -6.93% 2004 est. 2005 23.76 81 0.00% 2005 est. 2006 23.3 81 -1.94% 2006 est. 2007 22.82 85 -2.06% 2007 est. 2008 22.31 85 -2.23% 2008 est. 2009 25.82 66 15.73% 2009 est.
  • 2. 2010 25.16 63 -2.56% 2010 est. 2011 24.71 64 -1.79% 2011 est Tasa de Cambio Fecha de la Año Posición fertilidad Porcentual Información 2003 3.23 80 2003 est. 2004 2.94 87 -8.98% 2004 est. 2005 2.94 88 0.00% 2005 est. 2006 2.85 88 -3.06% 2006 est. 2007 2.76 88 -3.16% 2007 est. 2008 2.67 88 -3.26% 2008 est. 2009 3.17 66 18.73% 2009 est. 2010 3.07 64 -3.15% 2010 est. 2011 3 65 -2.28% 2011 est. Cambio Fecha de la Año Población Posición Porcentual Información 2003 8,586,443 86 July 2003 est. 2004 8,857,870 86 3.16% July 2005 est. 2005 8,857,870 86 0.00% July 2005 est. 2006 8,989,046 86 1.48% July 2006 est. 2007 9,119,152 86 1.45% July 2007 est. 2008 9,247,816 87 1.41% July 2008 est. 2009 9,775,246 84 5.70% July 2009 est. 2010 9,947,418 84 1.76% July 2010 est. 2011 10,118,683 83 1.72% July 2011 est. Expectativa Cambio Fecha de la Año de vida al Posición Porcentual Información nacer 2003 64.78 153 2003 est. 2004 65.5 154 1.11% 2004 est.
  • 3. 2005 65.5 155 0.00% 2005 est. 2006 65.84 155 0.52% 2006 est. 2007 66.19 153 0.53% 2007 est. 2008 66.53 155 0.51% 2008 est. 2009 66.89 155 0.54% 2009 est. 2010 67.23 155 0.51% 2010 est. 2011 67.57 156 0.51% 2011 est.
  • 4. Fecha de la Información
  • 5. Distribución por edad: 0-14 años: 34,6% (hombres 1.785.453/mujeres 1.719.173) 15-64 años: 60,7% (hombres 3.014.419/mujeres 3.129.942) 65 años y más: 4,6% (hombres 207.792/mujeres 261.904) (2011 est.) Distribución por sexo: al nacer: 1,05 hombre(s)/mujer menores de 15 años: 1,04 hombre(s)/mujer 15-64 años: 0,96 hombre(s)/mujer 65 años y más: 0,79 hombre(s)/mujer población total: 0,98 hombre(s)/mujer (2011 est.)
  • 6.
  • 7.