SlideShare une entreprise Scribd logo
1  sur  9
Correlation The correlation is one of the most common and most useful statistics. A correlation is a single number that describes the degree of relationship between two variables. Let's work through an example to show you how this statistic is computed. Correlation Example Let's assume that we want to look at the relationship between two variables, height (in inches) and self esteem. Perhaps we have a hypothesis that how tall you are effects your self esteem (incidentally, I don't think we have to worry about the direction of causality here -- it's not likely that self esteem causes your height!). Let's say we collect some information on twenty individuals (all male -- we know that the average height differs for males and females so, to keep this example simple we'll just use males). Height is measured in inches. Self esteem is measured based on the average of 10 1-to-5 rating items (where higher scores mean higher self esteem). Here's the data for the 20 cases (don't take this too seriously -- I made this data up to illustrate what a correlation is): PersonHeightSelf Esteem1684.12714.63623.84754.45583.26603.17673.88684.19714.310693.711683.512673.213633.714623.315603.416634.017654.118673.819633.420613.6 Now, let's take a quick look at the histogram for each variable: And, here are the descriptive statistics: VariableMeanStDevVarianceSumMinimumMaximumRangeHeight65.44.4057419.41051308587517Self Esteem3.7550.4260900.18155375.13.14.61.5 Finally, we'll look at the simple bivariate (i.e., two-variable) plot: You should immediately see in the bivariate plot that the relationship between the variables is a positive one (if you can't see that, review the section on types of relationships) because if you were to fit a single straight line through the dots it would have a positive slope or move up from left to right. Since the correlation is nothing more than a quantitative estimate of the relationship, we would expect a positive correlation. What does a 
positive relationship
 mean in this context? It means that, in general, higher scores on one variable tend to be paired with higher scores on the other and that lower scores on one variable tend to be paired with lower scores on the other. You should confirm visually that this is generally true in the plot above. Calculating the Correlation Now we're ready to compute the correlation value. The formula for the correlation is: We use the symbol r to stand for the correlation. Through the magic of mathematics it turns out that r will always be between -1.0 and +1.0. if the correlation is negative, we have a negative relationship; if it's positive, the relationship is positive. You don't need to know how we came up with this formula unless you want to be a statistician. But you probably will need to know how the formula relates to real data -- how you can use the formula to compute the correlation. Let's look at the data we need for the formula. Here's the original data with the other necessary columns: PersonHeight (x)Self Esteem (y)x*yx*xy*y1684.1278.8462416.812714.6326.6504121.163623.8235.6384414.444754.4330562519.365583.2185.6336410.246603.118636009.617673.8254.6448914.448684.1278.8462416.819714.3305.3504118.4910693.7255.3476113.6911683.5238462412.2512673.2214.4448910.2413633.7233.1396913.6914623.3204.6384410.8915603.4204360011.561663425239691617654.1266.5422516.8118673.8254.6448914.4419633.4214.2396911.5620613.6219.6372112.96Sum =130875.14937.685912285.45 The first three columns are the same as in the table above. The next three columns are simple computations based on the height and self esteem data. The bottom row consists of the sum of each column. This is all the information we need to compute the correlation. Here are the values from the bottom row of the table (where N is 20 people) as they are related to the symbols in the formula: Now, when we plug these values into the formula given above, we get the following (I show it here tediously, one step at a time): So, the correlation for our twenty cases is .73, which is a fairly strong positive relationship. I guess there is a relationship between height and self esteem, at least in this made up data! Testing the Significance of a Correlation Once you've computed a correlation, you can determine the probability that the observed correlation occurred by chance. That is, you can conduct a significance test. Most often you are interested in determining the probability that the correlation is a real one and not a chance occurrence. In this case, you are testing the mutually exclusive hypotheses: Null Hypothesis: r = 0Alternative Hypothesis: r <> 0 The easiest way to test this hypothesis is to find a statistics book that has a table of critical values of r. Most introductory statistics texts would have a table like this. As in all hypothesis testing, you need to first determine the significance level. Here, I'll use the common significance level of alpha = .05. This means that I am conducting a test where the odds that the correlation is a chance occurrence is no more than 5 out of 100. Before I look up the critical value in a table I also have to compute the degrees of freedom or df. The df is simply equal to N-2 or, in this example, is 20-2 = 18. Finally, I have to decide whether I am doing a one-tailed or two-tailed test. In this example, since I have no strong prior theory to suggest whether the relationship between height and self esteem would be positive or negative, I'll opt for the two-tailed test. With these three pieces of information -- the significance level (alpha = .05)), degrees of freedom (df = 18), and type of test (two-tailed) -- I can now test the significance of the correlation I found. When I look up this value in the handy little table at the back of my statistics book I find that the critical value is .4438. This means that if my correlation is greater than .4438 or less than -.4438 (remember, this is a two-tailed test) I can conclude that the odds are less than 5 out of 100 that this is a chance occurrence. Since my correlation 0f .73 is actually quite a bit higher, I conclude that it is not a chance finding and that the correlation is 
statistically significant
 (given the parameters of the test). I can reject the null hypothesis and accept the alternative. The Correlation Matrix All I've shown you so far is how to compute a correlation between two variables. In most studies we have considerably more than two variables. Let's say we have a study with 10 interval-level variables and we want to estimate the relationships among all of them (i.e., between all possible pairs of variables). In this instance, we have 45 unique correlations to estimate (more later on how I knew that!). We could do the above computations 45 times to obtain the correlations. Or we could use just about any statistics program to automatically compute all 45 with a simple click of the mouse. I used a simple statistics program to generate random data for 10 variables with 20 cases (i.e., persons) for each variable. Then, I told the program to compute the correlations among these variables. Here's the result:           C1       C2       C3       C4       C5       C6       C7       C8       C9      C10 C1     1.000 C2     0.274    1.000 C3    -0.134   -0.269    1.000 C4     0.201   -0.153    0.075    1.000 C5    -0.129   -0.166    0.278   -0.011    1.000 C6    -0.095    0.280   -0.348   -0.378   -0.009    1.000 C7     0.171   -0.122    0.288    0.086    0.193    0.002    1.000 C8     0.219    0.242   -0.380   -0.227   -0.551    0.324   -0.082    1.000 C9     0.518    0.238    0.002    0.082   -0.015    0.304    0.347   -0.013    1.000 C10    0.299    0.568    0.165   -0.122   -0.106   -0.169    0.243    0.014    0.352    1.000 This type of table is called a correlation matrix. It lists the variable names (C1-C10) down the first column and across the first row. The diagonal of a correlation matrix (i.e., the numbers that go from the upper left corner to the lower right) always consists of ones. That's because these are the correlations between each variable and itself (and a variable is always perfectly correlated with itself). This statistical program only shows the lower triangle of the correlation matrix. In every correlation matrix there are two triangles that are the values below and to the left of the diagonal (lower triangle) and above and to the right of the diagonal (upper triangle). There is no reason to print both triangles because the two triangles of a correlation matrix are always mirror images of each other (the correlation of variable x with variable y is always equal to the correlation of variable y with variable x). When a matrix has this mirror-image quality above and below the diagonal we refer to it as a symmetric matrix. A correlation matrix is always a symmetric matrix. To locate the correlation for any pair of variables, find the value in the table for the row and column intersection for those two variables. For instance, to find the correlation between variables C5 and C2, I look for where row C2 and column C5 is (in this case it's blank because it falls in the upper triangle area) and where row C5 and column C2 is and, in the second case, I find that the correlation is -.166. OK, so how did I know that there are 45 unique correlations when we have 10 variables? There's a handy simple little formula that tells how many pairs (e.g., correlations) there are for any number of variables: where N is the number of variables. In the example, I had 10 variables, so I know I have (10 * 9)/2 = 90/2 = 45 pairs. Other Correlations The specific type of correlation I've illustrated here is known as the Pearson Product Moment Correlation. It is appropriate when both variables are measured at an interval level. However there are a wide variety of other types of correlations for other circumstances. for instance, if you have two ordinal variables, you could use the Spearman rank Order Correlation (rho) or the Kendall rank order Correlation (tau). When one measure is a continuous interval level one and the other is dichotomous (i.e., two-category) you can use the Point-Biserial Correlation. For other situations, consulting the web-based statistics selection program, Selecting Statistics at http://trochim.human.cornell.edu/selstat/ssstart.htm.
Correlation Example
Correlation Example
Correlation Example
Correlation Example
Correlation Example
Correlation Example
Correlation Example
Correlation Example

Contenu connexe

Tendances

What is Simple Linear Regression and How Can an Enterprise Use this Technique...
What is Simple Linear Regression and How Can an Enterprise Use this Technique...What is Simple Linear Regression and How Can an Enterprise Use this Technique...
What is Simple Linear Regression and How Can an Enterprise Use this Technique...Smarten Augmented Analytics
 
Linear regression and correlation analysis ppt @ bec doms
Linear regression and correlation analysis ppt @ bec domsLinear regression and correlation analysis ppt @ bec doms
Linear regression and correlation analysis ppt @ bec domsBabasab Patil
 
Correlation and regression
Correlation and regressionCorrelation and regression
Correlation and regressionAntony Raj
 
Correlation and regression
Correlation and regressionCorrelation and regression
Correlation and regressionSHHUSSAIN
 
Simple linear regression
Simple linear regressionSimple linear regression
Simple linear regressionpankaj8108
 
Correlation and regression
Correlation and regressionCorrelation and regression
Correlation and regressionMohit Asija
 
Correlation Statistics
Correlation StatisticsCorrelation Statistics
Correlation Statisticstahmid rashid
 
Correlation and Regression
Correlation and RegressionCorrelation and Regression
Correlation and RegressionShubham Mehta
 
Statistics- chapter4.pdf
Statistics- chapter4.pdfStatistics- chapter4.pdf
Statistics- chapter4.pdfPaulosMekuria
 
Partial correlation
Partial correlationPartial correlation
Partial correlationDwaitiRoy
 
8 correlation regression
8 correlation regression 8 correlation regression
8 correlation regression Penny Jiang
 
Kendall's ,partial correlation and scatter plot
Kendall's ,partial correlation and scatter plotKendall's ,partial correlation and scatter plot
Kendall's ,partial correlation and scatter plotBharath kumar Karanam
 
Presentation on Regression Analysis
Presentation on Regression AnalysisPresentation on Regression Analysis
Presentation on Regression AnalysisJ P Verma
 

Tendances (20)

What is Simple Linear Regression and How Can an Enterprise Use this Technique...
What is Simple Linear Regression and How Can an Enterprise Use this Technique...What is Simple Linear Regression and How Can an Enterprise Use this Technique...
What is Simple Linear Regression and How Can an Enterprise Use this Technique...
 
Linear regression and correlation analysis ppt @ bec doms
Linear regression and correlation analysis ppt @ bec domsLinear regression and correlation analysis ppt @ bec doms
Linear regression and correlation analysis ppt @ bec doms
 
Correlation and regression
Correlation and regressionCorrelation and regression
Correlation and regression
 
Correlation and regression
Correlation and regressionCorrelation and regression
Correlation and regression
 
Simple linear regression
Simple linear regressionSimple linear regression
Simple linear regression
 
Correlation and regression
Correlation and regressionCorrelation and regression
Correlation and regression
 
Correlation Statistics
Correlation StatisticsCorrelation Statistics
Correlation Statistics
 
Correlation and Regression
Correlation and RegressionCorrelation and Regression
Correlation and Regression
 
Regression
RegressionRegression
Regression
 
Statistics- chapter4.pdf
Statistics- chapter4.pdfStatistics- chapter4.pdf
Statistics- chapter4.pdf
 
Simple correlation
Simple correlationSimple correlation
Simple correlation
 
Correlation in Statistics
Correlation in StatisticsCorrelation in Statistics
Correlation in Statistics
 
Partial correlation
Partial correlationPartial correlation
Partial correlation
 
Linear Correlation
Linear Correlation Linear Correlation
Linear Correlation
 
8 correlation regression
8 correlation regression 8 correlation regression
8 correlation regression
 
Kendall's ,partial correlation and scatter plot
Kendall's ,partial correlation and scatter plotKendall's ,partial correlation and scatter plot
Kendall's ,partial correlation and scatter plot
 
Correlation and Regression
Correlation and RegressionCorrelation and Regression
Correlation and Regression
 
Ch 7 correlation_and_linear_regression
Ch 7 correlation_and_linear_regressionCh 7 correlation_and_linear_regression
Ch 7 correlation_and_linear_regression
 
Correlation
CorrelationCorrelation
Correlation
 
Presentation on Regression Analysis
Presentation on Regression AnalysisPresentation on Regression Analysis
Presentation on Regression Analysis
 

En vedette

7.2 characteristics and evolution of stars
7.2 characteristics and evolution of stars7.2 characteristics and evolution of stars
7.2 characteristics and evolution of starsmojavehack
 
Inquiry based social studies isacs 2013
Inquiry based social studies isacs 2013Inquiry based social studies isacs 2013
Inquiry based social studies isacs 2013George Phillip
 
Types of evolution notes
Types of evolution notesTypes of evolution notes
Types of evolution notesmrimbiology
 
inquiry aproach in Social Studies
inquiry aproach in Social Studiesinquiry aproach in Social Studies
inquiry aproach in Social Studieseliasjoy
 
Questionnaire for the survey of electronics market(for school/college projects)
Questionnaire for the survey of electronics market(for school/college projects)Questionnaire for the survey of electronics market(for school/college projects)
Questionnaire for the survey of electronics market(for school/college projects)Dan John
 
Social science and natural science
Social science and natural scienceSocial science and natural science
Social science and natural scienceTayyibah
 

En vedette (10)

7.2 characteristics and evolution of stars
7.2 characteristics and evolution of stars7.2 characteristics and evolution of stars
7.2 characteristics and evolution of stars
 
Inquiry based social studies isacs 2013
Inquiry based social studies isacs 2013Inquiry based social studies isacs 2013
Inquiry based social studies isacs 2013
 
Evolution
EvolutionEvolution
Evolution
 
CGPA
CGPACGPA
CGPA
 
Types of evolution notes
Types of evolution notesTypes of evolution notes
Types of evolution notes
 
inquiry aproach in Social Studies
inquiry aproach in Social Studiesinquiry aproach in Social Studies
inquiry aproach in Social Studies
 
Correlation analysis
Correlation analysisCorrelation analysis
Correlation analysis
 
Questionnaire for the survey of electronics market(for school/college projects)
Questionnaire for the survey of electronics market(for school/college projects)Questionnaire for the survey of electronics market(for school/college projects)
Questionnaire for the survey of electronics market(for school/college projects)
 
Social science and natural science
Social science and natural scienceSocial science and natural science
Social science and natural science
 
Correlation ppt...
Correlation ppt...Correlation ppt...
Correlation ppt...
 

Similaire à Correlation Example

Frequency Tables - Statistics
Frequency Tables - StatisticsFrequency Tables - Statistics
Frequency Tables - Statisticsmscartersmaths
 
BUS 308 – Week 4 Lecture 2 Interpreting Relationships .docx
BUS 308 – Week 4 Lecture 2 Interpreting Relationships .docxBUS 308 – Week 4 Lecture 2 Interpreting Relationships .docx
BUS 308 – Week 4 Lecture 2 Interpreting Relationships .docxcurwenmichaela
 
BUS 308 – Week 4 Lecture 2 Interpreting Relationships .docx
BUS 308 – Week 4 Lecture 2 Interpreting Relationships .docxBUS 308 – Week 4 Lecture 2 Interpreting Relationships .docx
BUS 308 – Week 4 Lecture 2 Interpreting Relationships .docxjasoninnes20
 
MLR Project (Onion)
MLR Project (Onion)MLR Project (Onion)
MLR Project (Onion)Chawal Ukesh
 
For this assignment, use the aschooltest.sav dataset.The d
For this assignment, use the aschooltest.sav dataset.The dFor this assignment, use the aschooltest.sav dataset.The d
For this assignment, use the aschooltest.sav dataset.The dMerrileeDelvalle969
 
8 Statistical SignificanceOK, measures of association are one .docx
8 Statistical SignificanceOK, measures of association are one .docx8 Statistical SignificanceOK, measures of association are one .docx
8 Statistical SignificanceOK, measures of association are one .docxevonnehoggarth79783
 
Week 4 Lecture 10 We have been examining the question of equal p.docx
Week 4 Lecture 10 We have been examining the question of equal p.docxWeek 4 Lecture 10 We have been examining the question of equal p.docx
Week 4 Lecture 10 We have been examining the question of equal p.docxcockekeshia
 
Spearman after priory man
Spearman after priory manSpearman after priory man
Spearman after priory manWill Williams
 
Two-Variable (Bivariate) RegressionIn the last unit, we covered
Two-Variable (Bivariate) RegressionIn the last unit, we covered Two-Variable (Bivariate) RegressionIn the last unit, we covered
Two-Variable (Bivariate) RegressionIn the last unit, we covered LacieKlineeb
 
Artificial Intelligence (Unit - 8).pdf
Artificial Intelligence   (Unit  -  8).pdfArtificial Intelligence   (Unit  -  8).pdf
Artificial Intelligence (Unit - 8).pdfSathyaNarayanan47813
 
Introduction to correlation and regression analysis
Introduction to correlation and regression analysisIntroduction to correlation and regression analysis
Introduction to correlation and regression analysisFarzad Javidanrad
 
Machine learning session4(linear regression)
Machine learning   session4(linear regression)Machine learning   session4(linear regression)
Machine learning session4(linear regression)Abhimanyu Dwivedi
 
correlation and r3433333333333333333333333333333333333333333333333egratio111n...
correlation and r3433333333333333333333333333333333333333333333333egratio111n...correlation and r3433333333333333333333333333333333333333333333333egratio111n...
correlation and r3433333333333333333333333333333333333333333333333egratio111n...Ghaneshwer Jharbade
 

Similaire à Correlation Example (20)

Frequency Tables - Statistics
Frequency Tables - StatisticsFrequency Tables - Statistics
Frequency Tables - Statistics
 
2-20-04.ppt
2-20-04.ppt2-20-04.ppt
2-20-04.ppt
 
BUS 308 – Week 4 Lecture 2 Interpreting Relationships .docx
BUS 308 – Week 4 Lecture 2 Interpreting Relationships .docxBUS 308 – Week 4 Lecture 2 Interpreting Relationships .docx
BUS 308 – Week 4 Lecture 2 Interpreting Relationships .docx
 
BUS 308 – Week 4 Lecture 2 Interpreting Relationships .docx
BUS 308 – Week 4 Lecture 2 Interpreting Relationships .docxBUS 308 – Week 4 Lecture 2 Interpreting Relationships .docx
BUS 308 – Week 4 Lecture 2 Interpreting Relationships .docx
 
MLR Project (Onion)
MLR Project (Onion)MLR Project (Onion)
MLR Project (Onion)
 
For this assignment, use the aschooltest.sav dataset.The d
For this assignment, use the aschooltest.sav dataset.The dFor this assignment, use the aschooltest.sav dataset.The d
For this assignment, use the aschooltest.sav dataset.The d
 
8 Statistical SignificanceOK, measures of association are one .docx
8 Statistical SignificanceOK, measures of association are one .docx8 Statistical SignificanceOK, measures of association are one .docx
8 Statistical SignificanceOK, measures of association are one .docx
 
assignment 2
assignment 2assignment 2
assignment 2
 
4. correlations
4. correlations4. correlations
4. correlations
 
Week 4 Lecture 10 We have been examining the question of equal p.docx
Week 4 Lecture 10 We have been examining the question of equal p.docxWeek 4 Lecture 10 We have been examining the question of equal p.docx
Week 4 Lecture 10 We have been examining the question of equal p.docx
 
Spearman after priory man
Spearman after priory manSpearman after priory man
Spearman after priory man
 
Two-Variable (Bivariate) RegressionIn the last unit, we covered
Two-Variable (Bivariate) RegressionIn the last unit, we covered Two-Variable (Bivariate) RegressionIn the last unit, we covered
Two-Variable (Bivariate) RegressionIn the last unit, we covered
 
Correlation
CorrelationCorrelation
Correlation
 
Artificial Intelligence (Unit - 8).pdf
Artificial Intelligence   (Unit  -  8).pdfArtificial Intelligence   (Unit  -  8).pdf
Artificial Intelligence (Unit - 8).pdf
 
Introduction to correlation and regression analysis
Introduction to correlation and regression analysisIntroduction to correlation and regression analysis
Introduction to correlation and regression analysis
 
Machine learning session4(linear regression)
Machine learning   session4(linear regression)Machine learning   session4(linear regression)
Machine learning session4(linear regression)
 
Measure of Association
Measure of AssociationMeasure of Association
Measure of Association
 
data analysis
data analysisdata analysis
data analysis
 
Scatter Plot
Scatter PlotScatter Plot
Scatter Plot
 
correlation and r3433333333333333333333333333333333333333333333333egratio111n...
correlation and r3433333333333333333333333333333333333333333333333egratio111n...correlation and r3433333333333333333333333333333333333333333333333egratio111n...
correlation and r3433333333333333333333333333333333333333333333333egratio111n...
 

Plus de OUM SAOKOSAL

Class Diagram | OOP and Design Patterns by Oum Saokosal
Class Diagram | OOP and Design Patterns by Oum SaokosalClass Diagram | OOP and Design Patterns by Oum Saokosal
Class Diagram | OOP and Design Patterns by Oum SaokosalOUM SAOKOSAL
 
Android app development - Java Programming for Android
Android app development - Java Programming for AndroidAndroid app development - Java Programming for Android
Android app development - Java Programming for AndroidOUM SAOKOSAL
 
Java OOP Programming language (Part 8) - Java Database JDBC
Java OOP Programming language (Part 8) - Java Database JDBCJava OOP Programming language (Part 8) - Java Database JDBC
Java OOP Programming language (Part 8) - Java Database JDBCOUM SAOKOSAL
 
Java OOP Programming language (Part 7) - Swing
Java OOP Programming language (Part 7) - SwingJava OOP Programming language (Part 7) - Swing
Java OOP Programming language (Part 7) - SwingOUM SAOKOSAL
 
Java OOP Programming language (Part 6) - Abstract Class & Interface
Java OOP Programming language (Part 6) - Abstract Class & InterfaceJava OOP Programming language (Part 6) - Abstract Class & Interface
Java OOP Programming language (Part 6) - Abstract Class & InterfaceOUM SAOKOSAL
 
Java OOP Programming language (Part 5) - Inheritance
Java OOP Programming language (Part 5) - InheritanceJava OOP Programming language (Part 5) - Inheritance
Java OOP Programming language (Part 5) - InheritanceOUM SAOKOSAL
 
Java OOP Programming language (Part 4) - Collection
Java OOP Programming language (Part 4) - CollectionJava OOP Programming language (Part 4) - Collection
Java OOP Programming language (Part 4) - CollectionOUM SAOKOSAL
 
Java OOP Programming language (Part 3) - Class and Object
Java OOP Programming language (Part 3) - Class and ObjectJava OOP Programming language (Part 3) - Class and Object
Java OOP Programming language (Part 3) - Class and ObjectOUM SAOKOSAL
 
Java OOP Programming language (Part 1) - Introduction to Java
Java OOP Programming language (Part 1) - Introduction to JavaJava OOP Programming language (Part 1) - Introduction to Java
Java OOP Programming language (Part 1) - Introduction to JavaOUM SAOKOSAL
 
Javascript & DOM - Part 1- Javascript Tutorial for Beginners with Examples
Javascript & DOM - Part 1- Javascript Tutorial for Beginners with ExamplesJavascript & DOM - Part 1- Javascript Tutorial for Beginners with Examples
Javascript & DOM - Part 1- Javascript Tutorial for Beginners with ExamplesOUM SAOKOSAL
 
Aggregate rank bringing order to web sites
Aggregate rank  bringing order to web sitesAggregate rank  bringing order to web sites
Aggregate rank bringing order to web sitesOUM SAOKOSAL
 
How to succeed in graduate school
How to succeed in graduate schoolHow to succeed in graduate school
How to succeed in graduate schoolOUM SAOKOSAL
 
Data preparation for mining world wide web browsing patterns (1999)
Data preparation for mining world wide web browsing patterns (1999)Data preparation for mining world wide web browsing patterns (1999)
Data preparation for mining world wide web browsing patterns (1999)OUM SAOKOSAL
 
Consumer acceptance of online banking an extension of the technology accepta...
Consumer acceptance of online banking  an extension of the technology accepta...Consumer acceptance of online banking  an extension of the technology accepta...
Consumer acceptance of online banking an extension of the technology accepta...OUM SAOKOSAL
 
When Do People Help
When Do People HelpWhen Do People Help
When Do People HelpOUM SAOKOSAL
 

Plus de OUM SAOKOSAL (20)

Class Diagram | OOP and Design Patterns by Oum Saokosal
Class Diagram | OOP and Design Patterns by Oum SaokosalClass Diagram | OOP and Design Patterns by Oum Saokosal
Class Diagram | OOP and Design Patterns by Oum Saokosal
 
Android app development - Java Programming for Android
Android app development - Java Programming for AndroidAndroid app development - Java Programming for Android
Android app development - Java Programming for Android
 
Java OOP Programming language (Part 8) - Java Database JDBC
Java OOP Programming language (Part 8) - Java Database JDBCJava OOP Programming language (Part 8) - Java Database JDBC
Java OOP Programming language (Part 8) - Java Database JDBC
 
Java OOP Programming language (Part 7) - Swing
Java OOP Programming language (Part 7) - SwingJava OOP Programming language (Part 7) - Swing
Java OOP Programming language (Part 7) - Swing
 
Java OOP Programming language (Part 6) - Abstract Class & Interface
Java OOP Programming language (Part 6) - Abstract Class & InterfaceJava OOP Programming language (Part 6) - Abstract Class & Interface
Java OOP Programming language (Part 6) - Abstract Class & Interface
 
Java OOP Programming language (Part 5) - Inheritance
Java OOP Programming language (Part 5) - InheritanceJava OOP Programming language (Part 5) - Inheritance
Java OOP Programming language (Part 5) - Inheritance
 
Java OOP Programming language (Part 4) - Collection
Java OOP Programming language (Part 4) - CollectionJava OOP Programming language (Part 4) - Collection
Java OOP Programming language (Part 4) - Collection
 
Java OOP Programming language (Part 3) - Class and Object
Java OOP Programming language (Part 3) - Class and ObjectJava OOP Programming language (Part 3) - Class and Object
Java OOP Programming language (Part 3) - Class and Object
 
Java OOP Programming language (Part 1) - Introduction to Java
Java OOP Programming language (Part 1) - Introduction to JavaJava OOP Programming language (Part 1) - Introduction to Java
Java OOP Programming language (Part 1) - Introduction to Java
 
Javascript & DOM - Part 1- Javascript Tutorial for Beginners with Examples
Javascript & DOM - Part 1- Javascript Tutorial for Beginners with ExamplesJavascript & DOM - Part 1- Javascript Tutorial for Beginners with Examples
Javascript & DOM - Part 1- Javascript Tutorial for Beginners with Examples
 
Aggregate rank bringing order to web sites
Aggregate rank  bringing order to web sitesAggregate rank  bringing order to web sites
Aggregate rank bringing order to web sites
 
How to succeed in graduate school
How to succeed in graduate schoolHow to succeed in graduate school
How to succeed in graduate school
 
Google
GoogleGoogle
Google
 
E miner
E minerE miner
E miner
 
Data preparation for mining world wide web browsing patterns (1999)
Data preparation for mining world wide web browsing patterns (1999)Data preparation for mining world wide web browsing patterns (1999)
Data preparation for mining world wide web browsing patterns (1999)
 
Consumer acceptance of online banking an extension of the technology accepta...
Consumer acceptance of online banking  an extension of the technology accepta...Consumer acceptance of online banking  an extension of the technology accepta...
Consumer acceptance of online banking an extension of the technology accepta...
 
When Do People Help
When Do People HelpWhen Do People Help
When Do People Help
 
Mc Nemar
Mc NemarMc Nemar
Mc Nemar
 
Sem Ski Amos
Sem Ski AmosSem Ski Amos
Sem Ski Amos
 
Sem+Essentials
Sem+EssentialsSem+Essentials
Sem+Essentials
 

Dernier

Independent Call Girls Service Mohali Sector 116 | 6367187148 | Call Girl Ser...
Independent Call Girls Service Mohali Sector 116 | 6367187148 | Call Girl Ser...Independent Call Girls Service Mohali Sector 116 | 6367187148 | Call Girl Ser...
Independent Call Girls Service Mohali Sector 116 | 6367187148 | Call Girl Ser...karishmasinghjnh
 
8980367676 Call Girls In Ahmedabad Escort Service Available 24×7 In Ahmedabad
8980367676 Call Girls In Ahmedabad Escort Service Available 24×7 In Ahmedabad8980367676 Call Girls In Ahmedabad Escort Service Available 24×7 In Ahmedabad
8980367676 Call Girls In Ahmedabad Escort Service Available 24×7 In AhmedabadGENUINE ESCORT AGENCY
 
Best Rate (Patna ) Call Girls Patna ⟟ 8617370543 ⟟ High Class Call Girl In 5 ...
Best Rate (Patna ) Call Girls Patna ⟟ 8617370543 ⟟ High Class Call Girl In 5 ...Best Rate (Patna ) Call Girls Patna ⟟ 8617370543 ⟟ High Class Call Girl In 5 ...
Best Rate (Patna ) Call Girls Patna ⟟ 8617370543 ⟟ High Class Call Girl In 5 ...Dipal Arora
 
Coimbatore Call Girls in Thudiyalur : 7427069034 High Profile Model Escorts |...
Coimbatore Call Girls in Thudiyalur : 7427069034 High Profile Model Escorts |...Coimbatore Call Girls in Thudiyalur : 7427069034 High Profile Model Escorts |...
Coimbatore Call Girls in Thudiyalur : 7427069034 High Profile Model Escorts |...chennailover
 
Mumbai ] (Call Girls) in Mumbai 10k @ I'm VIP Independent Escorts Girls 98333...
Mumbai ] (Call Girls) in Mumbai 10k @ I'm VIP Independent Escorts Girls 98333...Mumbai ] (Call Girls) in Mumbai 10k @ I'm VIP Independent Escorts Girls 98333...
Mumbai ] (Call Girls) in Mumbai 10k @ I'm VIP Independent Escorts Girls 98333...Ishani Gupta
 
Night 7k to 12k Chennai City Center Call Girls 👉👉 7427069034⭐⭐ 100% Genuine E...
Night 7k to 12k Chennai City Center Call Girls 👉👉 7427069034⭐⭐ 100% Genuine E...Night 7k to 12k Chennai City Center Call Girls 👉👉 7427069034⭐⭐ 100% Genuine E...
Night 7k to 12k Chennai City Center Call Girls 👉👉 7427069034⭐⭐ 100% Genuine E...hotbabesbook
 
Manyata Tech Park ( Call Girls ) Bangalore ✔ 6297143586 ✔ Hot Model With Sexy...
Manyata Tech Park ( Call Girls ) Bangalore ✔ 6297143586 ✔ Hot Model With Sexy...Manyata Tech Park ( Call Girls ) Bangalore ✔ 6297143586 ✔ Hot Model With Sexy...
Manyata Tech Park ( Call Girls ) Bangalore ✔ 6297143586 ✔ Hot Model With Sexy...vidya singh
 
Call Girl in Indore 8827247818 {LowPrice} ❤️ (ahana) Indore Call Girls * UPA...
Call Girl in Indore 8827247818 {LowPrice} ❤️ (ahana) Indore Call Girls  * UPA...Call Girl in Indore 8827247818 {LowPrice} ❤️ (ahana) Indore Call Girls  * UPA...
Call Girl in Indore 8827247818 {LowPrice} ❤️ (ahana) Indore Call Girls * UPA...mahaiklolahd
 
Saket * Call Girls in Delhi - Phone 9711199012 Escorts Service at 6k to 50k a...
Saket * Call Girls in Delhi - Phone 9711199012 Escorts Service at 6k to 50k a...Saket * Call Girls in Delhi - Phone 9711199012 Escorts Service at 6k to 50k a...
Saket * Call Girls in Delhi - Phone 9711199012 Escorts Service at 6k to 50k a...BhumiSaxena1
 
VIP Hyderabad Call Girls Bahadurpally 7877925207 ₹5000 To 25K With AC Room 💚😋
VIP Hyderabad Call Girls Bahadurpally 7877925207 ₹5000 To 25K With AC Room 💚😋VIP Hyderabad Call Girls Bahadurpally 7877925207 ₹5000 To 25K With AC Room 💚😋
VIP Hyderabad Call Girls Bahadurpally 7877925207 ₹5000 To 25K With AC Room 💚😋TANUJA PANDEY
 
Call Girls in Delhi Triveni Complex Escort Service(🔝))/WhatsApp 97111⇛47426
Call Girls in Delhi Triveni Complex Escort Service(🔝))/WhatsApp 97111⇛47426Call Girls in Delhi Triveni Complex Escort Service(🔝))/WhatsApp 97111⇛47426
Call Girls in Delhi Triveni Complex Escort Service(🔝))/WhatsApp 97111⇛47426jennyeacort
 
Top Rated Hyderabad Call Girls Erragadda ⟟ 9332606886 ⟟ Call Me For Genuine ...
Top Rated  Hyderabad Call Girls Erragadda ⟟ 9332606886 ⟟ Call Me For Genuine ...Top Rated  Hyderabad Call Girls Erragadda ⟟ 9332606886 ⟟ Call Me For Genuine ...
Top Rated Hyderabad Call Girls Erragadda ⟟ 9332606886 ⟟ Call Me For Genuine ...chandars293
 
Call Girls Hosur Just Call 9630942363 Top Class Call Girl Service Available
Call Girls Hosur Just Call 9630942363 Top Class Call Girl Service AvailableCall Girls Hosur Just Call 9630942363 Top Class Call Girl Service Available
Call Girls Hosur Just Call 9630942363 Top Class Call Girl Service AvailableGENUINE ESCORT AGENCY
 
Call Girls Service Jaipur {9521753030} ❤️VVIP RIDDHI Call Girl in Jaipur Raja...
Call Girls Service Jaipur {9521753030} ❤️VVIP RIDDHI Call Girl in Jaipur Raja...Call Girls Service Jaipur {9521753030} ❤️VVIP RIDDHI Call Girl in Jaipur Raja...
Call Girls Service Jaipur {9521753030} ❤️VVIP RIDDHI Call Girl in Jaipur Raja...Sheetaleventcompany
 
Best Rate (Guwahati ) Call Girls Guwahati ⟟ 8617370543 ⟟ High Class Call Girl...
Best Rate (Guwahati ) Call Girls Guwahati ⟟ 8617370543 ⟟ High Class Call Girl...Best Rate (Guwahati ) Call Girls Guwahati ⟟ 8617370543 ⟟ High Class Call Girl...
Best Rate (Guwahati ) Call Girls Guwahati ⟟ 8617370543 ⟟ High Class Call Girl...Dipal Arora
 
Call Girl In Pune 👉 Just CALL ME: 9352988975 💋 Call Out Call Both With High p...
Call Girl In Pune 👉 Just CALL ME: 9352988975 💋 Call Out Call Both With High p...Call Girl In Pune 👉 Just CALL ME: 9352988975 💋 Call Out Call Both With High p...
Call Girl In Pune 👉 Just CALL ME: 9352988975 💋 Call Out Call Both With High p...chetankumar9855
 
Andheri East ) Call Girls in Mumbai Phone No 9004268417 Elite Escort Service ...
Andheri East ) Call Girls in Mumbai Phone No 9004268417 Elite Escort Service ...Andheri East ) Call Girls in Mumbai Phone No 9004268417 Elite Escort Service ...
Andheri East ) Call Girls in Mumbai Phone No 9004268417 Elite Escort Service ...Anamika Rawat
 
Independent Call Girls In Jaipur { 8445551418 } ✔ ANIKA MEHTA ✔ Get High Prof...
Independent Call Girls In Jaipur { 8445551418 } ✔ ANIKA MEHTA ✔ Get High Prof...Independent Call Girls In Jaipur { 8445551418 } ✔ ANIKA MEHTA ✔ Get High Prof...
Independent Call Girls In Jaipur { 8445551418 } ✔ ANIKA MEHTA ✔ Get High Prof...parulsinha
 

Dernier (20)

🌹Attapur⬅️ Vip Call Girls Hyderabad 📱9352852248 Book Well Trand Call Girls In...
🌹Attapur⬅️ Vip Call Girls Hyderabad 📱9352852248 Book Well Trand Call Girls In...🌹Attapur⬅️ Vip Call Girls Hyderabad 📱9352852248 Book Well Trand Call Girls In...
🌹Attapur⬅️ Vip Call Girls Hyderabad 📱9352852248 Book Well Trand Call Girls In...
 
Independent Call Girls Service Mohali Sector 116 | 6367187148 | Call Girl Ser...
Independent Call Girls Service Mohali Sector 116 | 6367187148 | Call Girl Ser...Independent Call Girls Service Mohali Sector 116 | 6367187148 | Call Girl Ser...
Independent Call Girls Service Mohali Sector 116 | 6367187148 | Call Girl Ser...
 
8980367676 Call Girls In Ahmedabad Escort Service Available 24×7 In Ahmedabad
8980367676 Call Girls In Ahmedabad Escort Service Available 24×7 In Ahmedabad8980367676 Call Girls In Ahmedabad Escort Service Available 24×7 In Ahmedabad
8980367676 Call Girls In Ahmedabad Escort Service Available 24×7 In Ahmedabad
 
Best Rate (Patna ) Call Girls Patna ⟟ 8617370543 ⟟ High Class Call Girl In 5 ...
Best Rate (Patna ) Call Girls Patna ⟟ 8617370543 ⟟ High Class Call Girl In 5 ...Best Rate (Patna ) Call Girls Patna ⟟ 8617370543 ⟟ High Class Call Girl In 5 ...
Best Rate (Patna ) Call Girls Patna ⟟ 8617370543 ⟟ High Class Call Girl In 5 ...
 
Coimbatore Call Girls in Thudiyalur : 7427069034 High Profile Model Escorts |...
Coimbatore Call Girls in Thudiyalur : 7427069034 High Profile Model Escorts |...Coimbatore Call Girls in Thudiyalur : 7427069034 High Profile Model Escorts |...
Coimbatore Call Girls in Thudiyalur : 7427069034 High Profile Model Escorts |...
 
Mumbai ] (Call Girls) in Mumbai 10k @ I'm VIP Independent Escorts Girls 98333...
Mumbai ] (Call Girls) in Mumbai 10k @ I'm VIP Independent Escorts Girls 98333...Mumbai ] (Call Girls) in Mumbai 10k @ I'm VIP Independent Escorts Girls 98333...
Mumbai ] (Call Girls) in Mumbai 10k @ I'm VIP Independent Escorts Girls 98333...
 
Night 7k to 12k Chennai City Center Call Girls 👉👉 7427069034⭐⭐ 100% Genuine E...
Night 7k to 12k Chennai City Center Call Girls 👉👉 7427069034⭐⭐ 100% Genuine E...Night 7k to 12k Chennai City Center Call Girls 👉👉 7427069034⭐⭐ 100% Genuine E...
Night 7k to 12k Chennai City Center Call Girls 👉👉 7427069034⭐⭐ 100% Genuine E...
 
Manyata Tech Park ( Call Girls ) Bangalore ✔ 6297143586 ✔ Hot Model With Sexy...
Manyata Tech Park ( Call Girls ) Bangalore ✔ 6297143586 ✔ Hot Model With Sexy...Manyata Tech Park ( Call Girls ) Bangalore ✔ 6297143586 ✔ Hot Model With Sexy...
Manyata Tech Park ( Call Girls ) Bangalore ✔ 6297143586 ✔ Hot Model With Sexy...
 
Call Girls in Gagan Vihar (delhi) call me [🔝 9953056974 🔝] escort service 24X7
Call Girls in Gagan Vihar (delhi) call me [🔝  9953056974 🔝] escort service 24X7Call Girls in Gagan Vihar (delhi) call me [🔝  9953056974 🔝] escort service 24X7
Call Girls in Gagan Vihar (delhi) call me [🔝 9953056974 🔝] escort service 24X7
 
Call Girl in Indore 8827247818 {LowPrice} ❤️ (ahana) Indore Call Girls * UPA...
Call Girl in Indore 8827247818 {LowPrice} ❤️ (ahana) Indore Call Girls  * UPA...Call Girl in Indore 8827247818 {LowPrice} ❤️ (ahana) Indore Call Girls  * UPA...
Call Girl in Indore 8827247818 {LowPrice} ❤️ (ahana) Indore Call Girls * UPA...
 
Saket * Call Girls in Delhi - Phone 9711199012 Escorts Service at 6k to 50k a...
Saket * Call Girls in Delhi - Phone 9711199012 Escorts Service at 6k to 50k a...Saket * Call Girls in Delhi - Phone 9711199012 Escorts Service at 6k to 50k a...
Saket * Call Girls in Delhi - Phone 9711199012 Escorts Service at 6k to 50k a...
 
VIP Hyderabad Call Girls Bahadurpally 7877925207 ₹5000 To 25K With AC Room 💚😋
VIP Hyderabad Call Girls Bahadurpally 7877925207 ₹5000 To 25K With AC Room 💚😋VIP Hyderabad Call Girls Bahadurpally 7877925207 ₹5000 To 25K With AC Room 💚😋
VIP Hyderabad Call Girls Bahadurpally 7877925207 ₹5000 To 25K With AC Room 💚😋
 
Call Girls in Delhi Triveni Complex Escort Service(🔝))/WhatsApp 97111⇛47426
Call Girls in Delhi Triveni Complex Escort Service(🔝))/WhatsApp 97111⇛47426Call Girls in Delhi Triveni Complex Escort Service(🔝))/WhatsApp 97111⇛47426
Call Girls in Delhi Triveni Complex Escort Service(🔝))/WhatsApp 97111⇛47426
 
Top Rated Hyderabad Call Girls Erragadda ⟟ 9332606886 ⟟ Call Me For Genuine ...
Top Rated  Hyderabad Call Girls Erragadda ⟟ 9332606886 ⟟ Call Me For Genuine ...Top Rated  Hyderabad Call Girls Erragadda ⟟ 9332606886 ⟟ Call Me For Genuine ...
Top Rated Hyderabad Call Girls Erragadda ⟟ 9332606886 ⟟ Call Me For Genuine ...
 
Call Girls Hosur Just Call 9630942363 Top Class Call Girl Service Available
Call Girls Hosur Just Call 9630942363 Top Class Call Girl Service AvailableCall Girls Hosur Just Call 9630942363 Top Class Call Girl Service Available
Call Girls Hosur Just Call 9630942363 Top Class Call Girl Service Available
 
Call Girls Service Jaipur {9521753030} ❤️VVIP RIDDHI Call Girl in Jaipur Raja...
Call Girls Service Jaipur {9521753030} ❤️VVIP RIDDHI Call Girl in Jaipur Raja...Call Girls Service Jaipur {9521753030} ❤️VVIP RIDDHI Call Girl in Jaipur Raja...
Call Girls Service Jaipur {9521753030} ❤️VVIP RIDDHI Call Girl in Jaipur Raja...
 
Best Rate (Guwahati ) Call Girls Guwahati ⟟ 8617370543 ⟟ High Class Call Girl...
Best Rate (Guwahati ) Call Girls Guwahati ⟟ 8617370543 ⟟ High Class Call Girl...Best Rate (Guwahati ) Call Girls Guwahati ⟟ 8617370543 ⟟ High Class Call Girl...
Best Rate (Guwahati ) Call Girls Guwahati ⟟ 8617370543 ⟟ High Class Call Girl...
 
Call Girl In Pune 👉 Just CALL ME: 9352988975 💋 Call Out Call Both With High p...
Call Girl In Pune 👉 Just CALL ME: 9352988975 💋 Call Out Call Both With High p...Call Girl In Pune 👉 Just CALL ME: 9352988975 💋 Call Out Call Both With High p...
Call Girl In Pune 👉 Just CALL ME: 9352988975 💋 Call Out Call Both With High p...
 
Andheri East ) Call Girls in Mumbai Phone No 9004268417 Elite Escort Service ...
Andheri East ) Call Girls in Mumbai Phone No 9004268417 Elite Escort Service ...Andheri East ) Call Girls in Mumbai Phone No 9004268417 Elite Escort Service ...
Andheri East ) Call Girls in Mumbai Phone No 9004268417 Elite Escort Service ...
 
Independent Call Girls In Jaipur { 8445551418 } ✔ ANIKA MEHTA ✔ Get High Prof...
Independent Call Girls In Jaipur { 8445551418 } ✔ ANIKA MEHTA ✔ Get High Prof...Independent Call Girls In Jaipur { 8445551418 } ✔ ANIKA MEHTA ✔ Get High Prof...
Independent Call Girls In Jaipur { 8445551418 } ✔ ANIKA MEHTA ✔ Get High Prof...
 

Correlation Example

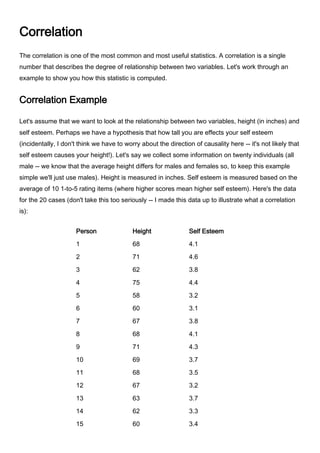
  • 1. Correlation The correlation is one of the most common and most useful statistics. A correlation is a single number that describes the degree of relationship between two variables. Let's work through an example to show you how this statistic is computed. Correlation Example Let's assume that we want to look at the relationship between two variables, height (in inches) and self esteem. Perhaps we have a hypothesis that how tall you are effects your self esteem (incidentally, I don't think we have to worry about the direction of causality here -- it's not likely that self esteem causes your height!). Let's say we collect some information on twenty individuals (all male -- we know that the average height differs for males and females so, to keep this example simple we'll just use males). Height is measured in inches. Self esteem is measured based on the average of 10 1-to-5 rating items (where higher scores mean higher self esteem). Here's the data for the 20 cases (don't take this too seriously -- I made this data up to illustrate what a correlation is): PersonHeightSelf Esteem1684.12714.63623.84754.45583.26603.17673.88684.19714.310693.711683.512673.213633.714623.315603.416634.017654.118673.819633.420613.6 Now, let's take a quick look at the histogram for each variable: And, here are the descriptive statistics: VariableMeanStDevVarianceSumMinimumMaximumRangeHeight65.44.4057419.41051308587517Self Esteem3.7550.4260900.18155375.13.14.61.5 Finally, we'll look at the simple bivariate (i.e., two-variable) plot: You should immediately see in the bivariate plot that the relationship between the variables is a positive one (if you can't see that, review the section on types of relationships) because if you were to fit a single straight line through the dots it would have a positive slope or move up from left to right. Since the correlation is nothing more than a quantitative estimate of the relationship, we would expect a positive correlation. What does a positive relationship mean in this context? It means that, in general, higher scores on one variable tend to be paired with higher scores on the other and that lower scores on one variable tend to be paired with lower scores on the other. You should confirm visually that this is generally true in the plot above. Calculating the Correlation Now we're ready to compute the correlation value. The formula for the correlation is: We use the symbol r to stand for the correlation. Through the magic of mathematics it turns out that r will always be between -1.0 and +1.0. if the correlation is negative, we have a negative relationship; if it's positive, the relationship is positive. You don't need to know how we came up with this formula unless you want to be a statistician. But you probably will need to know how the formula relates to real data -- how you can use the formula to compute the correlation. Let's look at the data we need for the formula. Here's the original data with the other necessary columns: PersonHeight (x)Self Esteem (y)x*yx*xy*y1684.1278.8462416.812714.6326.6504121.163623.8235.6384414.444754.4330562519.365583.2185.6336410.246603.118636009.617673.8254.6448914.448684.1278.8462416.819714.3305.3504118.4910693.7255.3476113.6911683.5238462412.2512673.2214.4448910.2413633.7233.1396913.6914623.3204.6384410.8915603.4204360011.561663425239691617654.1266.5422516.8118673.8254.6448914.4419633.4214.2396911.5620613.6219.6372112.96Sum =130875.14937.685912285.45 The first three columns are the same as in the table above. The next three columns are simple computations based on the height and self esteem data. The bottom row consists of the sum of each column. This is all the information we need to compute the correlation. Here are the values from the bottom row of the table (where N is 20 people) as they are related to the symbols in the formula: Now, when we plug these values into the formula given above, we get the following (I show it here tediously, one step at a time): So, the correlation for our twenty cases is .73, which is a fairly strong positive relationship. I guess there is a relationship between height and self esteem, at least in this made up data! Testing the Significance of a Correlation Once you've computed a correlation, you can determine the probability that the observed correlation occurred by chance. That is, you can conduct a significance test. Most often you are interested in determining the probability that the correlation is a real one and not a chance occurrence. In this case, you are testing the mutually exclusive hypotheses: Null Hypothesis: r = 0Alternative Hypothesis: r <> 0 The easiest way to test this hypothesis is to find a statistics book that has a table of critical values of r. Most introductory statistics texts would have a table like this. As in all hypothesis testing, you need to first determine the significance level. Here, I'll use the common significance level of alpha = .05. This means that I am conducting a test where the odds that the correlation is a chance occurrence is no more than 5 out of 100. Before I look up the critical value in a table I also have to compute the degrees of freedom or df. The df is simply equal to N-2 or, in this example, is 20-2 = 18. Finally, I have to decide whether I am doing a one-tailed or two-tailed test. In this example, since I have no strong prior theory to suggest whether the relationship between height and self esteem would be positive or negative, I'll opt for the two-tailed test. With these three pieces of information -- the significance level (alpha = .05)), degrees of freedom (df = 18), and type of test (two-tailed) -- I can now test the significance of the correlation I found. When I look up this value in the handy little table at the back of my statistics book I find that the critical value is .4438. This means that if my correlation is greater than .4438 or less than -.4438 (remember, this is a two-tailed test) I can conclude that the odds are less than 5 out of 100 that this is a chance occurrence. Since my correlation 0f .73 is actually quite a bit higher, I conclude that it is not a chance finding and that the correlation is statistically significant (given the parameters of the test). I can reject the null hypothesis and accept the alternative. The Correlation Matrix All I've shown you so far is how to compute a correlation between two variables. In most studies we have considerably more than two variables. Let's say we have a study with 10 interval-level variables and we want to estimate the relationships among all of them (i.e., between all possible pairs of variables). In this instance, we have 45 unique correlations to estimate (more later on how I knew that!). We could do the above computations 45 times to obtain the correlations. Or we could use just about any statistics program to automatically compute all 45 with a simple click of the mouse. I used a simple statistics program to generate random data for 10 variables with 20 cases (i.e., persons) for each variable. Then, I told the program to compute the correlations among these variables. Here's the result: C1 C2 C3 C4 C5 C6 C7 C8 C9 C10 C1 1.000 C2 0.274 1.000 C3 -0.134 -0.269 1.000 C4 0.201 -0.153 0.075 1.000 C5 -0.129 -0.166 0.278 -0.011 1.000 C6 -0.095 0.280 -0.348 -0.378 -0.009 1.000 C7 0.171 -0.122 0.288 0.086 0.193 0.002 1.000 C8 0.219 0.242 -0.380 -0.227 -0.551 0.324 -0.082 1.000 C9 0.518 0.238 0.002 0.082 -0.015 0.304 0.347 -0.013 1.000 C10 0.299 0.568 0.165 -0.122 -0.106 -0.169 0.243 0.014 0.352 1.000 This type of table is called a correlation matrix. It lists the variable names (C1-C10) down the first column and across the first row. The diagonal of a correlation matrix (i.e., the numbers that go from the upper left corner to the lower right) always consists of ones. That's because these are the correlations between each variable and itself (and a variable is always perfectly correlated with itself). This statistical program only shows the lower triangle of the correlation matrix. In every correlation matrix there are two triangles that are the values below and to the left of the diagonal (lower triangle) and above and to the right of the diagonal (upper triangle). There is no reason to print both triangles because the two triangles of a correlation matrix are always mirror images of each other (the correlation of variable x with variable y is always equal to the correlation of variable y with variable x). When a matrix has this mirror-image quality above and below the diagonal we refer to it as a symmetric matrix. A correlation matrix is always a symmetric matrix. To locate the correlation for any pair of variables, find the value in the table for the row and column intersection for those two variables. For instance, to find the correlation between variables C5 and C2, I look for where row C2 and column C5 is (in this case it's blank because it falls in the upper triangle area) and where row C5 and column C2 is and, in the second case, I find that the correlation is -.166. OK, so how did I know that there are 45 unique correlations when we have 10 variables? There's a handy simple little formula that tells how many pairs (e.g., correlations) there are for any number of variables: where N is the number of variables. In the example, I had 10 variables, so I know I have (10 * 9)/2 = 90/2 = 45 pairs. Other Correlations The specific type of correlation I've illustrated here is known as the Pearson Product Moment Correlation. It is appropriate when both variables are measured at an interval level. However there are a wide variety of other types of correlations for other circumstances. for instance, if you have two ordinal variables, you could use the Spearman rank Order Correlation (rho) or the Kendall rank order Correlation (tau). When one measure is a continuous interval level one and the other is dichotomous (i.e., two-category) you can use the Point-Biserial Correlation. For other situations, consulting the web-based statistics selection program, Selecting Statistics at http://trochim.human.cornell.edu/selstat/ssstart.htm.