Edwards climate data detectives - yale 2-2015
•
1 like•835 views

Talk to the Yale History of Science/History of Medicine group on 9 Feb 2015. Discusses evolving knowledge infrastructures, the history of weather and climate data, and several recent controversies over climate data. "Data detectives" refers to the forensic work involved in adjusting data for changes in instrument characteristics, location, etc.

Recommended
Recommended
More Related Content
Viewers also liked
Viewers also liked (20)
Similar to Edwards climate data detectives - yale 2-2015
Similar to Edwards climate data detectives - yale 2-2015 (20)
Recently uploaded
Recently uploaded (20)
Edwards climate data detectives - yale 2-2015
- 1. 10 Feb 2015Paul N. Edwards
- 2. Climate Data Detectives On the History and Politics of Knowledge about Global Climate Change Paul N. Edwards School of Information and Dept. of History, University of Michigan This work is licensed under the Creative Commons Attribution-ShareAlike 2.5 Generic License, creativecommons.org/licenses/by-sa/2.5/
- 3. Climate data: 2014 “warmest year in modern record” Source: NASA 10 Feb 2015Paul N. Edwards
- 4. Climate data: 1950-2014 temperature trend (°C per decade) Source: NASA 10 Feb 2015Paul N. Edwards
- 5. Climate data: 131 years of warming in 26 seconds 10 Feb 2015Paul N. Edwards
- 6. Twelfth Session of Working Group I Approved Summary for Policymakers Figure SPM.7 [FIGURE SUBJECT TO FINAL COPYEDIT] Climate models 21st century emissions scenarios (2013) Source: Intergovernmental Panel on Climate Change, Fifth Assessment Report (2013) RCP = Representative Concentration Pathway 10 Feb 2015Paul N. Edwards
- 7. Climate models: Surface temp change by end of 21st century (IPCC 2013) Twelfth Session of Working Group I Approved Summary for Policymakers Figure SPM.8 [FIGURE SUBJECT TO FINAL COPYEDIT] Source: Intergovernmental Panel on Climate Change, 5th assessment report (2013)
- 8. Today Evolving knowledge infrastructures A little history of climate data Metadata friction (or, why some numbers keep changing) Climate data detectives (or, always check your work) The future of science in an age of radical transparency 10 Feb 2015Paul N. Edwards
- 9. Today Evolving knowledge infrastructures A little history of climate data Metadata friction (or, why some numbers keep changing) Climate data detectives (or, always check your work) The future of science in an age of radical transparency 10 Feb 2015Paul N. Edwards
- 10. Knowledge infrastructures } Robust networks of people, equipment, and institutions } Generate, share, and maintain specific knowledge } Routine, widely accepted } Examples: } National census bureaus } Centers for Disease Control } World Weather Watch } Intergovernmental Panel on Climate Change? 10 Feb 2015Paul N. Edwards
- 11. Scientific traditions } Pyramids of expert authority } Reputation systems based on pedigree, past performance, peer review } Data and models were “property” of creator } Work products } Too voluminous and expensive to publish } Data and code often produced by lower-status co-workers } Quality control: peer review } Informal discussion, conference presentations, letters, drafts… } Journals } Data and code could be reviewed — but rarely were 10 Feb 2015Paul N. Edwards
- 12. Knowledge utopia? } A scientific culture of “extreme openness” where “all information of scientific value, from raw data and computer code to all the questions, ideas, folk knowledge, and speculations that are currently locked up inside the heads of individual scientists” is moved onto the network… — M. Nielsen, Reinventing Discovery (2011, 183) } A “cognitive surplus” will permit massively distributed contributions to the analysis of information and the production of new knowledge — C. Shirky, Cognitive Surplus (2011) 10 Feb 2015Paul N. Edwards
- 13. 1872 US War Dept. weather map Weather observing systems: old and robust
- 14. 1870 1900 1930 1960 Global coverage by surface stations 10 Feb 2015Paul N. Edwards
- 15. L.F. Richardson’s “forecast-factory” (1922) Illustration by François Schuiten (1990s)
- 16. Computer models of the atmosphere } 1950s: weather prediction } Start from initial state (observations) } Simulate its evolution 10 Feb 2015Paul N. Edwards
- 17. World Weather Watch • initial planning early 1960s • operational about 1968 10 Feb 2015Paul N. Edwards
- 18. Analysis models Computer models in weather forecasting } Ingest observations } Analysis: use observations to correct data from previous forecast (simulation) } Create coherent global simulation 10 Feb 2015Paul N. Edwards
- 19. Forecast skill improvement: US Weather Service, 1955-2010 Despite the remarkable advances over the past 50 years, some formidable challenges remain. Sudden weather changes and extremes cause much human hardship and damage to property. These rapid develop- ments often involve intricate interactions between dynamical and physical processes, both of which have fast and slow time-scales. The effective computational coupling between the dynamical processes and physical Fig. 4. Skill of the 36 hour (1955–2004) and 72 hour (1977–2004) 500 hPa forecasts produced at NCEP. Forecast skill is expressed as a percentage of an essentially perfect forecast score. Thanks to Bruce Webster of NCEP for the graphic of S1 scores. 12 P. Lynch / Journal of Computational Physics xxx (2007) xxx–xxx ARTICLE IN PRESS Source: Peter Lynch,“The Origins of Computer Weather Prediction and Climate Modeling,” Journal of Computational Physics 227, no. 7 (2008): 3431-44 500mb forecast quality, expressed as a percentage of a “perfect” forecast 10 Feb 2015Paul N. Edwards
- 20. The World Weather Watch as a knowledge infrastructure } Robust networks of people, equipment, and institutions } Generate, share, and maintain specific knowledge } Routine, widely accepted 10 Feb 2015Paul N. Edwards
- 21. Today Evolving knowledge infrastructures A little history of climate data Metadata friction (or, why some numbers keep changing) Climate data detectives (or, always check your work) The future of science in an age of radical transparency 10 Feb 2015Paul N. Edwards
- 22. Climate = average of simulated weather (not daily details) Climate Weather Source: www-k12.atmos.washington.edu/k12/grayskies/ Mar Apr May Jun July Aug Sep Oct Nov Dec Jan Feb Climate is what we expect — weather is what we get 10 Feb 2015Paul N. Edwards
- 23. Climate variability vs. climate change We see the sum of both Climate variability (natural swings) Climate change (e.g. warming trend) Time (years) 10 Feb 2015Paul N. Edwards
- 24. Four ways of knowing about climate } Observations (data): what happens } Theories (physics): why it happens } Experiments } Hold everything constant, change one factor: what happens? } Simulation } Make a model of a real system } Conduct experiments on the model 10 Feb 2015Paul N. Edwards
- 25. Reproducing the climate of the 20th century Black line: observations Top: 58 simulations from 14 models with both natural and anthropogenic forcings (red trend line) Bottom: 19 simulations from 5 models with natural forcings only (blue trend line) Source: IPCC Fourth Assessment Report, 2007 10 Feb 2015Paul N. Edwards
- 26. Source: IPCC Fifth Assessment Report (2013) Black line: 20th c. observations Pink bar: model ensemble including human activity Gray bar: model ensemble without human activity 10 Feb 2015Paul N. Edwards
- 27. 9 global temperature data sets Source: IPCC Fourth Assessment Report, 2007 10 Feb 2015Paul N. Edwards
- 28. Data friction Changes in instrumentation (Karl et al. 1993) Tom Karl (l), another guy (r)Paul N. Edwards
- 29. Source: Palutikof and Goddess (1986) Data friction 10 Feb 2015Paul N. Edwards
- 30. Today Evolving knowledge infrastructures A little history of climate data Metadata friction (or, why some numbers keep changing) Climate data detectives (or, always check your work) The future of science in an age of radical transparency 10 Feb 2015Paul N. Edwards
- 31. 9 global temperature data sets Source: IPCC Fourth Assessment Report, 2007 10 Feb 2015Paul N. Edwards
- 32. Infrastructural inversion: Making data global } Köppen 1881: fewer than 100 stations } Callendar 1938: about 200 stations } Willett 1950: 183 stations } Callendar 1961: 450 stations } Mitchell 1963: 183 stations Ò Jones et al. 1986: 2194 stations Ò Brohan et al. 2006: 4349 stations Ò Muller et al. 2012: 39,340 stations! 10 Feb 2015Paul N. Edwards
- 33. Source: skepticalscience.com Metadata matter! 10 Feb 2015Paul N. Edwards
- 34. Recent global temperature datasets Source: IPCC Fourth Assessment Report, 2007 10 Feb 2015Paul N. Edwards
- 35. Today Evolving knowledge infrastructures A little history of climate data Metadata friction (or, why some numbers keep changing) Climate data detectives (or, always check your work) } The hockey stick } Climategate } Berkeley Earth Surface Temperature } Surfacestations.org The future of science in an age of radical transparency 10 Feb 2015Paul N. Edwards
- 36. Today Evolving knowledge infrastructures A little history of climate data Metadata friction (or, why some numbers keep changing) Climate data detectives (or, always check your work) } The hockey stick } Climategate } Berkeley Earth Surface Temperature } Surfacestations.org The future of science in an age of radical transparency 10 Feb 2015Paul N. Edwards
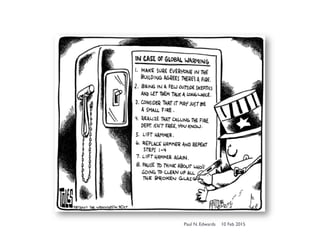
- 37. 2010 cartoon (soon after “Climategate” + Washington DC snowstorm)10 Feb 2015Paul N. Edwards
- 38. The “Medieval Warm Period” } 1965 research, based entirely on records from England — but claim was global } Vikings sailed ice-free seas to Greenland } 2009 study: some parts of northern hemisphere as warm as mid-20th c 10 Feb 2015Paul N. Edwards
- 39. 26 H.H. LAMB 10,~ , A 1ZO*Cr gOO 11OO 1300 1500 1700 19OOA.D. i i i i i i i i i i i 110.5oC • --- T 7"0.c 5.O*C 15.0"C 4.0 .O • 3.5 .O I I I I I I I 1 900 11OO 1300 1500 1700 19OOA.D. Observed values .........Unadjo~.ed volues based on purely meteocok:x;jicalevidence (see t.ext) ..... Prefferred values including temperatures adjusted to fit botanical ~:~c~ions (see text) ....... Connects points corresponding to lO0-E)Oyear means indicted by sparse data -- Analyst's opinion (see text.) Fig.3. Temperatures (°C) prevailing in central England, 50-year averages. A: year; B: high summer (July and August), and C: winter (December, January and February). Observed values (as standardized by MANLEV, 1958, 1961) from 1680. Values for earlier periods derived as de- scribed in the text. The ranges indicated by vertical bars are three times the standard error of the estimates. examined in relation to their departures from lines representing the regression equations and in relation to what is known of the meteorology of each decade since 1680 (particularly the prevailing January and July circulation patterns) (LAMB1963a,b). The average winter temperatures 1 in the second column of Table II and the July and August rainfall values were derived in this straightforward mannerL The July-August rainfalls may be satisfactory without any adjustment and are What Lamb actually said… Source: H.H. Lamb,“ The early medieval warm epoch and its sequel.” Palaeogeography, Palaeoclimatology, Palaeoecology 1: 13 (1965) 10 Feb 2015Paul N. Edwards
- 40. Source: Mann, Bradley & Hughes, Geophysical Research Letters 26 (1999) The hockey stick controversy (starting ~2000 — early in the Web era) 10 Feb 2015Paul N. Edwards
- 41. Science meets accounting: Climate “audits” (blog started early 2000s) 10 Feb 2015Paul N. Edwards
- 42. McIntyre vs. Mann } Early 2000s: Stephen McIntyre requested Michael Mann’s data } Mann provided some, posted the rest } Later, requested source code as well as data } Hearings at the US House Subcommittee on Oversight and Investigation } Demanded Mann’s CV, a list of all his grants and other financial support, all the data for all his published work, the source code used to produce his results, and an “explanation” of all his work for the IPCC } Others involved: NSF, NRC,AAAS, NAS… McIntyre Mann10 Feb 2015Paul N. Edwards
- 43. Mann’s argument against code sharing } “Our source code wasn’t necessary to reproduce and verify our findings. [Other] scientists … had independently implemented our algorithm without access to our source code.” } “Our source code was our intellectual property. …We had more than met the standards of disclosure of data and methods expected of NSF-funded scientists. } “… It was source code today, but where would it end? Short scripts, research notes, perhaps even private e-mail correspondence?” 2012 10 Feb 2015Paul N. Edwards
- 44. NRC review of the “hockey stick” reconstruction (2006) Source: Committee on Surface Temperature Reconstructions for the Last 2000Years, Board on Atmospheric Sciences and Climate, and National Research Council, SurfaceTemperature Reconstructions for the Last 2,000Years (National Academies Press, 2006), p. 2. 10 Feb 2015Paul N. Edwards
- 45. Today Evolving knowledge infrastructures A little history of climate data Metadata friction (or, why some numbers keep changing) Climate data detectives (or, always check your work) } The hockey stick } Climategate } Berkeley Earth Surface Temperature } Surfacestations.org The future of science in an age of radical transparency 10 Feb 2015Paul N. Edwards
- 46. November 2009 10 Feb 2015Paul N. Edwards
- 47. The Climatic Research Unit } Univ. of East Anglia, UK } 2005: new UK freedom of information law } 105 FOI requests to CRU } 58 from McIntyre } A siege mentality 10 Feb 2015Paul N. Edwards
- 48. Not releasing data From: Phil Jones <p.jones@uea.ac.uk> To: mann@virginia.edu Subject: Fwd: CCNet: PRESSURE GROWING ON CONTROVERSIAL RESEARCHER TO DISCLOSE SECRET DATA Date: Mon Feb 21 16:28:32 2005 Cc: "raymond s. bradley" <rbradley@geo.umass.edu>, "Malcolm Hughes" mhughes@ltrr.arizona.edu Mike, Ray and Malcolm, The skeptics seem to be building up a head of steam here ! Maybe we can use this to our advantage to get the series updated !... …The IPCC comes in for a lot of stick. Leave it to you to delete as appropriate ! Cheers Phil PS I'm getting hassled by a couple of people to release the CRU station temperature data. Don't any of you three tell anybody that the UK has a Freedom of Information Act ! 10 Feb 2015Paul N. Edwards
- 49. Email as metadata: “Mike’s Nature trick” } Phil Jones email: “I’ve just completed Mike’s Nature trick [Michael Mann] of adding in the real temps to each series for the last 20 years (i.e from 1981 onwards) and from 1961 for Keith [Briffa]’s to hide the decline.” 10 Feb 2015Paul N. Edwards
- 50. Criminal behavior? Senator James Inhofe: “The released CRU emails and documents display unethical, and possibly illegal, behavior.” “….manipulating data …unjustified changes to data by federal employees and federal grantees.” Source: United States Senate Committee on Environment and Public Works, Minority Staff report,“’Consensus’ Exposed:The CRU Controversy,” Feb. 2010 10 Feb 2015Paul N. Edwards
- 51. How likely is it that CRU manipulated data to make a case for global warming? -1.0 -0.5 0.0 0.5 1.0 1.5 2.0 1850 1870 1890 1910 1930 1950 1970 1990 2010 NCDC 11-year average NASA GISS 11-year average HadCRUT3 11-year average Figure 1: Three time series of globally-averaged annual mean temperature anomalies in degrees Celsius, together with their 11-year unweighted moving averages. • The blue (circles) data (1850-2007) from the Hadley Centre (British) are calculated with respect to the 1961-1990 base period. • The red (diamonds) data (1880-2007) from NASA GISS are calculated with respect to the 1951-1980 base period. • The green (squares) data (1880-2007) from NOAA NCDC are calculated with respect to the 1901-2000 base period. The latter two sets of data have been offset in the vertical direction by increments of 0.5°C Source: “Waiting for Global Cooling” (Fawcett & Jones 2008) CRU data (bottom) vs. two independently calculated data sets Lines are offset in order to make them all visible (agreement is large) 10 Feb 2015Paul N. Edwards
- 52. Increase in mean near-surface temperature (°C) from (1989-98) to (1999-2008) HadCRUT is a large but selective sample of surface temperature data ECMWF uses uses all available surface temperature measurements, plus satellites, radiosondes, ships and buoys. Source: UK Met Office, Dec. 2009 HadCRUT ECMWF CRU data show less temperature increase than ECMWF
- 53. Today Evolving knowledge infrastructures A little history of climate data Metadata friction (or, why some numbers keep changing) Climate data detectives (or, always check your work) } The hockey stick } Climategate } Berkeley Earth Surface Temperature } Surfacestations.org The future of science in an age of radical transparency 10 Feb 2015Paul N. Edwards
- 54. The mother of all audits Richard Muller 10 Feb 2015Paul N. Edwards
- 55. Berkeley Earth (2012) Global land surface average temperature 1750 1800 1850 1900 1950 2000 −1.5 −1 −0.5 0 0.5 1 TemperatureAnomaly(°C) Decadal Land−Surface Average Temperature NASA GISS NOAA / NCDC Hadley / CRU Berkeley Earth 10−year moving average of surface temperature over land Gray band indicates 95% uncertainty interval 10 Feb 2015Paul N. Edwards
- 56. Today Evolving knowledge infrastructures A little history of climate data Metadata friction (or, why some numbers keep changing) Climate data detectives (or, always check your work) } The hockey stick } Climategate } Berkeley Earth Surface Temperature } Surfacestations.org The future of science in an age of radical transparency 10 Feb 2015Paul N. Edwards
- 57. Anthony Watts 10 Feb 2015Paul N. Edwards
- 58. “Mid term census report” released in 2009 Screenshot of surfacestations.org home page, January 22, 2015 Report still near top of home page 10 Feb 2015Paul N. Edwards
- 59. From A.Watts,“Is the U.S.Temperature Record Reliable?”, Heartland Institute, 2009 MMTS = Maximum/Minimum Temperature System (electronic thermistor) “We were shocked by what we found… 9 of every 10 stations are likely reporting higher or rising temperatures because they are badly sited (p. 3)” 10 Feb 2015Paul N. Edwards
- 60. “Station quality ratings obtained from NOAA/NCDC via this source: Climate Reference Network Rating Guide - adopted [sic] from NCDC Climate Reference Network Handbook, 2002, specifications for siting (section 2.2.1)” 10 Feb 2015Paul N. Edwards
- 61. #$%&# Figure 1. USHCN exposure classifications according to surfacestations.org (circles and$%'# triangles). Filled symbols are in agreement with independent assessments by$%(# USHCN exposure classifications according to surfacestations.org (circles and triangles). Filled symbols are in agreement with independent assessments by NOAA/National Weather Service Forecast Office personnel. …Ratings 1 and 2 are treated as “good” exposure sites; ratings 3, 4 and 5 are considered “poor” exposure. Source: “V1.05 USHCN Master Station List”. Menne et al. (2010), Fig. 1 Using metadata to audit surfacestations.org Menne et al. 2010 10 Feb 2015Paul N. Edwards
- 62. #$%%# Figure 7. Comparison of the CONUS average annual (a) maximum and (b) minimum$%&# temperatures calculated using USHCN version 2 adjusted temperatures [Menne et al. 2009]$&'# and USCRN departures from the 1971-2000 normal. Good and poor site ratings are based$&(# on surfacestations.org as in Fig. 1.$&!# !$&)# “Comparison of the [continental US] average annual (a) maximum and (b) minimum temperatures calculated using USHCN version 2 adjusted temperatures [Menne et al. 2009] and USCRN departures from the 1971-2000 normal. Good and poor site ratings are based on surfacestations.org.” Source: Menne et al., "On the reliability of the U.S. Surface Temperature Record,” J. Geophys. Research (2010), Fig. 7 10 Feb 2015Paul N. Edwards
- 63. Menne et al. conclusions Widespread poor site exposure in USHCN is real, but… Adjustments applied to USHCNVersion 2 data largely account for the impact of instrument and siting changes, although a small overall residual negative (“cool”) bias appears to remain… We find no evidence that …US temperature trends are inflated due to poor station siting. 10 Feb 2015Paul N. Edwards
- 64. “…poor siting [leads] to an overestimate of minimum temperature trends and an underestimate of maximum temperature trends…. [but] the overall mean temperature trends are nearly identical across site classifications.” Fall, Watts, et al. (JGR 2011) Peer-reviewed analysis of surfacestations.org results: 10 Feb 2015Paul N. Edwards
- 65. Today Evolving knowledge infrastructures A little history of climate data Metadata friction (or, why some numbers keep changing) Climate data detectives (or, always check your work) The future of science in an age of radical transparency 10 Feb 2015Paul N. Edwards
- 66. Science online: data controversies continue 10 Feb 2015Paul N. Edwards
- 67. Some more responsible data detectives… 10 Feb 2015Paul N. Edwards
- 68. 10 Feb 2015Paul N. Edwards
- 69. Mandates for transparency } Funders require public access (NSF, NIH, others) } Often without support and maintenance budgets } Open source models } Open access data } Earth System Grid } National Climatic Data Center } many others 10 Feb 2015Paul N. Edwards
- 70. Beyond transparency: citizen science in the Internet age } Questioning data with more data } Seeking metadata — at every level } email, personal politics, etc. as metadata? } “Science audits” } Powerful distribution techniques } Massively expanded group of reviewers } Peer review as “pal review” } Experts recast as “insiders,” “tribal,” “self-interested,” “conspiratorial” } Irony: IPCC review process is most thorough, open, and transparent in history 10 Feb 2015Paul N. Edwards
- 71. Changing knowledge infrastructures Traditional paradigm Internet-era science } Data and models “property” of creator } Data analysis and coding require highly specialized skills & tools } Expertise requires extensive training } Authority and trust based on certified expertise } Pedigree, past performance, peer review } Data and model codes easily accessed } Commodity tools for data analysis; coding & statistics skills widespread } Expertise (still) requires extensive training } Authority and trust decoupled from certified expertise } Extensive review by anyone } Perceived authority based on appearance, messaging, repetition } Proliferation of journals } including fake ones! 10 Feb 2015Paul N. Edwards
- 72. Conclusions } Metadata really matter! } Transparency does not automatically increase agreement } Climate data will always “shimmer” } But data detective work eventually brings reconciliation } “Proliferation within convergence” (Edwards 2010) } Knowledge politics today is data politics 10 Feb 2015Paul N. Edwards
- 73. Reproducing the climate of the 20th century Black line: observations Top: 58 simulations from 14 models with both natural and anthropogenic forcings (red trend line) Bottom: 19 simulations from 5 models with natural forcings only (blue trend line) Source: IPCC Fourth Assessment Report, 2007 10 Feb 2015Paul N. Edwards