8 stepfuturestatevaluestreammapping
•Télécharger en tant que PPTX, PDF•
5 j'aime•63,665 vues

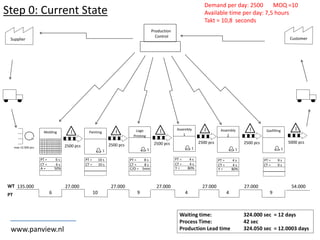
8 steps for Future State Value Stream mapping, using my personal Lighter Factory Example, More information and explenation to this example can be found on www.panview.nl

Recommandé
Contenu connexe
Tendances
Tendances (20)
Similaire à 8 stepfuturestatevaluestreammapping
Similaire à 8 stepfuturestatevaluestreammapping (19)
Plus de Panview
Plus de Panview (20)
Dernier
Dernier (20)
8 stepfuturestatevaluestreammapping
- 1. Step 0: Current State GasfillingAssembly 1 PaintingMolding Logo Printing Supplier Customer CT = 6 s PT = 6 s A = 50% CT = 10 s PT = 10 s CT = 8 s PT = 8 s C/O = 5min CT = 4 s PT = 4 s Y = 80% CT = 9 s PT = 9 s 135.000 27.000 27.000 27.000 27.000 27.000 54.000 6 10 9 4 4 9 WT PT 1 1 1 1 Demand per day: 2500 MOQ =10 Available time per day: 7,5 hours Takt = 10,8 seconds I I I I Assembly 2 CT = 4 s PT = 4 s Y = 80% 1 2500 pcs I 5000 pcs I Waiting time: 324.000 sec = 12 days Process Time: 42 sec Production Lead time 324.050 sec = 12.0003 days Production Control 2500 pcs2500 pcs2500 pcs2500 pcsmax 12.500 pcs www.panview.nl
- 2. Step 1:Can all Workstations Keep Takt? GasfillingAssembly 1 PaintingMolding Logo Printing Supplier Customer CT = 6 s PT = 6 s A = 50% CT = 10 s PT = 10 s CT = 4 s PT = 4 s Y = 80% CT = 9 s PT = 9 s 1 1 1 1 Takt = 10,8s PCT = 10s MOQ =10 I I I I Assembly 2 CT = 4 s PT = 4 s Y = 80% 1 2500 pcs I 5000 pcs I Waiting time: 324.000 sec = 12 days Process Time: 42 sec Production Lead time 324.050 sec = 12.0003 days Production Control 2500 pcs2500 pcs2500 pcs2500 pcs A ≥60% Or CT ≤5s max 12.500 pcs CT = 8 s PT = 8 s C/O = 5min www.panview.nl
- 3. Step 2: Finished Goods Strategy? GasfillingAssembly 1 PaintingMolding Logo Printing Supplier Customer CT = 6 s PT = 6 s A = 60% CT = 10 s PT = 10 s CT = 4 s PT = 4 s Y = 80% CT = 9 s PT = 9 s 1 1 1 1 Takt = 10,8s PCT = 10s I I I I Assembly 2 CT = 4 s PT = 4 s Y = 80% 1 2500 pcs I 5000 pcs I Waiting time: 324.000 sec = 12 days Process Time: 42 sec Production Lead time 324.050 sec = 12.0003 days Production Control 2500 pcs2500 pcs2500 pcs2500 pcs Direct Shipping max 12.500 pcs CT = 8 s PT = 8 s C/O = 5min www.panview.nl
- 4. Step 3: Where can we implement Flow? GasfillingAssembly 1 PaintingMolding Logo Printing Supplier Customer CT = 6 s PT = 6 s A = 60% CT = 10 s PT = 10 s CT = 4 s PT = 4 s Y = 80% CT = 9 s PT = 9 s 1 1 1 1 Takt = 10,8s PCT = 10s I I I I Assembly 2 CT = 4 s PT = 4 s Y = 80% 1 2500 pcs I 5000 pcs I Waiting time: 324.000 sec = 12 days Process Time: 42 sec Production Lead time 324.050 sec = 12.0003 days Production Control 2500 pcs2500 pcs2500 pcs2500 pcs Implement Flow F I F O Max. 2500 Yield ≥ 90% max 12.500 pcs CT = 8 s PT = 8 s C/O = 5min www.panview.nl
- 5. Step 4: Where do we need to buffer Flow? GasfillingAssembly 1 PaintingMolding Logo Printing Supplier Customer CT = 6 s PT = 6 s A = 60% CT = 10 s PT = 10 s CT = 4 s PT = 4 s Y = 80% CT = 9 s PT = 9 s 1 1 1 1 Takt = 10,8s PCT = 10s I I I Assembly 2 CT = 4 s PT = 4 s Y = 80% 1 2500 pcs I 5000 pcs I Waiting time: 324.000 sec = 12 days Process Time: 42 sec Production Lead time 324.050 sec = 12.0003 days Production Control 2500 pcs2500 pcs2500 pcs F I F O Max. 2500 Assembly 1+2 U 1 A = 90% CT = 8 s PT = 8 s Implement FIFO Implement FIFO max 12.500 pcs CT = 8 s PT = 8 s C/O = 5min www.panview.nl
- 6. Step 5: How do we control production? GasfillingAssembly 1 PaintingMolding Logo Printing Supplier Customer CT = 6 s PT = 6 s A = 60% CT = 10 s PT = 10 s CT = 9 s PT = 9 s 1 1 1 1 Takt = 10,8s PCT = 10s I I Assembly 2 Waiting time: 324.000 sec = 12 days Process Time: 42 sec Production Lead time 324.050 sec = 12.0003 days Production Control 2500 pcs2500 pcs F I F O Max. 2500 Assembly 1+2 U 1 A = 90% CT = 8 s PT = 8 s Implement Supermarket F I F O Max. 2500 F I F O Max. 2500 Implement Supermarket max 12.500 pcs CT = 8 s PT = 8 s C/O = 5min www.panview.nl
- 7. Step 6: Where is the pacemaker? GasfillingAssembly 1 PaintingMolding Logo Printing Supplier Customer CT = 6 s PT = 6 s A = 60% CT = 10 s PT = 10 s CT = 9 s PT = 9 s 1 1 1 1 Takt = 10,8s PCT = 10s Assembly 2 Waiting time: 324.000 sec = 12 days Process Time: 42 sec Production Lead time 324.050 sec = 12.0003 days Production Control F I F O Max. 2500 Assembly 1+2 U 1 A = 90% CT = 8 s PT = 8 s F I F O Max. 333 F I F O Max. 333 max 12.500 pcs Max. 2500Max. 333 One signal neccessary CT = 8 s PT = 8 s C/O = 5min www.panview.nl
- 8. Step 7: How do we level the mix? GasfillingAssembly 1 PaintingMolding Logo Printing Supplier Customer CT = 6 s PT = 6 s A = 60% CT = 10 s PT = 10 s CT = 9 s PT = 9 s 1 1 1 1 Takt = 10,8s PCT = 10s Assembly 2 Waiting time: 324.000 sec = 12 days Process Time: 42 sec Production Lead time 324.050 sec = 12.0003 days Production Control F I F O Max. 2500 Assembly 1+2 U 1 A = 90% CT = 8 s PT = 8 s F I F O Max. 333 F I F O Max. 333 max 12.500 pcs Max. 2500 per colorMax. 333 Level the mix at the pacemaker (color) CT = 8 s PT = 8 s C/O = 5min www.panview.nl
- 9. Step 8: Wat size increments should we feed the line? GasfillingAssembly 1 PaintingMolding Logo Printing Supplier Customer CT = 6 s PT = 6 s A = 60% CT = 10 s PT = 10 s CT = 9 s PT = 9 s 1 1 1 1 Takt = 10,8s PCT = 10s Assembly 2 Waiting time: 324.000 sec = 12 days Process Time: 42 sec Production Lead time 324.050 sec = 12.0003 days Production Control F I F O Max. 2500 Assembly 1+2 U 1 A = 90% CT = 8 s PT = 8 s F I F O Max. 333 F I F O Max. 333 max 12.500 pcs Max. 333 per colorMax. 333 Intervall = 20 min O X O X CT = 8 s PT = 8 s C/O = 5min EPEI = 7.5 h www.panview.nl
- 10. Future State (incl Timeline) GasfillingPaintingMolding Logo Printing Supplier Customer CT = 6 s PT = 6 s A = 60% CT = 10 s PT = 10 s CT = 8 s PT = 8 s CT = 9 s PT = 9 s 135.000 3.600 3.600 1.800 1.800 27.000 6 10 8 8 9 WT PT 1 1 1 Takt = 10,8s PCT = 10s Current State Future State Waiting time: 324.000 sec = 12 days 148.500 sec = 5,5 days Process Time: 41 sec 41 sec Production Lead time 324.049 sec = 12.0003 days 148.541 sec = 5.5003 days Production Control F I F O Max. 2500 Assembly 1+2 U 1 A = 90% CT = 8 s PT = 8 s F I F O Max. 333 F I F O Max. 333 max 12.500 pcs Max. 333 EPEI = 7.5 h O X O X Max. 333 per color C/O = 5 min www.panview.nl
- 11. Guidelines for developing future state VSM 1. Is the Process Capable of meeting Customer needs? Produce to TAKT time 2. Should we produce to Supermarket or direct to Shipping? Decide build strategy 3. Where is continuous flow possible? Create continuous flow 4. Where do we need to buffer flow? Use FIFO to buffer flow and keep sequence 5. How do we control production? Use supermarkets to control production 6. Where is the pacemaker process? Send customer schedule to one point in the process 7. How do we level the production mix? Level the production mix at the pacemaker 8. What increment of monitor / control the process? Release small, consistent increments of work at pacemaker www.panview.nl
Notes de l'éditeur
- EPEI of 1 hour possible (3 change overs per hour, or every 20 minutes) Supermarket can contrain 1hour for each of the 3 colors = 1000 pieces max
- Warehouse: 1 week = 5 days * 7,5h *3600 = 135k Supermarkets: 1 hour = 2500/7,5 * takt =3600 FIFO: want to be empty, so 1 hour = 2500/7,5 * takt / 2 = 1800