Mercer county real estate market update 8.23.10
•Télécharger en tant que PPT, PDF•
0 j'aime•316 vues

Mercer County Real Estate Market Stats 8-23-10 The facts are in the data. Know the market and get information that you can't find anywhere else on the web. Check out my market update and let me know how I can help you with your real estate needs. The following stats on West Windsor, Lawrence, East Windsor, Ewing, Hopewell, Cranbury, Plainsboro, South Brunswick, Montgomery, Hamilton, Franklin, Princeton Township, Princeton Boro, Robbinsville, Hightstown, Penningtion, and Monroe are provided: Active Listings NJ Pending in Last 30 Days Absorption Rate New Listings Net Gain (Loss) to Market Listings Reduced in 30 Days % of Inventory Reduced Expired Listings Withdrawn Listings Closed Listings

Recommandé
Contenu connexe
Plus de Weichert Real Estate Agent
Plus de Weichert Real Estate Agent (20)
Dernier
Dernier (20)
Mercer county real estate market update 8.23.10
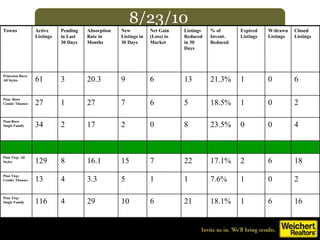
- 1. 8/23/10 Towns Active Listings Pending in Last 30 Days Absorption Rate in Months New Listings in 30 Days Net Gain (Loss) to Market Listings Reduced in 30 Days % of Invent. Reduced Expired Listings W/drawn Listings Closed Listings Princeton Boro: All Styles 61 3 20.3 9 6 13 21.3% 1 0 6 Pton -Boro Condo/ Thouses 27 1 27 7 6 5 18.5% 1 0 2 Pton-Boro Single Family 34 2 17 2 0 8 23.5% 0 0 4 Pton Twp: All Styles 129 8 16.1 15 7 22 17.1% 2 6 18 Pton Twp: Condo/ Thouses 13 4 3.3 5 1 1 7.6% 1 0 2 Pton Twp: Single Family 116 4 29 10 6 21 18.1% 1 6 16
- 2. 8/23/10 Towns Active Listings Pending in Last 30 Days Absorption Rate in Months New Listings in 30 Days Net Gain (Loss) to Market Li1stings Reduced in 30 Days % of Invent. Reduced Expired Listings W/drawn Listings Closed Listings West Windsor: All Styles 134 10 13.4 21 11 40 29.9% 7 5 31 West Windsor Condo/ T.Houses 26 4 6.5 6 2 6 23.1% 0 1 7 West Windsor 55+ 6 1 6 0 -1 -- -- 0 0 0 West Windsor Single Family 102 5 20.4 15 10 34 33.3% 7 4 24 Lawrence: All Styles 244 20 12.2 38 18 42 17.2% 6 11 28 Lawrence: Condo/ THouses 76 7 10.9 16 9 15 19.7% 3 4 8 Lawrence: 55+ 22 1 22 3 2 -- -- 0 1 7 Lawrence: Single Family 146 12 12.2 19 7 27 18.5% 3 6 13
- 3. 8/23/10 Towns Active Listings Pending in Last 30 Days Absorption Rate in Months New Listings in 30 Days Net Gain (Loss) to Market Listings Reduced in 30 Days % of Invent. Reduced Expired Listings W/drawn Listings Closed Listings PlainsboroAll Styles Plainsboro Condo/ THouses Plainsboro 55+ Plainsboro Single Family Cranbury: All Styles Cranbury: 55+ Cranbury: Single Family
- 4. 8/23/10 Towns Active Listings Pending in Last 30 Days Absorption Rate in Months New Listings in 30 Days Net Gain (Loss) to Market Listings Reduced in 30 Days % of Invent. Reduced Expired Listings W/drawn Listings Closed Listings Ewing: All Styles 305 16 19.1 60 44 76 24.9% 18 13 15 Ewing : Condo/ T.Houses 46 4 11.5 12 8 9 19.6% 4 6 2 Ewing 55+: 6 1 6 0 -1 -- -- 1 0 1 Ewing: Single Family 253 11 23 48 37 67 26.5% 13 7 12 East Windsor: All Styles 225 11 20.5 38 27 47 20.9% 13 9 10 East Windsor: Condo/ THouses 126 3 42 24 21 22 17.5% 8 4 5 East Windsor: 55+ 21 1 21 2 1 -- -- 1 0 1 East Windsor: Single Family 78 7 11.1 12 5 25 32.1% 4 5 4
- 5. 8/23/10 Towns Active Listings Pending in Last 30 Days Absorption Rate in Months New Listings in 30 Days Net Gain (Loss) to Market Listings Reduced in 30 Days % of Invent. Reduced Expired Listings W/drawn Listings Closed Listings Hopewell Twp. All Styles 171 13 13 26 13 27 16% 16 12 18 Hopewell Twp. Condo/ T.Houses 12 4 3 5 1 2 17% 0 2 1 Hopewell Twp.: 55+ 12 0 99 Hopewell Twp Single Family 147 9 16 21 5 25 17% 16 10 17 Hamilton: All Styles 651 48 14 111 63 156 24% 49 23 44 Hamilton: Condo/ THouses 111 8 14 23 15 34 31% 13 9 8 Hamilton: Single Family 494 39 13 88 49 122 25% 36 14 36 Hamilton: 55+ 46 1 46
- 6. 8/23/10 Towns Active Listings Pending in Last 30 Days Absorption Rate in Months New Listings in 30 Days Net Gain (Loss) to Market Listings Reduced in 30 Days % of Invent. Reduced Expired Listings W/drawn Listings Closed Listings Robbinsville All Styles Robbinsville All Styles 152 12 13 28 16 41 27% 15 8 9 Robbinsville Condo/ T.Houses Robbinsville Condo/ T.Houses 72 6 12 12 6 22 31% 9 4 5 Single Family Robbinsville single familiy 80 6 13 16 3 19 24% 6 4 4 - Hightstown Boro: All Styles Hightstown Boro: All Styles 77 1 77 9 8 14 18% 2 4 4 Pennington Pennington 16 2 8 2 0 0 0% 0 2 3 Hopewell Boro Hopewell Boro: All Styles 17 1 17 0 (1) 4 25% 0 0 3
- 7. 8/23/10 Towns Active Listings Pending in Last 30 Days Absorption Rate in Months New Listings in 30 Days Net Gain (Loss) to Market Listings Reduced in 30 Days % of Invent. Reduced Expired Listings W/drawn Listings Closed Listings South Brunswick All Styles 237 18 13 51 33 43 18% 22 6 21 South BrunswickCondo/ T.Houses 74 6 12 20 14 15 20% 5 3 10 South Brunswick 55+ 31 4 7.5 3 -1 1 3% 4 0 0 South Brunswick Single Family 132 8 17.5 28 20 27 20% 13 4 11 Monroe: All Styles 483 27 17 85 58 100 21% 38 6 42 Monroe: 55+ 299 21 14 46 25 71 24% 21 2 26 Monroe: Single Family 184 6 30 39 30 29 16% 17 4 16
- 8. 8/23/10 Towns Active Listings Pending in Last 30 Days Absorption Rate in Months New Listings in 30 Days Net Gain (Loss) to Market Listings Reduced in 30 Days % of Invent. Reduced Expired Listings W/drawn Listings Closed Listings Montgomery All Styles 159 20 8 31 -6 36 23% 6 9 22 Montgomery Condo/Twnhms 19 7 3 8 5 4 21% 1 2 0 Single Family 140 13 11 23 -4 32 23% 5 7 22 Hillsborough All Styles 278 53 5.25 68 27 48 17% 11 8 22 Hillsborough Condo/Twnhms 77 13 6 19 4 12 15% 5 3 7 Hillsborough Single Family 201 40 5 49 23 36 18% 6 5 15
Notes de l'éditeur
- Populate this table to show the local absorption rate in the various price ranges that are appropriate for your market area. Please add or delete rows as necessary to adequately reflect local conditions.
- Populate this table to show the local absorption rate in the various price ranges that are appropriate for your market area. Please add or delete rows as necessary to adequately reflect local conditions.
- Populate this table to show the local absorption rate in the various price ranges that are appropriate for your market area. Please add or delete rows as necessary to adequately reflect local conditions.
- Populate this table to show the local absorption rate in the various price ranges that are appropriate for your market area. Please add or delete rows as necessary to adequately reflect local conditions.
- Populate this table to show the local absorption rate in the various price ranges that are appropriate for your market area. Please add or delete rows as necessary to adequately reflect local conditions.
- Populate this table to show the local absorption rate in the various price ranges that are appropriate for your market area. Please add or delete rows as necessary to adequately reflect local conditions.
- Populate this table to show the local absorption rate in the various price ranges that are appropriate for your market area. Please add or delete rows as necessary to adequately reflect local conditions.
- Populate this table to show the local absorption rate in the various price ranges that are appropriate for your market area. Please add or delete rows as necessary to adequately reflect local conditions.