
Recommended
More Related Content
More from petergnz
More from petergnz (20)
Recently uploaded
Recently uploaded (20)
Consumers Price Index Dec09qtr Hotp
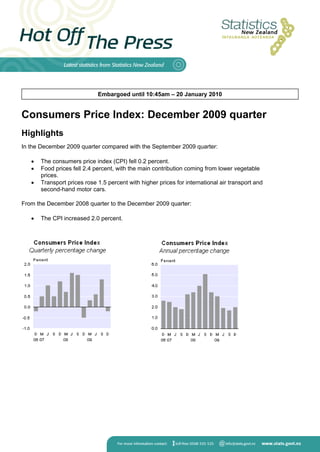
- 1. Embargoed until 10:45am – 20 January 2010 Consumers Price Index: December 2009 quarter Highlights In the December 2009 quarter compared with the September 2009 quarter: The consumers price index (CPI) fell 0.2 percent. Food prices fell 2.4 percent, with the main contribution coming from lower vegetable prices. Transport prices rose 1.5 percent with higher prices for international air transport and second-hand motor cars. From the December 2008 quarter to the December 2009 quarter: The CPI increased 2.0 percent.
- 2. Commentary Consumers price index quarterly movement The consumers price index (CPI) recorded a decrease of 0.2 percent in the December 2009 quarter, following increases of 1.3 percent and 0.6 percent in the September 2009 and June 2009 quarters, respectively. Four groups decreased, with food (down 2.4 percent) being the most significant contributor. Other downward contributions came from alcoholic beverages and tobacco (down 1.0 percent), communication (down 0.6 percent), and household contents and services (down 0.1 percent), while the education group recorded no overall change. Six groups recorded increases: transport (up 1.5 percent), clothing and footwear (up 1.8 percent), housing and household utilities (up 0.2 percent), recreation and culture (up 0.4 percent), health (up 0.6 percent), and miscellaneous goods and services (up 0.1 percent). The most significant individual downward contributions came from lower prices for lettuce (down 63.5 percent), audio-visual equipment (down 9.0 percent), and tomatoes (down 32.3 percent). Index Points Contribution to Consumers Price Index Group December 2009 quarter Food -5.01 Alcoholic beverages and tobacco -0.71 Communication -0.20 Household contents and services -0.08 Education -0.01 Miscellaneous goods and services 0.04 Health 0.33 Recreation and culture 0.44 Housing and household utilities 0.50 Clothing and footwear 0.84 Transport 2.28 All groups CPI -1.58 Note: Points contribution may not sum to total due to rounding. 2
- 3. Distribution of item-level movements The table below outlines the distribution of price movements in the September 2009 and December 2009 quarters. The CPI has been partitioned into those national item-level indexes that increased, showed no change, or decreased. Distribution of Item-level Index Movements June 2009 September 2009 National item-level index movements qtr to September 2009 qtr to December 2009 qtr qtr Increase in price Number of items 397 341 Percentage of all items 57.2 49.1 Percentage of expenditure weight 67.3 54.2 Index points contribution 18.3 11.3 Percentage point contribution 1.7 1.0 Weighted average price increase (%) 2.5 1.9 No change in price Number of items 118 91 Percentage of all items 17.0 13.1 Percentage of expenditure weight 9.4 8.8 Decrease in price Number of items 179 262 Percentage of all items 25.8 37.8 Percentage of expenditure weight 23.3 37.1 Index points contribution -4.9 -12.9 Percentage point contribution -0.5 -1.2 Weighted average price decrease (%) 1.9 3.2 3
- 4. The distribution of item-level movements shows that in the December 2009 quarter: the percentage of expenditure weight of items that increased in price fell significantly, while the percentage of expenditure weight of items that decreased in price rose. the weighted average price increase fell, while the weighted average price decrease rose significantly. the weighted average price decrease is now greater than the weighted average price increase. the 11.3 index points contribution of those items that increased in price is the smallest in at least five years and compares with a quarterly average of 16.8 index points over the past three years. These factors resulted in a 0.2 percent decrease in the CPI for the December 2009 quarter, following an increase of 1.3 percent in the September 2009 quarter. CPI annual movement The CPI increased 2.0 percent in the year to the December 2009 quarter, following increases of 1.7 percent and 1.9 percent for the years to the September 2009 and June 2009 quarters, respectively. Nine of the 11 groups in the CPI made upward contributions to the increase in the year to the December 2009 quarter. The most significant upward group contributions came from transport (up 3.7 percent), housing and household utilities (up 1.6 percent), and food (up 1.4 percent). The recreation and culture group (down 0.5 percent) and the communication group (down 0.2 percent) made downward contributions. The most significant individual upward contributions came from higher prices for the purchase of second-hand cars (up 13.3 percent) and petrol (up 3.3 percent). The most significant individual downward contributions came from lower prices for international air transport (down 9.6 percent), audio-visual equipment (down 14.8 percent), and overseas package holidays (down 10.5 percent). CPI analytical series In the December 2009 quarter, the tradable component decreased 0.5 percent, following increases of 1.6 percent and 0.8 percent in the September and June 2009 quarters, respectively. The non-tradable component increased 0.1 percent in the December 2009 quarter, following increases of 1.0 percent and 0.5 percent in the September and June 2009 quarters, respectively. For the year to the December 2009 quarter, the non-tradable component increased 2.3 percent. The most significant upward contributions came from local authority rates and payments and from vehicle relicensing fees. The 2.3 percent annual increase in the non-tradable component is the lowest since the year to the December 2001 quarter, reflecting relatively low annual increases for electricity, rentals for housing, and the purchase of new housing. The tradable component rose 1.5 percent for the year to the December 2009 quarter. The most significant upward contribution came from the purchase of second-hand motor cars. 4
- 5. In the December 2009 quarter, the trimmed mean measures, which exclude extreme price increases and decreases, recorded quarterly movements ranging from no change to 0.1 percent. This indicates that underlying price change for the quarter was quite flat. The annual trimmed mean measures recorded annual increases of between 2.2 percent and 2.4 percent, which are higher than the 2.0 percent increase in the all groups CPI. 5
- 6. Food Prices for the food group decreased 2.4 percent in the December 2009 quarter, following rises of 1.7 percent and 0.9 percent in the September and June 2009 quarters, respectively. Although food prices fell in the latest quarter, prices are up 1.4 percent in the year to the December 2009 quarter and are 10.9 percent higher than two years ago. If food prices had remained constant from the September 2009 quarter, the CPI would have increased by 0.3 percent in the December 2009 quarter. The most significant downward contribution came from lower prices for vegetables (down 17.6 percent) which accounted for well over half of the decrease in food prices. Lower vegetable prices were largely driven by lettuce (down 63.5 percent) and tomatoes (down 32.3 percent). Vegetable prices fell strongly from their winter peak in July that was higher than usual, following unusually cold weather in May. Other significant contributions were from the meat, poultry, and fish (down 2.5 percent) and grocery food (down 1.0 percent) subgroups. These are the largest quarterly falls in meat, poultry, and fish prices since a 2.8 percent fall in the March 1995 quarter, and in grocery food prices since the series began in the June 1999 quarter. The food group increased 1.4 percent from the December 2008 quarter to the December 2009 quarter. This is the lowest annual increase in the food group since a 1.1 percent increase for the year to the June 2005 quarter. Four of the food subgroups increased in the year to the December 2009 quarter, with the most significant contributions coming from higher prices for the non-alcoholic beverages (up 7.7 percent), restaurant meals and ready-to-eat food (up 2.9 percent), and grocery food (up 1.6 percent) subgroups. The only subgroup to decrease in the year to the December 2009 quarter was fruit and vegetables (down 5.2 percent). The most significant individual upward contribution to the annual movement came from soft drinks (up 9.9 percent). The latest annual increase in food prices of 1.4 percent was influenced by a number of cases of food manufacturers reducing the size of their products. These size reductions are treated as price increases in the CPI. 6
- 7. Transport Transport group prices increased 1.5 percent in the December 2009 quarter, following increases of 3.1 percent and 0.6 percent in the September and June 2009 quarters, respectively. The most significant individual upward contributions came from higher prices for international air transport (up 13.9 percent) and the purchase of second-hand motor cars (up 1.6 percent). The increase for international air transport is the largest since the series began in the March 1981 quarter. Prices usually rise in December quarters, although this quarter's increase was larger than usual. The index recorded a 28-year low in the June 2009 quarter. The transport group increased 3.7 percent from the December 2008 quarter to the December 2009 quarter, ending three consecutive annual decreases. The most significant individual upward contributions came from higher prices for second-hand motor cars (up 13.3 percent), petrol (3.3 percent), and new motor cars (up 9.6 percent). The 13.3 percent annual increase in the price of second-hand cars is the largest rise since the year to the December 1987 quarter. Reports have indicated that one factor for the increase in the price of second-hand motor cars is a shortage of vehicles, particularly those for importation from Japan. The annual rise in petrol prices ends four consecutive annual falls since petrol prices peaked in the September 2008 quarter. 7
- 8. Other groups In the December 2009 quarter, upward movements were recorded for the following groups: clothing and footwear, housing and household utilities, recreation and culture, health, and miscellaneous goods and services. Combined, these groups contributed 2.14 index points to the overall CPI movement. The clothing and footwear group rose 1.8 percent in the December 2009 quarter. There were higher prices for summer seasonal clothing, such as t-shirts, which were about 10 percent higher than in the December 2008 quarter. Summer seasonal clothing prices are collected only in December quarters. For the year to the December 2009 quarter the clothing and footwear group rose 3.1 percent. The housing and household utilities group rose 0.2 percent in the December 2009 quarter, driven by higher prices for rentals for housing and for the purchase of new housing. A downward contribution came from lower electricity prices (down 0.3 percent), influenced by lower summer rates for some electricity retailers in the South Island. Housing and household utilities prices rose 1.6 percent for the year to the December 2009 quarter, with higher prices for rentals for housing (up 1.0 percent) and electricity (up 2.1 percent). The annual increases for rentals for housing and electricity are the lowest in seven years. The 0.4 percent increase in the recreation and culture group came from higher prices for overseas package holidays (up 9.3 percent), and domestic accommodation services (up 4.6 percent). Prices are usually higher in December quarters for overseas package holidays and domestic accommodation. The most significant downward contribution came from lower audio- visual equipment prices (down 9.0 percent). A 0.1 percent increase in miscellaneous goods and services included a fall of 6.9 percent for credit services, influenced by banks reducing dishonour fees. In the December 2009 quarter, downward movements were recorded for alcoholic beverages and tobacco (down 1.0 percent), communication (down 0.6 percent), and household contents and services (down 0.1 percent). These groups contributed -0.98 index points to the overall CPI movement. Prices for alcohol consumed off licensed premises fell 2.2 percent, influenced by significant specialling in December. The education group remained unchanged overall for the December 2009 quarter. For technical information contact: Russell Hewitt or Daniel Griffiths Wellington 04 931 4600 Email: info@stats.govt.nz Next release ... Consumers Price Index: March 2010 quarter will be released on 20 April 2010. 8
- 9. Technical notes What the consumers price index measures The consumers price index (CPI) measures the rate of price change of goods and services purchased by households. The CPI all groups index is prepared quarterly. The food group is the only commodity group of the CPI for which an index is prepared each month. For more information about the design of the CPI, follow the link from the technical notes of this release on the Statistics New Zealand website. Index series available online To access more data from the CPI series, go to Infoshare at www.stats.govt.nz/infoshare, and choose: Subject category: Economic indicators, then choose: Consumers Price Index The time series can be downloaded in Excel or comma delimited format, where percentage movements can be calculated using the following formula: ((Index number for later period minus index number for earlier period) divided by index number for earlier period) multiplied by 100. More information about Infoshare can be found on our website at www.stats.govt.nz/about- infoshare. Expression base The CPI has an expression base of the June 2006 quarter (=1000). Although the composition and relative importance of the CPI basket was reviewed in 2008, the index will continue to be published on a base of the June 2006 quarter (=1000). Additions to the CPI basket at the June 2008 quarter have resulted in the publication of two new indexes at the class level of the New Zealand Household Expenditure Classification (NZHEC). These classes are clothing accessories, and other education. Before the review, expenditure on goods and services within these two classes was allocated to other apparel, and education items, respectively. There is also one new subgroup, for other education. As the two classes and one subgroup are new, they will be expressed on a base of the June 2008 quarter (=1000). Rounding of index numbers and calculation of percentage changes Published index numbers are rounded to the nearest index point for all periods following the expression base. The rounding of index numbers takes place as the final step before dissemination. That is, the CPI structure is calculated, class to subgroup, subgroup to group, and groups to all groups, and then after that, rounding of index numbers occurs at each level. 9
- 10. Percentage changes are published to one decimal place and are calculated from index numbers rounded to the nearest index point. For comparisons that cross the expression base, rounded index numbers (for the later period) should be compared to unrounded index numbers (for the earlier period). Information paper on 2008 CPI review An information paper, published on 7 October 2008, provides detailed information about the 2008 CPI review. This information paper includes: details of changes made to the basket of representative goods and services the new CPI expenditure weights details of how these weights were derived an analysis of the main changes in the weights. The information paper, Consumers Price Index – 2008 Review, is available on the Statistics NZ website. Pricing coverage Prices are obtained by price collectors from retail outlets in 15 urban areas: Whangarei, Auckland, Hamilton, Tauranga, Rotorua, Napier-Hastings, New Plymouth, Wanganui, Palmerston North, Wellington, Nelson, Christchurch, Timaru, Dunedin and Invercargill. Before 1988, 25 regions were sampled. In 1988 the number was reduced to 20, and in 1991 to 15. The territorial authorities of the 15 regional pricing centres account for about 69 percent of New Zealand's total resident population. However, the prices of some goods and services are collected by postal questionnaires. In some cases, for sampling and collection reasons, these prices are aggregated to the national level or to broad regions such as Auckland, Wellington, Canterbury, Rest of North Island and Rest of South Island. Items where movements for five broad regions are used include the purchase of second-hand cars, purchase of new housing, and rentals for housing. In these cases, price movements for the five broad regions are used for the corresponding 15 regions. Pricing frequency Prices are collected weekly, monthly, quarterly or annually, depending on the expected frequency of price changes exhibited by the good or service. Weekly surveys are conducted for fresh fruit and vegetables, and motor fuels. Monthly surveys are limited to the following commodities: food, non-food groceries, electricity, gas, tobacco, alcoholic drinks, newspapers, Internet, cellphones, rental cars, and domestic and international air travel. Some items are monitored throughout the quarter, eg telephone call charges. Mortgage interest is also surveyed monthly but has been excluded from the CPI all groups calculations following the June 1999 quarter rebase. Expenditure weights The main source of information used in the 2008 review was the 2006/07 Household Economic Survey (HES), which collected detailed information on the spending patterns of about 2,600 10
- 11. households. The survey ran from July 2006 to June 2007. The number of private households covered by the HES grew by 5.0 percent, from 1,494,200 for 2003/04 to 1,569,200 for 2006/07. However, weighting information also came from a range of other sources, including Statistics NZ surveys, government administrative data, retail transaction data and information provided by businesses. The initial weights for the year to June 2007 (the weight reference period) were 'price updated' to the June 2008 quarter (the price reference period). This updating involved expressing the underlying quantities of the weight reference period in the prices of the price reference period. The initial weights indicated that households spent $76.831 billion on goods and services covered by the CPI during the year to June 2007 (2006/07). When the goods and services acquired during 2006/07 are expressed in prices that were current at the June 2008 quarter, that spending rose to $80.982 billion (5.4 percent higher, mainly due to increased housing, transport and food prices since 2006/07). Table 9 (in the tables section of this release) compares the June 2008 quarter expenditure weights for the 11 CPI groups with the June 2006 quarter weights. Housing and household utilities, and food grew in relative importance. It shows that $22.75 of every $100 spent by households on goods and services covered by the CPI is spent on housing and household utilities, compared with $20.02 in 2006. This reflects increased spending on renting and on purchasing new housing, and higher electricity prices. Food accounts for $17.83 of every $100 spent, compared with $17.38 in 2006. The increase largely reflects an increase of 11.3 percent in food prices from the June 2006 quarter to the June 2008 quarter. Other groups have shown declines in relative importance, including transport (down from $17.24 to $16.18 of every $100 spent), with lower spending on cars contributing to the fall. However, the relative importance of petrol increased, from $5.38 to $5.47 of every $100 spent. Elementary aggregate formula Regional elementary aggregates are calculated for each of the 15 pricing centres from all prices collected for an item within that region. Since the 2006 Review of the CPI, the geometric mean, or Jevons, formula has been used to calculate the elementary aggregate indexes for items where outlet substitution is possible (eg for groceries and appliances). The Jevons formula is: In practice, Statistics NZ uses a weighted geometric mean formula, with the weights, where available, representing the relative importance of outlet types, such as department stores to appliance stores. The 'ratio of arithmetic mean prices', or Dutot, formula will continue to be used for other items where outlet substitution is not possible (eg local authority rates), where prices are subsidised and may fall to zero (eg GPs' fees), for fresh fruit and vegetables (as the first stage of aggregation is across both outlets within each region and across weeks within each month), and where it is not currently practical to adopt the Jevons formula. The Dutot formula is: 11
- 12. In practice, Statistics NZ uses a weighted arithmetic mean formula, with the weights, where available, representing the relative importance of outlet types, such as department stores, to appliance stores. The Dutot formula assumes that households purchase the same quantities at each surveyed outlet in each period. By comparison, the Jevons formula assumes that households spend the same amount at each surveyed outlet in each period. This implies that increased quantities are purchased from outlets showing lower-than-average relative price change, and decreased quantities from outlets showing higher-than-average price change. Use of the Jevons formula is recommended by the International Labour Office for goods and services where households are able to substitute towards outlets showing lower relative price change. Use of retail transaction data From the 2006 CPI Review, substantial use has been made of retail transaction data, obtained from the Nielsen Company in New Zealand and from GfK in Australia. The Nielsen Company collects details of sales of barcoded products that are scanned at checkout counters in supermarkets up and down the country. Aggregate sales information was obtained for about 400 categories, broken down by quarter, leading manufacturer, leading brand and, in some cases, variety. GfK collects similar information for a range of small and large appliances sold through most of New Zealand’s main appliance retailers and department stores. Information was obtained on the volume and value of sales of about 30 different categories, broken down by feature. For example, the information quantifies the relative importance of colour TVs with standard, LCD and plasma displays. The Nielsen Company and GfK information has been used to help: determine the expenditure weights of some goods in the CPI basket determine whether expenditure weight adjustments were required to reflect volume changes since the weight reference period and, if so, by how much select representative products to survey when price collectors visit retail outlets each month or quarter ensure that the mix of brands in the CPI price samples reflect market shares. The Nielsen Company and GfK data will also be used on an ongoing basis between the three- yearly reweights to assist with keeping product samples, brand shares and weights (below the class level of the NZHEC classification) up to date. 12
- 13. Determining the effect of a specified change in a lower-level index As the CPI and Food Price Index (FPI) have been reweighted and re-expressed in the June 2006 quarter, the method used to determine the effect that a specified change in a lower-level index would have on a higher-level index to which it contributes, can be simplified for the September 2006 and subsequent quarters. The index points effect and percentage contribution on a higher-level index of a specified percentage change in a lower-level index that contributes to the higher-level index can be determined by following these steps: 1. Adjust the lower-level index for the previous period (In-1,low ) by the specified percentage change (PCn,low ) to derive the index number for the current period: 2. Calculate the index points effect on the higher-level index of the specified change in the lower-level index: 3. Calculate the percentage change in the higher-level index that would be caused by the specified change in the lower-level index: Where: I : index n : period n, where n is the September 2008 quarter or a subsequent quarter (CPI), or the July 2008 month or a subsequent month (FPI) n-1 : (period n)-1 Jun08 : June 2008 quarter (CPI) or June 2008 month (FPI) low : lower-level index high : higher-level index W : expenditure weight, expressed as a percentage of the all groups (CPI) or group (FPI) index PC : percentage change PE : index points effect low-on-high : lower-level index on higher-level index 13
- 14. Example: The effect that a 5.0 percent increase in the petrol index (which has a weight of 5.47 percent in the CPI) from the June 2008 quarter to the September 2008 quarter would have on the all groups CPI index can be calculated as follows: 1. Increase the petrol index for the June 2008 quarter by 5.0 percent to derive the index number for the September 2008 quarter: 2. Calculate the index points effect on the all groups CPI index of the 5.0 percent increase in the petrol index: 3. Calculate the percentage change in the all groups CPI index that would be caused by a 5.0 percent change in the petrol index: Treatment of selected items Fuel discount schemes Fuel discount schemes, related to spending at supermarkets and in-store at petrol stations, were launched in late 2006. These new schemes and existing supermarket-related fuel discount schemes were incorporated into the CPI for the first time in the December 2006 quarter. Information on the volume and value of discounts attributable to private households is being used to adjust surveyed petrol and diesel pump prices. Further schemes, related to spending at other types of retail outlets, were added to the CPI in the March 2007 quarter. Method of aggregating monthly collected prices from the monthly level to the quarterly level Prices are collected monthly for the food group and a number of non-food items in the CPI, including electricity, cigarettes and tobacco, alcoholic drinks and air travel. These prices are averaged over the quarter for inclusion in the CPI. The method for calculating these averages is to obtain monthly regional average prices for the item by outlet-weighting the prices collected at different outlets within each region. The monthly regional average prices are used to calculate quarterly regional average prices by weighting 14
- 15. each monthly regional average price by the number of days in the month in which it was collected. This is called day weighting. All the regions are aggregated to obtain the New Zealand quarterly index by weighting together regional price movements from the base (ie June 2008) quarter to the current quarter, using the regional population weights. Petrol and diesel prices are collected weekly, usually on Fridays. The CPI petrol price index measures price changes of 91 octane petrol and 95/98 octane petrol. Within each CPI region, an average price per 10 litres of each fuel is calculated from the prices surveyed each week from individual service stations. Monthly regional average prices for each fuel are then calculated as the simple averages of the averages for the weeks within each month. Quarterly regional average prices for each fuel are then calculated as the day-weighted averages of the averages for the three months within the quarter. Regional price movements from the base (ie June 2008) quarter to the current quarter are then weighted by the regional population-weighted share of the national expenditure weight, to calculate the national petrol and diesel price indexes for the current quarter. Since petrol and diesel prices are collected either 12 or 13 times within each quarter, a price change that occurs after the first price collection of a quarter is reflected only partly in that quarter, with the remainder being reflected in the following quarter. This is also the case for commodities that are priced monthly, such as cigarettes and tobacco. Distribution of item-level index movements The Distribution of Item-level Index Movements table in the Commentary section of this release gives additional information on the distribution of price movements for the current quarter's CPI. The analytical statistics in the table give an indication of how widespread price changes are, and their relative magnitude when compared with previous quarters. The weighted average price increase and decrease uses unrounded index numbers for the previous and current periods to calculate item-level price movements from the previous period, and these are weighted using previous period expenditure weights. The previous period expenditure weight for an item is calculated by updating base period expenditure weights by the price change for the item from the base period to the previous period. Movements based on unrounded index numbers are used to determine whether items have increased, showed no change or decreased in price. Previous period expenditure weights are used to indicate the proportion of the expenditure weight that has increased, showed no change or decreased. Standard and non-standard series CPI series that contribute to the hierarchical structure of the overall CPI are known as standard series. For example, the clothing index, combined with the footwear index, contributes to the clothing and footwear index, which in turn contributes to the all groups index. Components of this pyramid-like structure are known as standard index series. In addition, a selection of non- standard series is published in the Hot Off The Press release tables, and additional series can be accessed free of charge from the online Infoshare database, available at www.stats.govt.nz/infoshare. Consumers price index series can be found under the following category in the Browse screen: Subject category: Economic indicators, then choose: Consumers Price Index Examples of these non-standard series include: 15
- 16. All groups CPI less food All groups CPI plus interest Interest. The CPI is published at the following levels: group, subgroup, and class – all at the national level. Availability of regional indexes Until the June 2006 quarter, indexes were published for 15 regions. These series were not considered 'fit for purpose', as price movements from national or broad-region price collection have been used in their compilation. However, in their stead, series for five broad regions are produced: Auckland, Wellington, Canterbury (encompasses Christchurch and Timaru), Rest of North Island and Rest of South Island. These series are considered to be fit for purpose and make less significant use of national pricing indicators in their compilation. The 15 region series continue to be calculated and are available only upon request. Tradable and non-tradable non-standard series The tradable and non-tradable component series that appear in table 1 allow users to decompose CPI goods and services into two components: one contains goods and services that are imported or in competition with foreign goods, either in domestic or foreign markets (tradables); and the other contains goods and services that face no foreign competition (non- tradables). Movements in the tradables component (tradable inflation) demonstrate how international price movements and exchange rates are impacting on movements in consumer prices. The non-tradables component shows how domestic demand and supply conditions are affecting consumer prices. The June 2008 quarter expenditure weight of the tradables component is 45.78 percent, compared with 46.32 percent in 2006. The June 2008 quarter weight of non-tradables is 54.22 percent, compared with 53.68 percent in 2006. The June 2008 quarter tradable/non-tradable weights at the group, subgroup and class levels of the NZHEC classification are included in table 3 of the supplementary tables with the web version of this release. An information paper on the methodology for the tradable and non-tradable series, Consumers Price Index Tradable and Non-tradable Series, is available on the Statistics NZ website. Trend measures of price-level change The CPI captures the broad pattern of price change over the long term, but over shorter horizons the trend in price change may be masked by one-off events. In particular, the CPI: can be subject to temporary influences, such as adverse climatic conditions affecting the prices of fresh fruit and vegetables is influenced by other supply disturbances, which, while they affect the cost of living, do not directly affect the underlying inflationary pressures in the economy. For example, supply disturbances for petrol or electricity can have a large impact on the CPI in the short term includes some items that are subject to seasonality, such as international air fares and rental car hire, which may induce volatile short-term price behaviour. 16
- 17. In order to provide an indication of the trend in the CPI over time, alternative statistics, sometimes known as trend measures of price-level change, are calculated in an attempt to isolate the more persistent component of general price-level changes. Several series are constructed to give a good guide to the trend in price-level change (5, 10, 15, 20, 25 and 30 percent trims), and a weighted median measure (the 50th percentile) is produced. Four other weighted percentile measures are also available (the 10th, 25th, 75th and 90th weighted percentiles), primarily to highlight the distribution of price changes within a particular time period. Where the distribution of price movements is positively skewed, the weighted median movement will tend to lie below the CPI movement. Where the distribution of price movements is negatively skewed, the weighted median movement will tend to lie above the CPI movement. For detailed information regarding the methodology and compilation of trimmed means and weighted medians, an information paper titled Trend measures of price level change is available on the Statistics NZ website. Annual trend measures spanning a reweighting period When the CPI is reweighted, as happened at the June 2002 quarter and again at the June 2006 quarter, there is a transition period during which the percentage changes used to calculate the annual trimmed mean and weighted percentile measures span the price reference period. The annual measures are calculated by directly weighting annual percentage changes, rather than by aggregating the four relevant quarterly percentage changes. As the June 2006 quarter reweight resulted in some significant relative changes in expenditure weights (such as for petrol and the purchase of new housing), Statistics NZ made two sets of annual trimmed mean and weighted percentile measures available during the transition across the June 2006 quarter reweight. The two sets of figures were based on: 'price-updated' June 2002 quarter expenditure weights 'price-backdated' June 2006 quarter expenditure weights. Two sets of figures were released for the September 2006, December 2006 and March 2007 quarters. From the June 2007 quarter onwards, only the June 2006 quarter expenditure weights will be used. Statistics NZ considers that the transition across the June 2006 quarter reweight has resulted in a structural break in the annual trimmed mean and weighted percentile time series. For this reason, the annual time series based on the June 2002 quarter expenditure weights, and on the June 2006 quarter expenditure weights, will be presented as separate time series, with an overlap period of three quarters. The annual series based on the June 2002 quarter expenditure weights cease at the March 2007 quarter. The annual series based on the June 2006 quarter expenditure weights commence with figures for the September 2006 quarter and will be updated on an ongoing basis. A similar approach has been taken for the transition across the June 2008 quarter reweight. An information paper titled Transition across reweights for trimmed means and weighted percentiles is available electronically on the Statistics NZ website. 17
- 18. Central and local government charges non-standard series The central and local government charges index, which appears in tables 3.01, 3.02 and 3.03, made up 9.52 percent of the CPI in the June 2008 quarter. It includes items such as Housing New Zealand and local authority rentals, land transfer registration fees, local authority rates, water supply and part of refuse disposal, electricity, prescription charges and oral contraception, general practitioner fees, vehicle relicensing fees, road user charges, driver licensing fees, postage, State and integrated schools, tertiary education, other education, cheque duty, and official passports, licences and certificates. Goods and services non-standard series The goods and services component series that appear in tables 3.01, 3.02 and 3.03 allow users to decompose CPI into its goods and services components, respectively. The goods component made up 62.55 percent, and the services component 37.45 percent in the June 2008 quarter. The goods component comprises: the food group (except restaurant meals); alcoholic beverages and tobacco group; clothing and footwear group (except clothing services); purchase of new housing, property maintenance materials, water supply, household energy, household contents and services group (except repair and hire of household appliances, hire of major tools and equipment, and other household services); medical products, appliances and equipment; dentures; purchase of vehicles, vehicle parts and accessories; petrol, other vehicle fuels and lubricants; telecommunication equipment; recreation and culture group (except recreational and cultural services, accommodation services and package holidays); and the miscellaneous goods and services group (except hairdressing and personal grooming services, jewellery and watch repair, insurance, credit services and other miscellaneous services). The services component comprises all items not in the goods component. Average retail prices in the CPI Included in this Hot Off The Press is a selection of average retail prices for the current and previous quarter. The weighted average prices are calculated by applying index movements to weighted average prices for the June 2006 quarter CPI, with the exception of printer paper where prices were first collected in the June 2008 quarter. They are not statistically accurate measures of average transaction price levels, but do provide a reliable indicator of percentage changes in prices. As part of the CPI review, the selection of items appearing in the tables has been reviewed, and the items have been grouped under their corresponding group headings. With the adoption of the Jevons elementary aggregate formula as part of the 2006 review, the average prices in these tables are calculated differently for some items. For some items, a weighted arithmetic mean price is calculated for each of the 15 pricing centres. The weights reflect the relative importance of sampled outlets. These regional arithmetic mean prices are then weighted by the population weights assigned to pricing centres (see table 6) to calculate a national weighted arithmetic mean price. For other items, a weighted geometric mean price is calculated for each of the pricing centres. The weights reflect the relative importance of sampled outlets. These regional geometric mean prices are then weighted by the pricing centre population weights to calculate a national mean price using a weighted arithmetic mean formula. For any given set of prices, a geometric mean price is less than or equal to an arithmetic mean price. This means that the June 2006 quarter average prices for items where the Jevons formula was adopted will in many cases be lower than those that appeared in the June 2006 quarter CPI 18
- 19. Hot Off The Press. Other factors that will cause the quarterly average prices to differ from ones published prior to the June 2006 quarter include: the sample of retail outlets has been updated the relative importance of sampled outlet types (eg department stores and appliance stores) has been updated the mix of surveyed brands, varieties and sizes has been updated the reference size in the 'unit' column of the tables has changed for some items. Detailed contribution information tables Tables 8.01 and 8.02 include supplementary analytical information for group, subgroup and class contributions to the overall change in the all groups CPI. The contribution information is given as index points, percentage points and percentage contributions from the previous quarter and from the same quarter of the previous year. These tables have been included to provide a broader perspective of the categories contributing to the movement in the all groups CPI. In cases where there is only one class within a subgroup, the class is omitted to avoid unnecessary duplication. The index points, percentage points and percentage contribution information contained within tables 8.01 and 8.02 is calculated from unrounded index numbers. Percentage changes have been calculated from index numbers rounded to the nearest index point (see 'Rounding of index numbers', above). As such, the sum of each of the group, subgroup or class percentage point contributions may differ from the overall percentage change in the CPI all groups. Index points contribution measures the contribution of each group, subgroup and class to the overall quarterly and annual change in index points in the all groups CPI. Percentage point contribution measures the contribution of each group, subgroup and class to the overall quarterly and annual percentage change in the all groups CPI. For any particular level of the CPI classification, such as the group level, percentage points contribution add to the overall percentage change in the all groups CPI. Percentage contribution measures the relative contribution of each group, subgroup and class to the overall quarterly and annual index points (or percentage) change in the all groups CPI. For any particular level of the CPI classification, such as the group level, percentage contributions add to 100 percent. While the contribution information is given to different decimal places for index points effect, percentage point contribution, and percentage contribution, all three measures have a similar level of accuracy. 19
- 20. Calculating scenarios for holding prices constant One analysis often contained within the commentary of this release is an examination of hypothetical quarterly and annual percentage changes in the all groups CPI, or tradable or non- tradable components, if prices for a particular class or item under consideration had remained unchanged. These scenarios are constructed by removing the index points contribution of the class or item under consideration from the CPI all groups index number. This assumes that the item remains in the basket of goods and services, but its price remained unchanged over the period of comparison. As such analyses use unrounded index numbers, the final step is to round the new hypothetical CPI all groups index number to the nearest index point before calculating percentage changes. These scenarios can be calculated using information contained within tables 8.01 and 8.02. This can best be done by subtracting the percentage point contribution of a class from the total CPI all groups percentage change (calculated from unrounded index numbers). Note that this is approximating the method used above and results may differ slightly to those contained within the commentary of this release, due to the final step of rounding the new hypothetical index numbers to the nearest index point. Note that the analysis of holding prices constants differs from an analysis that excludes the class or item from the basket. International comparisons of consumer price indexes To provide a better basis for international comparisons, the Seventeenth International Conference of Labour Statisticians adopted a resolution that called for countries to "if possible, compile and provide for dissemination to the international community an index that excludes housing and financial services" in addition to the all items index. Table 4 presents the CPI less housing and household utilities group, and credit services class series. Data for other international statistics offices is calculated by the Australian Bureau of Statistics from information supplied by the source countries. Treatment of fresh fruit and fresh vegetables – removal of seasonal adjustment Prior to the June 2006 quarter, fresh fruit and fresh vegetable items that exhibited a seasonal pattern were adjusted to remove the effect of normal seasonal change. This treatment was used to reduce the influence of normal seasonal price fluctuations. However, the treatment did not completely eliminate the effects of seasonal fluctuations if shifts in seasonal patterns occurred. From the June 2006 quarter onwards, the CPI incorporates seasonally unadjusted prices for fresh fruit and fresh vegetables. This is in line with a recommendation made by the 2004 CPI Revision Advisory Committee. 20
- 21. The ongoing, fully unadjusted CPI is linked at the June 2006 quarter to the previously published CPI, which is partly seasonally adjusted. As such, annual movements calculated over the annual period encompassing the June 2006 quarter will be based on fully unadjusted index numbers for the latest quarter, compared with partly adjusted index numbers for the same quarter of the previous year. However, analytical time series provided annual movements on a fully unadjusted basis during the year-long transition of the official CPI, during which annual movements are based on fully unadjusted index numbers for the latest quarter, compared with partly adjusted index numbers for the same quarter of the previous year. More information For more information, follow the link from the Technical notes of this release on the Statistics New Zealand website. Copyright Information obtained from Statistics NZ may be freely used, reproduced, or quoted unless otherwise specified. In all cases Statistics NZ must be acknowledged as the source. Liability While care has been used in processing, analysing and extracting information, Statistics NZ gives no warranty that the information supplied is free from error. Statistics NZ shall not be liable for any loss suffered through the use, directly or indirectly, of any information, product or service. Timing Timed statistical releases are delivered using postal and electronic services provided by third parties. Delivery of these releases may be delayed by circumstances outside the control of Statistics NZ. Statistics NZ accepts no responsibility for any such delays. 21
- 22. Tables The following tables are printed with this Hot Off The Press and can also be downloaded from the Statistics New Zealand website in Excel format. If you do not have access to Excel, you may use the Excel file viewer to view, print and export the contents of the file.The following tables are printed with this Hot Off The Press and can also be downloaded from the Statistics New Zealand website in Excel format. If you do not have access to Excel, you may use the Excel file viewer to view, print and export the contents of the file. 1. Consumers price index, tradables, non-tradables and all groups – index numbers and percentage changes 2.01. Consumers price index, groups and subgroups – index numbers 2.02. Consumers price index, groups and subgroups, percentage change from previous quarter 2.03. Consumers price index, groups and subgroups, percentage change from same quarter of previous year 3.01. Consumers price index, selected groupings – index numbers 3.02. Consumers price index, selected groupings, percentage change from previous quarter 3.03. Consumers price index, selected groupings, percentage change from same quarter of previous year 4. International comparisons of consumer price indexes, excluding housing and household utilities group and credit services class – index numbers and percentage change 5. Consumers price index, weighted average retail prices of selected items 6. Consumers price index, expenditure weights 7. Consumers price index, population weights 8.01. Consumers price index, groups, subgroups and classes, contribution to all groups and percentage change from previous quarter 8.02. Consumers price index, groups, subgroups and classes, contribution to all groups and percentage change from same quarter of previous year 9. Consumers price index, expenditure weights, groups, subgroups and classes 10. Consumers price index, COICOP divisions – index numbers and percentage changes 11. Consumers price index, trimmed means and all groups 12. Consumers price index, weighted percentiles and all groups 22
- 23. Consumers Price Index: December 2009 quarter Table 1 Consumers Price Index (1)(2) Tradables, non-tradables and all groups – index numbers and percentage changes Base: June 2006 quarter (=1000) Tradables(3)(4) Non-tradables(5) All groups(3) Percentage change Percentage change Percentage change From From same From From same From From same Index Index Index previous quarter of previous quarter of previous quarter of quarter previous year quarter previous year quarter previous year Series ref: CPIQ SE9NS6000 SE9NS6500 SE9A Quarter 2001 Dec 960 0.3 2.1 834 0.7 1.5 886 0.6 1.8 2002 Mar 958 -0.2 2.1 844 1.2 2.9 891 0.6 2.6 Jun 973 1.6 2.2 849 0.6 3.2 900 1.0 2.8 Sep 970 -0.3 1.4 857 1.0 3.5 904 0.5 2.6 Dec 975 0.5 1.6 865 0.9 3.8 910 0.6 2.7 2003 Mar 972 -0.3 1.5 872 0.8 3.4 913 0.4 2.5 Jun 962 -1.0 -1.1 880 0.8 3.6 913 0.0 1.5 Sep 956 -0.7 -1.5 890 1.2 3.8 918 0.5 1.5 Dec 955 -0.1 -2.0 902 1.3 4.2 924 0.7 1.6 2004 Mar 950 -0.6 -2.3 912 1.1 4.5 928 0.4 1.5 Jun 956 0.7 -0.7 920 0.9 4.7 935 0.8 2.4 Sep 956 0.0 0.0 930 1.0 4.5 941 0.6 2.5 Dec 962 0.7 0.7 940 1.1 4.3 949 0.9 2.7 2005 Mar 958 -0.5 0.8 950 1.1 4.2 953 0.4 2.8 Jun 963 0.6 0.7 961 1.1 4.4 962 0.9 2.8 Sep 974 1.1 1.9 971 1.1 4.4 973 1.1 3.4 Dec 979 0.5 1.7 980 1.0 4.3 979 0.7 3.2 2006 Mar 978 -0.1 2.1 990 1.0 4.1 985 0.6 3.3 Jun 1000 2.3 3.8 1000 1.0 4.1 1000 1.5 4.0 Sep 1003 0.3 3.0 1010 1.0 4.0 1007 0.7 3.5 Dec 990 -1.3 1.2 1018 0.8 3.8 1005 -0.2 2.6 2007 Mar 986 -0.4 0.9 1030 1.2 4.1 1010 0.5 2.5 Jun 995 0.9 -0.5 1041 1.1 4.1 1020 1.0 2.0 Sep 1000 0.5 -0.3 1047 0.6 3.7 1025 0.5 1.8 Dec 1018 1.8 2.8 1054 0.7 3.5 1037 1.2 3.2 2008 Mar 1020 0.2 3.4 1066 1.1 3.5 1044 0.7 3.4 Jun 1043 2.3 4.8 1076 0.9 3.4 1061 1.6 4.0 Sep 1063 1.9 6.3 1090 1.3 4.1 1077 1.5 5.1 Dec 1041 -2.1 2.3 1099 0.8 4.3 1072 -0.5 3.4 2009 Mar 1037 -0.4 1.7 1107 0.7 3.8 1075 0.3 3.0 Jun 1045 0.8 0.2 1112 0.5 3.3 1081 0.6 1.9 Sep 1062 1.6 -0.1 1123 1.0 3.0 1095 1.3 1.7 Dec 1057 -0.5 1.5 1124 0.1 2.3 1093 -0.2 2.0 (1) Percentage changes are calculated from index numbers that are not rounded until the June 2006 quarter. (2) Five decimal places have been retained prior to the June 2006 quarter to preserve percentage changes that were originally published on earlier expression bases. (3) From the September 2006 quarter, prices for fresh fruit and vegetables are not seasonally adjusted. They were seasonally adjusted until the June 2006 quarter. (4) Tradables are goods and services that are imported or that are in competition with foreign goods and services either in domestic or foreign markets. (5) Non-tradables are goods and services that do not face foreign competition. Published by Statistics New Zealand
- 24. Consumers Price Index: December 2009 quarter Table 2.01 Consumers Price Index Groups and subgroups – index numbers Base: June 2006 quarter (=1000) Series Quarter Group or subgroup ref: 2008 2009 CPIQ Dec Mar Jun Sep Dec Food group SE901 1171 1185 1196 1216 1187 Fruit and vegetables SE9011 1221 1216 1231 1312 1157 Meat, poultry and fish SE9012 1224 1235 1249 1261 1229 Grocery food SE9013 1176 1193 1200 1207 1195 Non-alcoholic beverages SE9014 1102 1141 1158 1184 1187 Restaurant meals and ready-to-eat food SE9015 1125 1136 1145 1154 1158 Alcoholic beverages and tobacco group SE902 1083 1103 1108 1125 1114 Alcoholic beverages SE9021 1086 1093 1101 1129 1115 Cigarettes and tobacco SE9022 1078 1124 1124 1115 1113 Clothing and footwear group SE903 1002 998 1016 1015 1033 Clothing SE9031 1010 1004 1023 1020 1042 Footwear SE9032 966 964 983 992 990 Housing and household utilities group SE904 1128 1131 1136 1144 1146 Actual rentals for housing SE9041 1070 1073 1076 1078 1081 Home ownership SE9042 1128 1128 1130 1131 1136 Property maintenance SE9043 1126 1128 1133 1128 1128 Property rates and related services SE9044 1221 1222 1219 1285 1288 Household energy SE9045 1180 1185 1204 1207 1205 Household contents and services group SE905 1017 1019 1034 1031 1030 Furniture, furnishings and floor coverings SE9051 1001 1002 1012 993 1003 Household textiles SE9052 1012 1003 1018 1008 1017 Household appliances SE9053 1017 1013 1038 1036 1042 Glassware, tableware and household utensils SE9054 1003 965 975 1013 970 Tools and equipment for house and garden SE9055 1060 1096 1134 1139 1125 Other household supplies and services SE9056 1036 1050 1050 1069 1047 Health group SE906 1030 1038 1047 1062 1068 Medical products, appliances and equipment SE9061 893 903 915 918 923 Out-patient services SE9062 1044 1053 1063 1074 1080 Hospital services SE9063 1188 1187 1190 1240 1249 Transport group SE907 1002 987 993 1024 1039 Purchase of vehicles SE9071 932 964 1004 1028 1038 Private transport supplies and services SE9072 999 993 1015 1042 1039 Passenger transport services SE9073 1129 1016 929 981 1054 Communication group SE908 983 982 989 987 981 Postal services SE9081 1112 1112 1112 1112 1153 Telecommunication equipment SE9082 573 568 565 560 533 Telecommunication services SE9083 999 999 1007 1006 1000 Recreation and culture group SE909 1018 1012 1000 1009 1013 Audio-visual and computing equipment SE9091 668 659 656 640 601 Major recreational and cultural equipment SE9092 1061 1094 1111 1114 1113 Other recreational equipment and supplies SE9093 1030 1044 1064 1073 1082 Recreational and cultural services SE9094 1064 1066 1070 1082 1088 Newspapers, books and stationery SE9095 1147 1135 1179 1205 1200 Accommodation services SE9096 1126 1148 1081 1069 1118 Package holidays SE9097 1310 1223 1012 1082 1180 Education group SE910 1015 1058 1058 1058 1058 Early childhood education SE9101 672 682 681 684 682 Primary and secondary education SE9102 1133 1188 1188 1188 1188 Tertiary and other post-school education SE9103 1050 1096 1096 1096 1096 Other education SE9104 1000 1053 1053 1053 1053 Miscellaneous goods and services group SE911 1071 1081 1092 1100 1101 Personal care SE9111 1048 1057 1072 1074 1076 Personal effects SE9113 1149 1180 1195 1232 1233 Insurance SE9114 1085 1103 1119 1125 1139 Credit services SE9115 993 999 999 999 930 Other miscellaneous services SE9116 1086 1085 1090 1103 1113 All groups SE9A 1072 1075 1081 1095 1093 Published by Statistics New Zealand
- 25. Consumers Price Index: December 2009 quarter Table 2.02 Consumers Price Index Groups and subgroups Percentage change from previous quarter Quarter Group or subgroup 2008 2009 Dec Mar Jun Sep Dec Food group 1.5 1.2 0.9 1.7 -2.4 Fruit and vegetables -5.9 -0.4 1.2 6.6 -11.8 Meat, poultry and fish 6.3 0.9 1.1 1.0 -2.5 Grocery food 2.6 1.4 0.6 0.6 -1.0 Non-alcoholic beverages 0.6 3.5 1.5 2.2 0.3 Restaurant meals and ready-to-eat food 1.2 1.0 0.8 0.8 0.3 Alcoholic beverages and tobacco group 0.4 1.8 0.5 1.5 -1.0 Alcoholic beverages 0.6 0.6 0.7 2.5 -1.2 Cigarettes and tobacco 0.0 4.3 0.0 -0.8 -0.2 Clothing and footwear group 0.9 -0.4 1.8 -0.1 1.8 Clothing 1.1 -0.6 1.9 -0.3 2.2 Footwear 0.3 -0.2 2.0 0.9 -0.2 Housing and household utilities group 0.6 0.3 0.4 0.7 0.2 Actual rentals for housing 0.4 0.3 0.3 0.2 0.3 Home ownership -0.2 0.0 0.2 0.1 0.4 Property maintenance 1.3 0.2 0.4 -0.4 0 Property rates and related services 1.0 0.1 -0.2 5.4 0.2 Household energy 1.7 0.4 1.6 0.2 -0.2 Household contents and services group 0.5 0.2 1.5 -0.3 -0.1 Furniture, furnishings and floor coverings 0.8 0.1 1.0 -1.9 1.0 Household textiles 2.8 -0.9 1.5 -1.0 0.9 Household appliances -0.3 -0.4 2.5 -0.2 0.6 Glassware, tableware and household utensils 0.7 -3.8 1.0 3.9 -4.2 Tools and equipment for house and garden 2.7 3.4 3.5 0.4 -1.2 Other household supplies and services -1.6 1.4 0.0 1.8 -2.1 Health group 0.6 0.8 0.9 1.4 0.6 Medical products, appliances and equipment 0.3 1.1 1.3 0.3 0.5 Out-patient services 0.9 0.9 0.9 1.0 0.6 Hospital services 0.1 -0.1 0.3 4.2 0.7 Transport group -7.6 -1.5 0.6 3.1 1.5 Purchase of vehicles 1.2 3.4 4.1 2.4 1.0 Private transport supplies and services -14.7 -0.6 2.2 2.7 -0.3 Passenger transport services 4.4 -10.0 -8.6 5.6 7.4 Communication group -0.4 -0.1 0.7 -0.2 -0.6 Postal services 0.0 0.0 0.0 0.0 3.7 Telecommunication equipment -7.0 -0.9 -0.5 -0.9 -4.8 Telecommunication services 0.0 0.0 0.8 -0.1 -0.6 Recreation and culture group 1.5 -0.6 -1.2 0.9 0.4 Audio-visual and computing equipment -4.0 -1.3 -0.5 -2.4 -6.1 Major recreational and cultural equipment 2.9 3.1 1.6 0.3 -0.1 Other recreational equipment and supplies 0.8 1.4 1.9 0.8 0.8 Recreational and cultural services 1.1 0.2 0.4 1.1 0.6 Newspapers, books and stationery 2.9 -1.0 3.9 2.2 -0.4 Accommodation services 5.2 2.0 -5.8 -1.1 4.6 Package holidays 7.6 -6.6 -17.3 6.9 9.1 Education group 0.1 4.2 0.0 0.0 0 Early childhood education 1.4 1.5 -0.1 0.4 -0.3 Primary and secondary education 0.0 4.9 0.0 0.0 0 Tertiary and other post-school education 0.0 4.4 0.0 0.0 0 Other education 0.0 5.3 0.0 0.0 0 Miscellaneous goods and services group 0.7 0.9 1.0 0.7 0.1 Personal care 0.2 0.9 1.4 0.2 0.2 Personal effects 0.9 2.7 1.3 3.1 0.1 Insurance 2.8 1.7 1.5 0.5 1.2 Credit services 0.3 0.6 0.0 0.0 -6.9 Other miscellaneous services -0.9 -0.1 0.5 1.2 0.9 All groups -0.5 0.3 0.6 1.3 -0.2 Published by Statistics New Zealand
- 26. Consumers Price Index: December 2009 quarter Table 2.03 Consumers Price Index Groups and subgroups Percentage change from same quarter of previous year Quarter Group or subgroup 2008 2009 Dec Mar Jun Sep Dec Food group 9.4 8.8 7.5 5.4 1.4 Fruit and vegetables 11.5 12.2 8.3 1.1 -5.2 Meat, poultry and fish 10.3 11.5 11.3 9.6 0.4 Grocery food 11.2 8.9 7.0 5.3 1.6 Non-alcoholic beverages 5.8 6.0 7.0 8.1 7.7 Restaurant meals and ready-to-eat food 6.3 6.0 4.8 3.8 2.9 Alcoholic beverages and tobacco group 2.7 3.4 4.0 4.3 2.9 Alcoholic beverages 2.4 2.8 3.9 4.5 2.7 Cigarettes and tobacco 3.4 4.3 4.3 3.4 3.2 Clothing and footwear group 0.1 0.7 1.9 2.2 3.1 Clothing 0.4 0.6 2.0 2.1 3.2 Footwear -1.1 0.5 1.8 3.0 2.5 Housing and household utilities group 4.3 3.6 2.8 2.1 1.6 Actual rentals for housing 3.0 2.1 1.7 1.1 1.0 Home ownership 3.1 2.2 1.3 0.1 0.7 Property maintenance 4.3 3.2 2.5 1.4 0.2 Property rates and related services 6.0 5.9 5.5 6.3 5.5 Household energy 7.9 6.9 5.1 4.1 2.1 Household contents and services group 0.8 1.8 3.0 1.9 1.3 Furniture, furnishings and floor coverings -0.5 0.5 1.5 0.0 0.2 Household textiles 2.5 1.2 2.3 2.4 0.5 Household appliances 1.0 1.9 3.4 1.6 2.5 Glassware, tableware and household utensils 0.0 -0.1 -0.3 1.7 -3.3 Tools and equipment for house and garden 4.0 7.7 11.2 10.4 6.1 Other household supplies and services 0.6 2.1 2.0 1.5 1.1 Health group 3.4 3.8 3.7 3.7 3.7 Medical products, appliances and equipment 1.4 2.4 3.0 3.1 3.4 Out-patient services 3.2 3.6 3.4 3.8 3.4 Hospital services 6.7 6.3 5.9 4.5 5.1 Transport group -0.3 -2.6 -6.6 -5.5 3.7 Purchase of vehicles -4.2 -1.2 3.6 11.6 11.4 Private transport supplies and services -0.1 -3.6 -9.5 -11.0 4.0 Passenger transport services 4.1 -1.0 -10.9 -9.3 -6.6 Communication group -1.1 -1.1 -0.9 0.0 -0.2 Postal services 6.0 6.0 0.0 0.0 3.7 Telecommunication equipment -18.5 -13.9 -10.9 -9.1 -7.0 Telecommunication services -0.7 -0.7 -0.3 0.7 0.1 Recreation and culture group 0.6 1.2 0.5 0.6 -0.5 Audio-visual and computing equipment -16.3 -14.3 -10.7 -8.0 -10.0 Major recreational and cultural equipment 1.0 4.0 6.0 8.1 4.9 Other recreational equipment and supplies 2.6 4.2 5.6 5.0 5.0 Recreational and cultural services 3.1 2.8 2.9 2.9 2.3 Newspapers, books and stationery 4.7 6.3 7.7 8.1 4.6 Accommodation services 4.2 3.1 -0.2 -0.1 -0.7 Package holidays 9.7 8.0 -7.0 -11.2 -9.9 Education group 4.1 4.4 4.4 4.3 4.2 Early childhood education 2.9 3.3 3.0 3.2 1.5 Primary and secondary education 5.7 4.9 4.9 4.9 4.9 Tertiary and other post-school education 3.2 4.4 4.4 4.4 4.4 Other education ... ... 5.3 5.3 5.3 Miscellaneous goods and services group 2.5 2.5 3.1 3.4 2.8 Personal care 2.6 3.0 3.8 2.7 2.7 Personal effects 5.0 6.8 7.4 8.2 7.3 Insurance 7.4 6.1 7.4 6.6 5.0 Credit services 0.7 0.7 0.9 0.9 -6.3 Other miscellaneous services -2.0 -2.2 -1.9 0.6 2.5 All groups 3.4 3.0 1.9 1.7 2.0 Symbol: … not applicable Published by Statistics New Zealand
- 27. Consumers Price Index: December 2009 quarter Table 3.01 Consumers Price Index Selected groupings – index numbers Base: June 2006 quarter (=1000) Series Quarter Selected grouping ref: 2008 2009 CPIQ Dec Mar Jun Sep Dec All groups SE9A 1072 1075 1081 1095 1093 All groups less group All groups less food group SE9NS1200 1051 1052 1057 1069 1073 All groups less alcoholic beverages and tobacco group SE9NS1210 1071 1073 1079 1092 1091 All groups less clothing and footwear group SE9NS1220 1075 1079 1084 1099 1096 All groups less housing and household utilities group SE9NS1230 1057 1060 1067 1082 1079 All groups less household contents and services group SE9NS1240 1075 1078 1084 1098 1097 All groups less health group SE9NS1250 1074 1077 1083 1096 1094 All groups less transport group SE9NS1260 1085 1092 1098 1108 1103 All groups less communication group SE9NS1270 1075 1078 1084 1098 1097 All groups less recreation and culture group SE9NS1280 1078 1082 1090 1104 1102 All groups less education group SE9NS1290 1073 1075 1082 1095 1094 All groups less miscellaneous goods and services group SE9NS1300 1072 1074 1080 1094 1092 All groups less other groupings All groups less credit services subgroup SE9NS1080 1072 1075 1082 1095 1094 All groups less central and local government charges(1) SE9NS1120 1069 1071 1077 1089 1087 All groups less purchase of new housing class SE9NS1400 1069 1072 1079 1093 1091 All groups less household energy subgroup and vehicle fuels(2) SE9NS1410 1075 1079 1084 1097 1096 All groups less vehicle fuels (2) SE9NS1420 1079 1084 1089 1102 1101 All groups less petrol class SE9NS1440 1079 1082 1087 1100 1099 All groups less food group, household energy subgroup and SE9NS1450 1052 1054 1058 1070 1075 vehicle fuels(2) Other groupings All groups – goods component(1) SE9NS1130 1061 1069 1084 1095 1086 All groups – services component(1) SE9NS1140 1090 1085 1076 1094 1105 All groups plus interest SE9NS1150 1074 1070 1069 1076 1070 Central and local government charges(1) SE9NS3270 1103 1111 1118 1149 1151 Tradables less vehicle fuels(2)(3) SE9NS6010 1053 1053 1058 1074 1070 Non-tradables less housing and household utilities group(4) SE9NS6510 1082 1094 1100 1111 1111 Non-tradables less purchase of new housing class(4) SE9NS6520 1096 1105 1111 1122 1123 (1) The composition of this grouping is further explained in the Technical notes of this release. (2) Vehicle fuels comprises the petrol class (91 octane, 95/98 octane) and diesel from within the other vehicle fuels and lubricants class. (3) Tradables are goods and services that are imported or that are in competition with foreign goods and services either in domestic or foreign markets. (4) Non-tradables are goods and services that do not face foreign competition. Published by Statistics New Zealand
- 28. Consumers Price Index: December 2009 quarter Table 3.02 Consumers Price Index Selected groupings Percentage change from previous quarter Quarter Selected grouping 2008 2009 Dec Mar Jun Sep Dec All groups -0.5 0.3 0.6 1.3 -0.2 All groups less group All groups less food group -0.9 0.1 0.5 1.1 0.4 All groups less alcoholic beverages and tobacco group -0.6 0.2 0.6 1.2 -0.1 All groups less clothing and footwear group -0.6 0.4 0.5 1.4 -0.3 All groups less housing and household utilities group -0.8 0.3 0.7 1.4 -0.3 All groups less household contents and services group -0.6 0.3 0.6 1.3 -0.1 All groups less health group -0.6 0.3 0.6 1.2 -0.2 All groups less transport group 0.8 0.6 0.5 0.9 -0.5 All groups less communication group -0.5 0.3 0.6 1.3 -0.1 All groups less recreation and culture group -0.7 0.4 0.7 1.3 -0.2 All groups less education group -0.6 0.2 0.7 1.2 -0.1 All groups less miscellaneous goods and services group -0.6 0.2 0.6 1.3 -0.2 All groups less other groupings All groups less credit services subgroup -0.6 0.3 0.7 1.2 -0.1 All groups less central and local government charges(1) -0.7 0.2 0.6 1.1 -0.2 All groups less purchase of new housing class -0.6 0.3 0.7 1.3 -0.2 All groups less household energy subgroup and vehicle fuels(2) 0.9 0.4 0.5 1.2 -0.1 All groups less vehicle fuels (2) 0.9 0.5 0.5 1.2 -0.1 All groups less petrol class 0.8 0.3 0.5 1.2 -0.1 All groups less food group, household energy subgroup and 0.8 0.2 0.4 1.1 0.5 vehicle fuels(2) Other groupings All groups – goods component(1) -1.6 0.8 1.4 1.0 -0.8 All groups – services component(1) 1.2 -0.5 -0.8 1.7 1.0 All groups plus interest -0.5 -0.4 -0.1 0.7 -0.6 Central and local government charges(1) 1.2 0.7 0.6 2.8 0.2 Tradables less vehicle fuels(2)(3) 1.2 0 0.5 1.5 -0.4 Non-tradables less housing and household utilities group(4) 1.0 1.1 0.5 1.0 0 Non-tradables less purchase of new housing class(4) 0.9 0.8 0.5 1.0 0.1 (1) The composition of this grouping is further explained in the Technical notes of this release. (2) Vehicle fuels comprises the petrol class (91 octane, 95/98 octane) and diesel from within the other vehicle fuels and lubricants class. (3) Tradables are goods and services that are imported or that are in competition with foreign goods and services either in domestic or foreign markets. (4) Non-tradables are goods and services that do not face foreign competition. Published by Statistics New Zealand
- 29. Consumers Price Index: December 2009 quarter Table 3.03 Consumers Price Index Selected groupings Percentage change from same quarter of previous year Quarter Selected grouping 2008 2009 Dec Mar Jun Sep Dec All groups 3.4 3.0 1.9 1.7 2.0 All groups less group All groups less food group 2.0 1.6 0.7 0.8 2.1 All groups less alcoholic beverages and tobacco group 3.4 2.9 1.8 1.4 1.9 All groups less clothing and footwear group 3.5 3.1 1.9 1.7 2.0 All groups less housing and household utilities group 3.0 2.6 1.6 1.5 2.1 All groups less household contents and services group 3.5 3.0 1.9 1.6 2.0 All groups less health group 3.4 2.9 1.8 1.5 1.9 All groups less transport group 3.9 3.9 3.6 3.0 1.7 All groups less communication group 3.5 3.1 2.0 1.7 2.0 All groups less recreation and culture group 3.7 3.0 2.1 1.7 2.2 All groups less education group 3.3 2.9 1.9 1.5 2.0 All groups less miscellaneous goods and services group 3.4 2.9 1.8 1.5 1.9 All groups less other groupings All groups less credit services subgroup 3.3 2.9 2.0 1.6 2.1 All groups less central and local government charges(1) 3.1 2.6 1.5 1.2 1.7 All groups less purchase of new housing class 3.4 2.9 2.0 1.7 2.1 All groups less household energy subgroup and vehicle fuels(2) 3.6 3.5 3.1 3.0 2.0 All groups less vehicle fuels (2) 3.7 3.6 3.2 3.1 2.0 All groups less petrol class 3.8 3.4 2.9 2.8 1.9 All groups less food group, household energy subgroup and 2.0 2.1 2.1 2.5 2.2 vehicle fuels(2) Other groupings All groups – goods component(1) 3.0 2.9 2.2 1.6 2.4 All groups – services component(1) 3.8 2.9 1.5 1.6 1.4 All groups plus interest 3.4 2.2 0.6 -0.3 -0.4 Central and local government charges(1) 6.5 6.3 5.4 5.4 4.4 Tradables less vehicle fuels(2)(3) 2.9 3.2 3.1 3.2 1.6 Non-tradables less housing and household utilities group(4) 4.2 4.2 3.9 3.7 2.7 Non-tradables less purchase of new housing class(4) 4.4 4.0 3.6 3.3 2.5 (1) The composition of this grouping is further explained in the Technical notes of this release. (2) Vehicle fuels comprises the petrol class (91 octane, 95/98 octane) and diesel from within the other vehicle fuels and lubricants class. (3) Tradables are goods and services that are imported or that are in competition with foreign goods and services either in domestic or foreign markets. (4) Non-tradables are goods and services that do not face foreign competition. Published by Statistics New Zealand