SlideShare une entreprise Scribd logo
1  sur  42
Télécharger pour lire hors ligne
BP p.l.c.
    Group results
    Fourth quarter and full year 2011


                                                                                                                 London 7 February 2012
                                                         FOR IMMEDIATE RELEASE

       Fourth            Third         Fourth
      quarter          quarter        quarter                                                                           Year            Year
         2010           2011(a)          2011                                                                           2011            2010
                                                  $ million
           5,567         5,043          7,685     Profit (loss) for the period(b)                                     25,700          (3,719)
           (953)           233            (79)    Inventory holding (gains) losses, net of tax                        (1,800)         (1,195)
           4,614         5,276          7,606     Replacement cost profit (loss)                                      23,900          (4,914)
           24.55         27.85          40.10     - per ordinary share (cents)                                        126.41          (26.17)
            1.47          1.67           2.41     - per ADS (dollars)                                                    7.58          (1.57)

• BP’s fourth-quarter replacement cost profit was $7,606 million, compared with $4,614 million a year ago. For the full
     year, replacement cost profit was $23,900 million compared with a loss of $4,914 million a year ago. Replacement cost
     profit or loss for the group is a non-GAAP measure. For further information see pages 4 and 17.
•    The group income statement for the fourth quarter and full year includes pre-tax credits related to the Gulf of Mexico oil
     spill of $4.1 billion and $3.7 billion respectively, reflecting the settlements reached in the fourth quarter with Anadarko
     Petroleum Company and Cameron International Corporation. The full year also reflects settlements with MOEX USA
     Corporation and Weatherford U.S., L.P. All amounts relating to the oil spill have been treated as non-operating items. For
     further information on the Gulf of Mexico oil spill and its consequences see pages 2 – 3, Note 2 on pages 21 – 26, and
     Legal proceedings on pages 34 – 42.
•    Non-operating items (including amounts relating to the Gulf of Mexico oil spill) and fair value accounting effects for the
     fourth quarter, on a post-tax basis, had a net favourable impact of $2,620 million compared with a net favourable impact
     of $250 million in the fourth quarter of 2010. For the full year, there was a net favourable impact of $2,242 million for
     2011 compared with a net unfavourable impact of $25,436 million in 2010. See pages 4, 18 and 19 for further details.
•    Finance costs and net finance income or expense relating to pensions and other post-retirement benefits were
     $261 million for the fourth quarter, compared with $346 million for the same period last year. For the full year, the
     respective amounts were $983 million for 2011 and $1,123 million for 2010.
•    The effective tax rates on replacement cost profit for the fourth quarter and full year were 30% and 33% respectively,
     compared with 34% and 32% a year ago. The reduction for the fourth quarter was due to the impact of the divestment
     programme and other factors. In 2012, we expect the effective tax rate to be in the range 34 – 36%.
•    Including the impact of the Gulf of Mexico oil spill, net cash provided by operating activities for the fourth quarter and full
     year was $5.0 billion and $22.2 billion respectively, compared with net cash used in operating activities of $0.2 billion for
     the fourth quarter of 2010 and net cash provided by operating activities of $13.6 billion for the full year of 2010. The
     amounts for the quarter and full year of 2011 included net cash outflows of $1.2 billion and $6.8 billion respectively
     relating to the Gulf of Mexico oil spill.
•    Net debt at the end of the quarter was $29.0 billion, compared with $25.9 billion a year ago. The ratio of net debt to net
     debt plus equity was 20.5%, compared with 21.2% a year ago. We intend to reduce the net debt ratio to the lower half
     of the 10 – 20% range over time. Net debt is a non-GAAP measure. See page 5 for further information.
•    Our 2011 reported reserves replacement ratio, excluding acquisitions and disposals, was 103% (details of which will be
     provided in BP Annual Report and Form 20-F 2011). This reflects both subsidiaries and equity-accounted entities. Reserves
     additions for TNK-BP include the effect of moving from life-of-licence measurement to life-of-field measurement, reflecting
     TNK-BP’s track record of successful licence renewal. Excluding this effect, our 2011 reserves replacement ratio excluding
     acquisitions and disposals would have been 83%.
•    Total capital expenditure for the fourth quarter and full year was $7.6 billion and $31.5 billion respectively. Organic capital
     expenditure(c) in the fourth quarter and full year was $6.3 billion and $19.1 billion respectively. For 2012, we expect
     organic capital expenditure to be around $22 billion. Disposal proceeds, including deposits received or repaid, were
     $(2.0) billion for the fourth quarter and $2.7 billion for the full year. These amounts include the repayment of the deposit
     of $3.5 billion relating to Pan American Energy LLC in the fourth quarter, following the termination of that disposal
     transaction (see Note 4 on page 28). As a result of the termination, our previously announced divestment programme of
     $45 billion (over the period 2010 to 2013 inclusive) is reduced to $38 billion.
•    Depreciation, depletion and amortization in 2012 is expected to be around $1.0 billion higher than in 2011.
•    The quarterly dividend expected to be paid on 30 March 2012 is 8 cents per share ($0.48 per ADS). The corresponding
     amount in sterling will be announced on 19 March 2012. A scrip dividend alternative is available, allowing shareholders
     to elect to receive their dividend in the form of new ordinary shares and ADS holders in the form of new ADSs. Details
     of the scrip dividend programme are available at www.bp.com/scrip.
     (a)   Adjusted to include BP’s share of Pan American Energy LLC’s profit. See Note 4 on pages 28 – 30.
     (b)   Profit (loss) attributable to BP shareholders.
     (c)   Organic capital expenditure excludes acquisitions and asset exchanges and, in the fourth quarter of 2011, expenditure associated
           with deepening our natural gas asset base (see page 16).

The commentaries above and following are based on replacement cost profit and should be read in conjunction with the cautionary
statement on page 11.

                                                                                                                                              1
Gulf of Mexico oil spill

Completing the response

We remain committed to meeting our responsibilities to the US federal, state and local governments and communities of the
Gulf coast following the Deepwater Horizon oil spill. During the fourth quarter, BP, working under the direction of the US
Coast Guard’s Federal On-Scene Coordinator (FOSC), and collaboratively with the individual federal and state entities,
continued to clean areas of the shoreline impacted by the oil spill. In November 2011, the FOSC approved the Shoreline
Clean-up Completion Plan. This plan describes the process whereby the various shoreline segments included in the area of
response operations can be surveyed, verified as meeting the applicable clean-up standards, and moved out of operational
activity. For those shoreline segments that needed active mechanical or manual cleaning, the majority of the active cleaning
was completed by the end of the fourth quarter of 2011. These segments will continue to be patrolled and maintained until
they meet the applicable clean-up standards such that the FOSC concludes that the operational activities are complete. It is
expected that the majority of the 4,300 miles of the Gulf coast shoreline that were surveyed will be deemed operationally
complete in 2012. Resources continue to be maintained in line with operational requirements.

The Coast Guard has indicated that if oil is discovered in a segment that has been transitioned out of operational activity, the
Coast Guard will follow long-standing response protocols established under the law and contact whoever it believes is the
responsible party or parties.

Economic restoration

To support the economic restoration of the impacted Gulf coast communities since the Deepwater Horizon oil spill occurred
in 2010, BP has paid a total of $7.8 billion to fund individuals, businesses and government entity claims and advances as well
as other payments for seafood research and testing, tourism, behavioural health and other contributions.

Trust update

During the fourth quarter, BP made contributions totalling $5.3 billion to the Deepwater Horizon Oil Spill Trust (Trust) fund,
including a $4 billion cash settlement received from Anadarko Petroleum Company (Anadarko). This brings the total Trust
contributions for 2011 to $10.1 billion, which also included the third-quarter settlements received from MOEX USA
Corporation and Weatherford U.S., L.P. The Trust was established in 2010 to satisfy legitimate individual and business claims
administered by the Gulf Coast Claims Facility (GCCF), state and local government claims resolved by BP, final judgments and
settlements and natural resource damages (NRD) and related costs.

Payments from the Trust during the fourth quarter were $700 million, bringing Trust disbursements for the year to
$3.7 billion. Fourth-quarter disbursements consisted of $526 million paid through the GCCF for individual and business claims,
$145 million for NRD assessment costs, and $29 million for state and local government claims and other resolved items. As
of 31 December 2011, the cumulative amount paid from the Trust since its inception was $6.7 billion. BP’s cumulative
contributions to the Trust amounted to $15.1 billion.

Claims update

As of 31 December 2011, a total of $7.5 billion had been paid for individual, business and government claims and advances
including payments made by BP prior to the establishment of the Trust.

Since the oil spill occurred in 2010, $6.2 billion in total has been paid to individual and business claimants, of which $5.8 billion
was paid by the GCCF and $0.4 billion by BP prior to the establishment of the Trust. More than 189,000 individual and
business claimants accepted full and final settlements, while about 33,000 have received interim payments. As at
31 December 2011, the GCCF reported that the claims submitted by 96% of phase 2(a) claimants had been reviewed.

Since the oil spill occurred, BP has paid federal, state and local government entities $1.3 billion for claims and advances. BP
has resolved over 90% of government claims filed. BP has also paid an additional $292 million for seafood research and
testing, tourism, behavioural health and other contributions.

Environmental restoration

During the fourth quarter we continued to work with scientists and trustee agencies through the NRD assessment process to
identify natural resources that may have been exposed to oil or otherwise impacted by the oil spill, and to look for evidence of
injury. To date, BP has paid over $600 million for NRD assessment efforts including $511 million paid from the Trust.


   (a)   Phase 2 refers to the second and final protocol for the resolution and finalization of claims, issued by the GCCF during the first
         quarter of 2011. It followed the ending of the emergency advance payments (phase 1) in 2010.


                                                                                                                                              2
Gulf of Mexico oil spill (continued)

Under an agreement signed with federal and state agencies in April 2011, BP voluntarily committed to provide up to $1 billion
to fund early restoration projects aimed at accelerating restoration efforts in the Gulf coast areas that were impacted by the
accident. The agreement enables work on restoration projects to begin at the earliest opportunity, before all of the studies
under the NRD assessment process are complete, and before funding is required by the Oil Pollution Act 1990 (OPA 90). On
14 December 2011, state and federal Trustees unveiled the first set of early environmental restoration projects that are
proposed for funding. The eight proposed projects are located in Alabama, Florida, Louisiana and Mississippi. Collectively, the
projects aim to restore and enhance wildlife and habitats, and provide additional access for recreational use. A 60-day public
comment period for the initial proposed projects ends on 14 February 2012 and the projects are expected to start this year.

Commitment to long-term oil spill research

In 2010, BP committed $500 million over 10 years to fund independent scientific research through the Gulf of Mexico
Research Initiative (GoMRI). The research will improve our knowledge of the Gulf ecosystem and help the industry and others
to better understand and mitigate the potential impacts of oil spills in the region and elsewhere. To date, BP has contributed
$70 million to the GoMRI.

Financial update

The group income statement includes a pre-tax credit of $4.1 billion for the fourth quarter in relation to the Deepwater
Horizon oil spill, and a pre-tax credit of $3.7 billion for the full year 2011. The amount for the fourth quarter primarily reflects
credits of $4.3 billion relating to settlements agreed in the period, partially offset by adjustments to the spill response
provision and functional expenses of the Gulf Coast Restoration Organization (GCRO). The amount for the full year reflects
credits of $5.5 billion relating to settlements, partially offset by further costs associated with the spill response, adjustments
to provisions, and an increase in the amount provided for legal fees, as well as functional expenses of the GCRO. The pre-tax
income statement charge in 2010 amounted to $40.9 billion.

As at 31 December 2011, the cumulative charges for provisions to be paid from the Trust and the associated reimbursement
asset recognized amounted to $14.5 billion. This included a $0.6 billion increase in the fourth-quarter provisioned amounts,
primarily for personal injury and death claims and claims resulting from the Vessels of Opportunity programme. A further
$5.5 billion could be provided in subsequent periods for items covered by the Trust, with no net impact on the income
statement.

The settlement payment from Anadarko was received by BP during the fourth quarter and we received Cameron’s payment
in January 2012. Both payments were subsequently paid by BP to the $20-billion Trust.

The total amounts that will be paid by BP in relation to all obligations relating to the oil spill are subject to significant
uncertainty as described further in Note 2 on pages 21 – 26.

Legal proceedings and investigations

See Gulf of Mexico oil spill on pages 34 – 39 of BP’s Annual Report and Form 20-F 2010 and Legal proceedings on
pages 34 – 42 herein for details of legal proceedings, including external investigations relating to the oil spill.


                                                                                                                                 3
Analysis of replacement cost profit (loss) before interest and tax and
                    reconciliation to profit (loss) for the period

  Fourth             Third           Fourth
 quarter           quarter          quarter                                                                                 Year             Year
    2010            2011(a)            2011                                                                                 2011             2010
                                                $ million
       8,000          7,687            7,551    Exploration and Production                                               30,500            30,886
         964          1,493              564    Refining and Marketing                                                     5,474             5,555
        (550)         (330)          (1,072)    Other businesses and corporate                                           (2,478)            (1,516)
      (1,010)         (541)            4,108    Gulf of Mexico oil spill response(b)                                       3,800          (40,858)
          56           (213)             127    Consolidation adjustment                                                   (113)               447
       7,460          8,096          11,278     RC profit (loss) before interest and tax(c)                              37,183             (5,486)

                                                Finance costs and net finance income or
                                                 expense relating to pensions and other
        (346)          (234)           (261)     post-retirement benefits                                                  (983)           (1,123)
      (2,404)        (2,409)         (3,322)    Taxation on a replacement cost basis                                    (11,903)            2,090
         (96)          (177)            (89)    Minority interest                                                          (397)             (395)
                                                Replacement cost profit (loss) attributable
       4,614          5,276           7,606      to BP shareholders                                                       23,900           (4,914)
       1,445           (372)             101    Inventory holding gains (losses)                                           2,634             1,784
                                                Taxation (charge) credit on inventory holding
        (492)           139             (22)     gains and losses                                                           (834)            (589)
                                                Profit (loss) for the period attributable
       5,567          5,043           7,685      to BP shareholders                                                       25,700           (3,719)

(a)    Exploration and Production result adjusted to include BP’s share of Pan American Energy LLC’s profit. See Note 4 on pages 28 – 30.
(b)    See Note 2 on pages 21 – 26 for further information on the accounting for the Gulf of Mexico oil spill response.
(c)    Replacement cost profit or loss reflects the replacement cost of supplies. Replacement cost profit or loss for the group is a non-
       GAAP measure. For further information see page 17.


           Total of non-operating items and fair value accounting effects(a)(b)

  Fourth             Third           Fourth
 quarter           quarter          quarter                                                                                 Year             Year
    2010             2011              2011                                                                                 2011             2010
                                                $ million
       1,344            461              640    Exploration and Production                                                 1,141            3,196
         220           (173)           (195)    Refining and Marketing                                                     (539)              672
          (67)            76           (454)    Other businesses and corporate                                             (822)             (200)
      (1,010)          (541)           4,108    Gulf of Mexico oil spill response                                          3,800          (40,858)
         487           (177)           4,099    Total before interest and taxation                                         3,580          (37,190)
          (30)           (14)            (13)   Finance costs(c)                                                             (58)             (77)
         457           (191)           4,086    Total before taxation                                                      3,522          (37,267)
        (207)              4         (1,466)    Taxation credit (charge)(d)                                              (1,280)           11,831
         250           (187)           2,620    Total after taxation for the period                                        2,242          (25,436)

(a)    An analysis of non-operating items by type is provided on page 18 and an analysis by region is shown on pages 7, 9 and 10.
(b)    Information on fair value accounting effects is non-GAAP. For further details, see page 19.
(c)    Finance costs relate to the Gulf of Mexico oil spill. See Note 2 on pages 21 – 26 for further details.
(d)    Tax is calculated by applying discrete quarterly effective tax rates (excluding the impact of the Gulf of Mexico oil spill and, for the first
       quarter 2011, the impact of a $683-million one-off deferred tax adjustment in respect of an increase in the supplementary charge on
       UK oil and gas production) on group profit or loss. However, the US statutory tax rate has been used for recoveries relating to the
       Gulf of Mexico oil spill and expenditures that qualify for tax relief.


                                                                                                                                                 4
Per share amounts

     Fourth            Third         Fourth
    quarter          quarter        quarter                                                                        Year     Year
       2010           2011(a)          2011                                                                        2011     2010
                                                Per ordinary share (cents)(b)
          29.62         26.62          40.51    Profit (loss) for the period                                     135.93    (19.81)
          24.55         27.85          40.10    RC profit (loss) for the period                                  126.41    (26.17)
                                                Per ADS (dollars)(b)
           1.78          1.60           2.43    Profit (loss) for the period                                        8.16    (1.19)
           1.47          1.67           2.41    RC profit (loss) for the period                                     7.58    (1.57)

   (a)    Adjusted to include BP’s share of Pan American Energy LLC’s profit. See Note 4 on pages 28 – 30.
   (b)    See Note 7 on page 31 for details of the calculation of earnings per share.


                                Net debt ratio – net debt: net debt + equity

     Fourth            Third         Fourth
    quarter          quarter        quarter                                                                        Year     Year
       2010           2011(a)          2011                                                                        2011     2010
                                                $ million
         45,336       45,283         44,213     Gross debt                                                       44,213    45,336
                                                Less: fair value asset of hedges
            916        1,454          1,133      related to finance debt                                          1,133       916
         44,420       43,829         43,080                                                                      43,080    44,420
         18,556       17,997         14,067     Cash and cash equivalents                                        14,067    18,556
         25,864       25,832         29,013     Net debt                                                         29,013    25,864
         95,891      110,659        112,482     Equity                                                          112,482    95,891
         21.2%        18.9%          20.5%      Net debt ratio                                                   20.5%     21.2%

   (a)    Adjusted following the termination of the Pan American Energy LLC sale agreement. See Note 4 on pages 28 – 30.

See Note 8 on page 32 for further details on finance debt.

Net debt and net debt ratio are non-GAAP measures. Net debt includes the fair value of associated derivative financial
instruments that are used to hedge foreign exchange and interest rate risks relating to finance debt, for which hedge
accounting is claimed. The derivatives are reported on the balance sheet within the headings ‘Derivative financial
instruments’. We believe that net debt and net debt ratio provide useful information to investors. Net debt enables investors
to see the economic effect of gross debt, related hedges and cash and cash equivalents in total. The net debt ratio enables
investors to see how significant net debt is relative to equity from shareholders.


                                                              Dividends

Dividends payable

BP today announced a dividend of 8 cents per ordinary share expected to be paid in March. The corresponding amount in
sterling will be announced on 19 March 2012, calculated based on the average of the market exchange rates for the four
dealing days commencing on 13 March 2012. Holders of American Depositary Shares (ADSs) will receive $0.48 per ADS.
The dividend is due to be paid on 30 March 2012 to shareholders and ADS holders on the register on 17 February 2012. A
scrip dividend alternative is available, allowing shareholders to elect to receive their dividend in the form of new ordinary
shares and ADS holders in the form of new ADSs. Details of the fourth-quarter dividend and timetable are available at
www.bp.com/dividends and details of the scrip dividend programme are available at www.bp.com/scrip.

Dividends paid

     Fourth            Third         Fourth
    quarter          quarter        quarter                                                                        Year     Year
       2010            2011            2011                                                                        2011     2010
                                                Dividends paid per ordinary share
              –        7.000          7.000       cents                                                          28.000    14.000
              –       4.3160         4.4694       pence                                                         17.4035     8.679
              –        42.00          42.00     Dividends paid per ADS (cents)                                   168.00     84.00
                                                Scrip dividends
              –          14.8           11.4    Number of shares issued (millions)                                 165.6        –
              –           101             83    Value of shares issued ($ million)                                 1,219        –


                                                                                                                                5
Exploration and Production

     Fourth           Third         Fourth
    quarter         quarter        quarter                                                                   Year         Year
       2010          2011(a)          2011                                                                   2011         2010
                                               $ million
         8,114         7,691          7,559    Profit before interest and tax                               30,632      30,970
         (114)            (4)            (8)   Inventory holding (gains) losses                              (132)         (84)
         8,000         7,687          7,551    Replacement cost profit before interest and tax              30,500      30,886
                                               By region
         1,522         1,432          2,158    US                                                            6,196       9,684
         6,478         6,255          5,393    Non-US                                                       24,304      21,202
         8,000         7,687          7,551                                                                 30,500      30,886

   (a)   Adjusted to include BP’s share of Pan American Energy LLC’s profit. See Note 4 on pages 28 – 30.

The replacement cost profit before interest and tax for the fourth quarter and full year was $7,551 million and $30,500 million
respectively, compared with $8,000 million and $30,886 million respectively for the same periods in 2010.

The fourth quarter benefited from net non-operating gains of $584 million, mainly comprising gains on disposals partly offset
by a charge associated with the termination of the agreement to sell our 60% interest in Pan American Energy LLC to Bridas
Corporation (Bridas). (See Note 4 on page 28 for further information on the termination of this agreement.) In the same period
a year ago, there were net non-operating gains of $1,356 million. The full year included net non-operating gains of
$1,130 million, compared with $3,199 million in 2010, with gains on disposals being partly offset by impairments, the fourth-
quarter Bridas charge and other non-operating items. In the fourth quarter and full year, fair value accounting effects had
favourable impacts of $56 million and $11 million respectively, compared with unfavourable impacts of $12 million and
$3 million in the same periods of last year.

The primary additional factors impacting replacement cost profit for both the fourth quarter and full year, compared with the
same periods a year ago, were higher realizations partially offset by lower production volumes (including in higher margin
areas). The fourth quarter was also impacted by increased depreciation (due to increased decommissioning provisions and
higher activity in Iraq), higher costs (including ongoing maintenance and integrity-related spend), and rig standby costs in the
Gulf of Mexico. There was a loss in the fourth quarter in gas marketing and trading, but the contribution for the full year
improved compared with 2010. The full-year result was also impacted by rig standby costs in the Gulf of Mexico, higher costs
related to turnarounds, certain one-off costs, and higher exploration write-offs. Earnings from equity-accounted entities,
including TNK-BP, were higher in both the fourth quarter and full year compared with the same periods in 2010, primarily due
to higher realizations.

Production for the quarter was 3,487mboe/d, 5% lower than the fourth quarter of 2010. After adjusting for the effect of
acquisitions and divestments and entitlement impacts in our production-sharing agreements (PSAs), the decrease was 4%.
This primarily reflects lower Gulf of Mexico production, as a result of ongoing base decline owing to the impacts of the drilling
moratorium. This was partly offset by the ramp-up of production at Greater Plutonio and the start-up of Pazflor in Angola. For
the full year production was 3,454mboe/d, 10% lower than 2010. After adjusting for the effect of acquisitions and
divestments and PSA entitlement impacts, the full-year production was 7% lower than a year ago. In addition to the factors
noted above, production for the full year was impacted by higher turnaround and maintenance activity. For 2012, production
excluding TNK-BP is expected to be broadly flat compared with 2011, after adjusting for divestments and at an oil price of
$100 per barrel.

We continue to make strategic progress. In October, BP Egypt announced the Salmon gas discovery in the North El Burg
Offshore Concession, Nile Delta. In Vietnam, we completed the disposal of Block 06.1 and pipeline assets to TNK-BP.

In November, we announced that a Notification of Discovery for the Itaipu-2 pre-salt appraisal well, located in block BM-C-32
in the deepwater sector of the Campos Basin, has been lodged with the Brazilian National Petroleum Agency. Also in
November, we confirmed that we have been awarded a 100% interest in the offshore West Aru I and II PSAs in the Arafura
Sea, Indonesia, approximately 500 kilometres southwest of the BP-operated North Arafura PSA.

In December, we announced that we have agreed to sell our Canadian natural gas liquids (NGL) business to Plains Midstream
Canada ULC. Completion of the transaction is subject to closing conditions including the receipt of all necessary
governmental and regulatory approvals. We also completed the sale of our interests in the Pompano and Mica fields in the
deepwater Gulf of Mexico, to Stone Energy Offshore LLC, for $204 million. Additionally, BP completed the sale of its
interests in the Wytch Farm, Wareham, Beacon and Kimmeridge fields to Perenco UK Ltd.

Also in December, we were awarded four more deepwater exploration and production blocks offshore Angola. These give BP
a leading position in Angola, with interests in nine blocks covering more than 30,000 square kilometres. We also deepened
our position in US natural gas.

During the quarter we resumed drilling activity in the Gulf of Mexico and, at the end of 2011, five rigs were operational at
BP-operated leases. In December, we reached our final investment decision to proceed with phase 2 of the Mad Dog field
development. This is the first such investment decision we have made on a BP-operated stand-alone project in the Gulf of
Mexico in a decade.

                                                                                                                               6
Exploration and Production

     Fourth            Third          Fourth
    quarter          quarter         quarter                                                                               Year             Year
       2010            2011             2011                                                                               2011             2010
                                                 $ million
                                                 Non-operating items
          (273)           (32)            831    US                                                                          73            1,190
         1,629            532           (247)    Non-US                                                                   1,057            2,009
         1,356            500             584                                                                             1,130            3,199

                                                 Fair value accounting effects(a)
             9              (9)            17    US                                                                          15              141
           (21)           (30)             39    Non-US                                                                      (4)            (144)
           (12)           (39)             56                                                                                11               (3)

                                                 Exploration expense
          254              52             80     US(b)                                                                    1,065              465
          177              48            262     Non-US(c)                                                                  455              378
          431             100            342                                                                              1,520              843

                                                 Production (net of royalties)(d)
                                                 Liquids (mb/d)(e)
           567           388             439     US                                                                         453              594
           155           120             145     Europe                                                                     145              177
           858           872             874     Russia(f)                                                                  865              856
           686           695             699     Rest of World(f)                                                           694              747
         2,266         2,075           2,157                                                                              2,157            2,374

                                                 Natural gas (mmcf/d)
         2,085         1,819           1,817     US                                                                       1,843            2,184
           390           214             497     Europe                                                                     368              487
           698           658             744     Russia(f)                                                                  699              640
         4,987         4,522           4,656     Rest of World(f)                                                         4,608            5,090
         8,160         7,213           7,714                                                                              7,518            8,401

                                                 Total hydrocarbons (mboe/d)(g)
           927           702             752     US                                                                         771              970
           222           157             230     Europe                                                                     209              261
           978           985           1,002     Russia(f)                                                                  985              967
         1,546         1,475           1,503     Rest of World(f)                                                         1,489            1,624
         3,673         3,319           3,487                                                                              3,454            3,822

                                                 Average realizations(h)
         78.80        103.53          101.84     Total liquids ($/bbl)                                                  101.29             73.41
          3.98          4.95            5.07     Natural gas ($/mcf)                                                      4.69              3.97
         50.41         63.74           63.49     Total hydrocarbons ($/boe)                                              62.31             47.90

   (a)   These effects represent the favourable (unfavourable) impact relative to management’s measure of performance. Further
         information on fair value accounting effects is provided on page 19.
   (b)   Full year 2011 includes $395 million classified within the ‘other’ category of non-operating items. Full year 2011 also includes a net
         charge of $14 million related to decommissioning of idle infrastructure, as required by BOEMRE’s Notice to Lessees No. 2010-GO5
         issued in October 2010. This net charge reflects an expense of $93 million in the first quarter, partially offset by a net credit in the
         subsequent periods due to amendments to previous estimates.
   (c)   Full year 2011 includes $44 million classified within the ‘other’ category of non-operating items.
   (d)   Includes BP’s share of production of equity-accounted entities.
   (e)   Crude oil and natural gas liquids.
   (f)   A minor amendment has been made in the third quarter 2011.
   (g)   Natural gas is converted to oil equivalent at 5.8 billion cubic feet = 1 million barrels.
   (h)   Based on sales of consolidated subsidiaries only - this excludes equity-accounted entities.

Because of rounding, some totals may not agree exactly with the sum of their component parts.


                                                                                                                                                7
Refining and Marketing

     Fourth         Third        Fourth
    quarter       quarter       quarter                                                                    Year           Year
       2010         2011           2011                                                                    2011           2010
                                           $ million
      2,282         1,117           657    Profit before interest and tax                                  7,961         7,239
     (1,318)          376           (93)   Inventory holding (gains) losses                              (2,487)        (1,684)
        964         1,493           564    Replacement cost profit before interest and tax                 5,474         5,555

                                           By region
         21           761            31    US                                                              1,415            935
        943           732           533    Non-US                                                          4,059          4,620
        964         1,493           564                                                                    5,474          5,555

The replacement cost profit before interest and tax for the fourth quarter and full year was $564 million and $5,474 million
respectively, compared with $964 million and $5,555 million for the same periods last year.

The fourth-quarter and full-year results include net non-operating charges of $140 million, and $602 million respectively,
principally relating to impairment charges associated with our divestment programme, partially offset by gains on disposal. In
2010, there were net non-operating gains of $86 million and $630 million for the fourth quarter and full year respectively. Fair
value accounting effects had unfavourable impacts of $55 million for the fourth quarter and favourable impacts of $63 million
for the full year. The corresponding periods in 2010 reflected favourable fair value accounting effects of $134 million and
$42 million respectively.

The fourth quarter saw continued strong operations with our refinery utilization remaining well above the industry average.
Compared with the same period last year, our result benefited from an improved contribution from supply and trading relative
to the fourth-quarter loss in 2010 and our ability to access WTI-priced crude grades in the US, although the differentials for
these grades narrowed compared with the third-quarter highs. These factors were offset, however, by a reduced refining
margin environment, lower petrochemicals margins and foreign exchange impacts.

For the full year, Refining and Marketing reported record earnings after adjusting for non-operating items and fair value
accounting effects. Strong refinery operations enabled us to capture the benefits available in 2011 from BP’s location
advantage in accessing WTI-based crude grades. Compared with 2010, the result also benefited from a higher refining margin
environment and a stronger supply and trading contribution. These benefits were partly offset by a significantly higher level of
turnarounds in 2011 than 2010, negative impacts from increased relative sweet crude prices in Europe and Australia, and the
weather-related power outages in the second quarter.

In the fuels business, financial performance in both the fourth quarter and full year was impacted by the factors noted above.
Operational performance was strong, with Solomon refining availability at 95.3% for the fourth quarter and throughputs more
than 30mb/d higher than the same period last year. Refining margins however declined in the fourth quarter, averaging
$0.88/bbl lower than the same period last year. The US fuels environment was particularly impacted in the fourth quarter as
refining margins reduced by more than 40% from the previous quarter and the differentials between WTI and Brent crude
reduced significantly from their third-quarter highs. In December, Air BP announced the purchase of aviation fuels assets at
seven Brazilian airports enabling the direct marketing of fuel to commercial airlines in these locations. The acquisition from
Shell Brasil and Cosan Industria e Commercio, for consideration of approximately $100 million, is expected to be completed in
the first quarter of 2012 subject to regulatory approvals. In addition BP intends to sell its bulk and bottled LPG marketing
businesses in nine countries.

Performance in our lubricants business in both the fourth quarter and full year was impacted by an increasingly difficult
marketing environment characterized by significant base oil price increases and weaker demand. These impacts were partly
offset by supply chain efficiencies, and the strength of our products and brands which has allowed the increased cost of
goods to be largely recovered in the market.

In our petrochemicals business, compared with 2010, the fourth-quarter result was impacted by weakening market conditions
as additional Asian capacity has come onstream at a time of weaker demand. The full-year result benefited from the strength
in aromatics margins and volumes in the first half of the year but this benefit was more than offset by weakening market
conditions, as the year progressed. In November, BP and IndianOil signed a Memorandum of Understanding to explore the
potential for establishing a 50:50 joint venture to invest in a 1-million tonne-per-annum acetic acid plant in Gujarat, with a
targeted start-up date in 2015. The proposed plant would employ BP's latest Cativa® catalyst and technology, while the
associated gasification facilities would utilize petroleum coke feedstock from IndianOil. BP also received local government
approval for a 1.3-million tonne-per-annum PTA plant in Zhuhai, China in the fourth quarter and is now seeking final central
government approval.

Looking ahead, in line with the usual seasonal trend, we expect refining margins in the first quarter to be stronger than in the
fourth quarter. We expect the differential between WTI and Brent crude to return eventually to lower levels as additional US
pipeline capacity is brought online. The level of BP’s refinery turnaround activity is expected to be broadly similar in 2012
compared with 2011. We also expect the marketing environment in fuels, lubricants and petrochemicals to remain subdued
given the outlook for global demand.

                                                                                                                               8
Refining and Marketing

  Fourth           Third          Fourth
 quarter         quarter         quarter                                                                                Year           Year
    2010           2011             2011                                                                                2011           2010
                                             $ million
                                             Non-operating items
       (12)          (184)          (123)    US                                                                        (562)            352
        98             (43)          (17)    Non-US                                                                     (40)            278
        86           (227)          (140)                                                                              (602)            630
                                             Fair value accounting effects(a)
        27              18           (41)    US                                                                             –             19
       107              36           (14)    Non-US                                                                        63             23
       134              54           (55)                                                                                  63             42

                                             RC profit before interest and tax(b)(c)
       402            994            194     Fuels                                                                     3,003          2,628
       319            263            274     Lubricants                                                                1,350          1,357
       243            236             96     Petrochemicals                                                            1,121          1,570
       964          1,493            564                                                                               5,474          5,555
                                             Non-operating items and fair value
                                             accounting effects(a)
       258           (190)          (206)    Fuels                                                                     (640)            381
       (20)            16              11    Lubricants                                                                  100            (47)
       (18)             1               –    Petrochemicals                                                                1            338
       220           (173)          (195)                                                                              (539)            672

                                             Refining Marker Margin (RMM) ($/bbl)(d)
       9.98         12.51            9.10    BP Average RMM                                                            11.64          10.02
                                             Refinery throughputs (mb/d)
      1,343         1,371          1,352     US                                                                        1,277          1,350
        777           776            790     Europe                                                                      771            775
        300           283            312     Rest of World                                                               304            301
      2,420         2,430          2,454     Total throughput                                                          2,352          2,426
       94.9          95.3           95.3     Refining availability (%)(e)                                               94.8           95.0
                                             Sales volumes (mb/d)(f)
                                             Marketing sales by region
      1,415         1,411          1,409     US                                                                        1,401          1,433
      1,379         1,353          1,302     Europe                                                                    1,305          1,402
        597           592            607     Rest of World                                                               605            610
      3,391         3,356          3,318     Total marketing sales                                                     3,311          3,445
      2,485         2,358          2,515     Trading/supply sales                                                      2,465          2,482
      5,876         5,714          5,833     Total refined product sales                                               5,776          5,927
                                             Petrochemicals production (kte)
      1,046         1,127          1,001     US                                                                       4,029           4,146
        894           955            864     Europe(c)                                                                3,854           4,051
      1,780         1,504          1,715     Rest of World                                                            6,983           7,397
      3,720         3,586          3,580     Total production                                                        14,866          15,594

(a)   Fair value accounting effects represent the favourable (unfavourable) impact relative to management’s measure of performance. For
      Refining and Marketing, these arise solely in the fuels business. Further information is provided on page 19.
(b)   Segment-level overhead expenses are included in the fuels business result.
(c)   BP’s share of income from petrochemicals at our Gelsenkirchen and Mulheim sites in Germany is reported in the fuels business
      result.
(d)   The RMM is the average of regional indicator margins weighted for BP’s crude refining capacity in each region. They may not be
      representative of the margins achieved by BP in any period because of BP’s particular refinery configurations and crude and product
      slate. The quarterly regional marker margins can be found on bp.com and are updated weekly.
(e)   Refining availability represents Solomon Associates’ operational availability, which is defined as the percentage of the year that a unit
      is available for processing after subtracting the annualized time lost due to turnaround activity and all planned mechanical, process
      and regulatory maintenance downtime.
(f)   Marketing sales do not include volumes relating to crude oil.


                                                                                                                                            9
Other businesses and corporate

     Fourth           Third         Fourth
    quarter         quarter        quarter                                                                             Year            Year
       2010           2011            2011                                                                             2011            2010
                                               $ million
         (537)         (330)        (1,072)    Profit (loss) before interest and tax                                (2,463)          (1,500)
           (13)            –              –    Inventory holding (gains) losses                                        (15)             (16)
                                               Replacement cost profit (loss) before
         (550)         (330)        (1,072)     interest and tax                                                    (2,478)          (1,516)
                                               By region
         (225)         (294)          (580)    US                                                                   (1,230)            (731)
         (325)           (36)         (492)    Non-US                                                               (1,248)            (785)
         (550)         (330)        (1,072)                                                                         (2,478)          (1,516)

                                               Results include
                                               Non-operating items
          (54)         (112)          (310)    US                                                                     (433)            (238)
          (13)          188           (144)    Non-US                                                                 (389)              38
          (67)           76           (454)                                                                           (822)            (200)

Other businesses and corporate comprises the Alternative Energy business, Shipping, Treasury (which includes interest
income on the group's cash and cash equivalents), and corporate activities worldwide. It also included the group’s aluminium
business until its disposal during the third quarter of 2011.

The replacement cost loss before interest and tax for the fourth quarter and full year was $1,072 million and $2,478 million
respectively, compared with losses of $550 million and $1,516 million a year ago. The fourth quarter included a net non-
operating charge of $454 million. A year ago, there was a net charge of $67 million. For the full year the net non-operating
charge was $822 million, compared with a net charge of $200 million a year ago.

In Alternative Energy, net wind generation capacity(a) at the end of the fourth quarter was 1,048MW (1,763MW gross),
compared with 774MW (1,362MW gross) at the end of the same period a year ago.

On 22 November, BP increased its share of Tropical BioEnergia S.A. to 100%, by acquiring the remaining 50% for cash
consideration of $71 million. BP now owns and operates three producing ethanol mills in Brazil, with a total crush capacity(b)
of 7.2 million tonnes per annum.

At the end of 2011, BP began winding down its remaining solar operations as it prepares to exit the solar business. BP will
take the necessary steps to transfer its obligations and assets to its affiliates or to third parties. Non-operating charges of
$306 million for the fourth quarter and $687 million for the full year have been recognized with respect to raw materials
purchase contracts.

In 2012, we expect the quarterly loss, excluding non-operating items, for Other businesses and corporate to average around
$500 million. As in previous years, this is likely to be volatile on an individual quarterly basis.

   (a)   Net wind generation capacity is the sum of the rated capacities of the assets/turbines that have entered into commercial operation,
         including BP’s share of equity-accounted entities. The gross data is the equivalent capacity on a gross-JV basis, which includes
         100% of the capacity of equity-accounted entities where BP has partial ownership. Capacity figures include 32MW in the
         Netherlands managed by our Refining and Marketing segment.
   (b)   Crush capacity represents the maximum capacity of the plant to process biofuels feedstock.


                                                                                                                                         10
Cautionary statement

Cautionary statement regarding forward-looking statements: The discussion in this results announcement contains forward-looking
statements particularly those regarding the level of organic capital expenditure in 2012; the quarterly dividend payment; the timing of the
removal from the Shoreline Clean-up Completion Plan of certain Gulf coast shoreline that was surveyed; the expected timing for the
commencement of certain BP-funded early restoration projects; the amount of charges for provisions that could be provided in
subsequent periods for items covered by the Trust with no net impact on the income statement; the expected level of production in the first
quarter of 2012; the timing of the start-up date of an acetic acid plant in Gujarat in which BP may participate via a joint venture, the
technology employed therein and the feedstock used in an associated gasification plant thereto; the level of refining margins in the first
quarter of 2012; the level of refinery turnaround activity in 2012; expectations for the marketing environment in 2012; BP’s intention, in
connection with its plans to exit the solar business, to transfer obligations and assets to its affiliates or to third parties; expectations for
the level and volatility of quarterly losses in Other businesses and corporate; BP’s plans to file a timely appeal with respect to the
Notification of Incidents of Noncompliance received on 7 December 2011; the anticipated filing of further lawsuits against BP or BP
entities by the Mexican federal government; the commencement of investigations relating to the Deepwater Horizon oil spill by US
federal agencies; the source of funding for BP’s $1-billion commitment to early restoration projects; the magnitude and timing of
remaining remediation costs related to the Gulf of Mexico oil spill; the factors that could affect the magnitude of BP’s ultimate exposure
and the cost to BP in relation to the spill and any potential mitigation resulting from BP’s partners or others involved in the spill; the
potential liabilities resulting from pending and future legal proceedings and potential investigations and civil or criminal actions that US
state and/or local governments could seek to take against BP as a result of the spill; the timing of claims and litigation outcomes and of
payment of legal costs; contributions to and payments from the trust fund and the setting aside of assets while the fund is building; the
estimated amount of legal fees in connection with the Gulf of Mexico oil spill; the timing for publication of investigation reports; the
impact of BP’s potential liabilities relating to the Gulf of Mexico oil spill on the group, including its business, results and financial
condition; the anticipated commencement of the Trial of Liability, Limitation, Exoneration, and Fault Allocation; the anticipated
commencement of the trial regarding assertions of certain air emissions and reporting violations at the Texas City refinery; the
anticipated commencement of the trial regarding allegations pertaining to the Atlantis platform; and the timing for an arbitration hearing
regarding allegations by Apache Canada Ltd in connection with the July 2010 Purchase and Sale Agreement between Apache Canada
Ltd and BP Canada Energy. By their nature, forward-looking statements involve risk and uncertainty because they relate to events and
depend on circumstances that will or may occur in the future. Actual results may differ from those expressed in such statements,
depending on a variety of factors including the timing of bringing new fields onstream; future levels of industry product supply; demand
and pricing; OPEC quota restrictions; PSA effects; operational problems; general economic conditions; political stability and economic
growth in relevant areas of the world; changes in laws and governmental regulations; regulatory or legal actions including the types of
enforcement action pursued and the nature of remedies sought; the impact on our reputation following the Gulf of Mexico oil spill;
exchange rate fluctuations; development and use of new technology; the success or otherwise of partnering; the actions of competitors,
trading partners, creditors, rating agencies and others; natural disasters and adverse weather conditions; changes in public expectations
and other changes to business conditions; wars and acts of terrorism or sabotage; and other factors discussed under “Principal risks and
uncertainties” in our Form 6-K for the period ended 30 June 2011 and under “Risk factors” in our Annual Report and Form 20-F 2010
as filed with the US Securities and Exchange Commission (SEC).


                                                                                                                                            11
Group income statement

  Fourth            Third         Fourth
 quarter          quarter        quarter                                                                                  Year           Year
    2010           2011(a)          2011                                                                                  2011           2010
                                             $ million
      79,703       95,383         93,441     Sales and other operating revenues (Note 5)                              375,517        297,107
                                             Earnings from jointly controlled entities – after
        233            300           211       interest and tax                                                          1,304          1,175
                                             Earnings from associates – after interest
       1,125        1,108          1,144       and tax                                                                  4,916          3,582
         174          151            170     Interest and other income                                                    596            681
       2,753          790          1,377     Gains on sale of businesses and fixed assets                               4,130          6,383
      83,988       97,732         96,343     Total revenues and other income                                          386,463        308,928
      58,339       73,825         71,791     Purchases                                                                285,618        216,211
                                             Production and manufacturing
       7,522         7,809         3,628       expenses(b)(c)                                                           24,145        64,615
       1,524         2,021         2,072     Production and similar taxes (Note 6)                                       8,280         5,244
       2,634         2,647         2,982     Depreciation, depletion and amortization                                   11,135        11,164
                                             Impairment and losses on sale of businesses
       1,201           211           405       and fixed assets                                                          2,058         1,689
         431           100           342     Exploration expense                                                         1,520           843
       3,409         3,693         3,910     Distribution and administration expenses(c)                                13,958        12,555
          23          (298)        (166)     Fair value (gain) loss on embedded derivatives                                (68)          309
       8,905         7,724        11,379     Profit (loss) before interest and taxation                                 39,817        (3,702)
         359           298           326     Finance costs(b)                                                            1,246         1,170
                                             Net finance income relating to
         (13)          (64)          (65)      pensions and other post-retirement benefits                               (263)           (47)
       8,559         7,490        11,118     Profit (loss) before taxation                                              38,834        (4,825)
       2,896         2,270         3,344     Taxation(b)                                                                12,737        (1,501)
       5,663         5,220         7,774     Profit (loss) for the period                                               26,097        (3,324)
                                             Attributable to
       5,567         5,043         7,685       BP shareholders                                                          25,700         (3,719)
          96           177            89       Minority interest                                                           397            395
       5,663         5,220         7,774                                                                                26,097         (3,324)
                                             Earnings per share – cents (Note 7)
                                             Profit (loss) for the period attributable to BP
                                              shareholders
       29.62         26.62         40.51     Basic                                                                      135.93        (19.81)
       29.28         26.28         39.99     Diluted                                                                    134.29        (19.81)

(a)     Adjusted to include BP’s share of Pan American Energy LLC’s profit. See Note 4 on pages 28 – 30.
(b)     See Note 2 on pages 21 – 26 for further details of the impact of the Gulf of Mexico oil spill on the income statement line items.
(c)     Cash costs for the fourth quarter of 2011 increased significantly compared to the same period a year ago and reflected higher
        turnaround and related maintenance spend and rig standby costs in the Gulf of Mexico. Cash costs are a subset of production and
        manufacturing expenses plus distribution and administration expenses. They represent the substantial majority of the expenses in
        these line items but exclude associated non-operating items (including amounts relating to the Gulf of Mexico oil spill), and certain
        costs that are variable, primarily with volumes (such as freight costs). They are the principal operating and overhead costs that
        management considers to be most directly under their control although they include certain foreign exchange and commodity price
        effects.


                                                                                                                                            12
Group statement of comprehensive income

    Fourth         Third        Fourth
   quarter       quarter       quarter                                                                                Year     Year
      2010        2011(a)         2011                                                                                2011     2010
                                           $ million
       5,663       5,220          7,774    Profit (loss) for the period                                          26,097       (3,324)
          26      (1,483)         (106)    Currency translation differences                                       (531)          259
                                           Exchange (gains) losses on translation of
                                            foreign operations transferred to gain or loss
         (48)           6              –    on sales of businesses and fixed assets                                     19       (20)
                                           Actuarial gain (loss) relating to pensions and
       (320)            –       (5,960)     other post-retirement benefits                                       (5,960)       (320)
                                           Available-for-sale investments marked to
          65        (338)            96     market                                                                     (71)    (191)
                                           Available-for-sale investments – recycled to
          (8)          2              –     the income statement                                                        (3)    (150)
          20        (125)          (24)    Cash flow hedges marked to market                                            44       (65)
                                           Cash flow hedges – recycled to the income
          16          (70)            3     statement                                                                 (195)      (25)
                                           Cash flow hedges – recycled to the balance
           8           (4)           (6)    sheet                                                                      (13)       53
                                           Share of equity-accounted entities'
            –           –           (57)    other comprehensive income, net of tax                                   (57)           –
         121           6          1,601    Taxation                                                                1,659        (137)
        (120)     (2,006)       (4,453)    Other comprehensive income (expense)                                  (5,108)        (596)
       5,543       3,214          3,321    Total comprehensive income (expense)                                  20,989       (3,920)
                                           Attributable to
       5,449        3,049         3,243     BP shareholders                                                      20,605       (4,318)
          94          165            78     Minority interest                                                       384          398
       5,543        3,214         3,321                                                                          20,989       (3,920)

 (a)   Adjusted to include BP’s share of Pan American Energy LLC’s profit. See Note 4 on pages 28 – 30.


                                 Group statement of changes in equity

                                                                                      BP
                                                                            shareholders’                 Minority             Total
                                                                                  equity                  interest            equity
$ million
At 1 January 2011                                                                    94,987                    904             95,891

Total comprehensive income                                                           20,605                    384             20,989
Dividends                                                                            (4,072)                 (245)             (4,317)
Share-based payments (net of tax)                                                        (8)                      –                (8)
Transactions involving minority interests                                               (47)                   (26)               (73)
At 31 December 2011                                                                 111,465                  1,017            112,482

                                                                                      BP
                                                                            shareholders’                 Minority             Total
                                                                                  equity                  interest            equity
$ million
At 1 January 2010                                                                   101,613                    500            102,113

Total comprehensive income (expense)                                                 (4,318)                   398             (3,920)
Dividends                                                                            (2,627)                  (315)            (2,942)
Share-based payments (net of tax)                                                       339                       –               339
Transactions involving minority interests                                               (20)                   321                301
At 31 December 2010                                                                  94,987                    904             95,891


                                                                                                                                   13
Group balance sheet

                                                                                               31 December         31 December
                                                                                                      2011                2010(a)
$ million
Non-current assets
Property, plant and equipment                                                                         119,214            110,163
Goodwill                                                                                               12,100              8,598
Intangible assets                                                                                      21,102             14,298
Investments in jointly controlled entities                                                             15,518             14,927
Investments in associates                                                                              13,291             13,335
Other investments                                                                                       2,117              1,191
Fixed assets                                                                                          183,342            162,512
Loans                                                                                                     884                894
Other receivables                                                                                       4,096              6,298
Derivative financial instruments                                                                        5,038              4,210
Prepayments                                                                                             1,255              1,432
Deferred tax assets                                                                                       611                528
Defined benefit pension plan surpluses                                                                     17              2,176
                                                                                                      195,243            178,050
Current assets
Loans                                                                                                     244                247
Inventories                                                                                            25,661             26,218
Trade and other receivables                                                                            41,626             36,549
Derivative financial instruments                                                                        3,857              4,356
Prepayments                                                                                             1,286              1,574
Current tax receivable                                                                                    235                693
Other investments                                                                                         288              1,532
Cash and cash equivalents                                                                              14,067             18,556
                                                                                                       87,264             89,725
Assets classified as held for sale (Note 4)                                                             8,420              4,487
                                                                                                       95,684             94,212
Total assets                                                                                          290,927            272,262
Current liabilities
Trade and other payables                                                                               52,405             46,329
Derivative financial instruments                                                                        3,220              3,856
Accruals                                                                                                5,932              5,612
Finance debt                                                                                            9,044             14,626
Current tax payable                                                                                     1,941              2,920
Provisions                                                                                              9,338              9,489
                                                                                                       81,880             82,832
Liabilities directly associated with assets classified as held for sale (Note 4)                          538              1,047
                                                                                                       82,418             83,879
Non-current liabilities
Other payables                                                                                          3,437             14,285
Derivative financial instruments                                                                        3,773              3,677
Accruals                                                                                                  389                637
Finance debt                                                                                           35,169             30,710
Deferred tax liabilities                                                                               15,078             10,908
Provisions                                                                                             26,163             22,418
Defined benefit pension plan and other post-retirement benefit plan deficits                           12,018              9,857
                                                                                                       96,027             92,492
Total liabilities                                                                                     178,445            176,371
Net assets                                                                                            112,482             95,891
Equity
BP shareholders’ equity                                                                               111,465             94,987
Minority interest                                                                                       1,017                904
                                                                                                      112,482             95,891

 (a)   Adjusted following the termination of the Pan American Energy LLC sale agreement. See Note 4 on pages 28 – 30.


                                                                                                                                14
Condensed group cash flow statement

   Fourth            Third         Fourth
  quarter          quarter        quarter                                                                                   Year           Year
     2010           2011(a)          2011                                                                                   2011           2010
                                               $ million
                                               Operating activities
       8,559          7,490        11,118      Profit (loss) before taxation                                              38,834         (4,825)
                                               Adjustments to reconcile profit before taxation
                                                 to net cash provided by operating activities
                                               Depreciation, depletion and amortization
       2,877          2,674          3,083       and exploration expenditure written off                                  12,159         11,539
                                               Impairment and (gain) loss on sale of
      (1,552)         (579)          (972)       businesses and fixed assets                                             (2,072)         (4,694)
                                               Earnings from equity-accounted entities,
         (76)         (687)            856       less dividends received                                                    (839)        (1,480)
                                               Net charge for interest and other finance
            5            15           (54)       expense, less net interest paid                                            (109)            139
           72           128          (205)     Share-based payments                                                          (88)            197
                                               Net operating charge for pensions and other
                                                 post-retirement benefits, less contributions
       (298)          (106)          (300)       and benefit payments for unfunded plans                                 (1,004)           (959)
       2,005           555              71     Net charge for provisions, less payments                                      835         19,217
                                               Movements in inventories and other current
 (10,215)             (372)        (6,049)       and non-current assets and liabilities(b)                              (17,527)          1,092
  (1,555)           (2,226)        (2,538)     Income taxes paid                                                         (8,035)         (6,610)
    (178)            6,892           5,010     Net cash provided by (used in) operating activities                        22,154         13,616
                                               Investing activities
      (5,118)       (4,146)        (5,805)     Capital expenditure(c)                                                   (17,845)       (18,421)
           (8)      (2,005)        (3,018)     Acquisitions, net of cash acquired                                       (10,909)        (2,468)
        (174)         (171)          (362)     Investment in jointly controlled entities(c)                                (857)          (461)
          (27)           (6)           (19)    Investment in associates                                                      (55)           (65)
       2,555           447           1,396     Proceeds from disposal of fixed assets(d)                                   3,500         7,492
                                               Proceeds from disposal of businesses, net of
       4,818         1,627         (3,357)       cash disposed(d)(e)                                                       (768)          9,462
         109            63              87     Proceeds from loan repayments                                                 301            501
       2,155        (4,191)       (11,078)     Net cash provided by (used in) investing activities                      (26,633)         (3,960)
                                               Financing activities
          31             14              30    Net issue of shares                                                            74            169
       6,529           391           3,596     Proceeds from long-term financing                                         11,600          11,934
      (1,963)       (1,863)        (1,515)     Repayments of long-term financing                                         (9,102)         (4,702)
        (533)         (145)          1,580     Net increase (decrease) in short-term debt                                  2,227         (3,619)
            –       (1,225)        (1,244)     Dividends paid – BP shareholders                                          (4,072)         (2,627)
        (117)           (80)           (63)    Dividends paid – Minority interest                                          (245)           (315)
       3,947        (2,908)          2,384     Net cash provided by (used in) financing activities                           482            840
                                               Currency translation differences relating to
        (171)         (545)          (246)       cash and cash equivalents                                                  (492)          (279)
                                               Increase (decrease) in cash and cash
       5,753          (752)        (3,930)       equivalents                                                             (4,489)         10,217
                                               Cash and cash equivalents at beginning
      12,803        18,749         17,997        of period                                                                18,556          8,339
      18,556        17,997         14,067      Cash and cash equivalents at end of period                                 14,067         18,556

(a)     Adjusted to include BP’s share of Pan American Energy LLC’s profit. See Note 4 on pages 28 – 30.
(b)     Includes
      (1,445)           372           (101)    Inventory holding (gains) losses                                           (2,634)           (1,784)
          23           (298)          (166)    Fair value (gain) loss on embedded derivatives                                (68)              309
      (6,542)        (1,523)        (5,965)    Movements related to Gulf of Mexico oil spill response                    (13,264)            3,846
        Inventory holding gains and losses and fair value gains and losses on embedded derivatives are also included within profit before
        taxation. See Note 2 for further information on the cash flow impacts of the Gulf of Mexico oil spill.
(c)     A minor amendment has been made to capital expenditure in each of the first, second and third quarters of 2011 with offsetting
        amendments to investment in jointly controlled entities, with no net effect on net cash used in investing activities.
(d)     Included in disposal proceeds are deposits received in respect of disposal transactions expected to complete in subsequent periods
        as follows: fourth quarter 2011 nil; third quarter 2011 nil; fourth quarter 2010 $4,947 million; full year 2011 $500 million; full year 2010
        $9,992 million. For further information see Note 8.
(e)     Fourth quarter 2011 includes the repayment of the deposit of $3,530 million following the termination of the Pan American Energy
        LLC sale agreement as described in Note 4.


                                                                                                                                                15
Capital expenditure and acquisitions

  Fourth            Third          Fourth
 quarter          quarter         quarter                                                                              Year            Year
    2010            2011             2011                                                                              2011            2010
                                              $ million
                                              By business
                                              Exploration and Production
      1,043         1,003           2,336     US(a)(b)                                                               5,363            6,632
      2,319         9,309           3,313     Non-US(c)(d)(e)                                                       20,172           11,121
      3,362        10,312           5,649                                                                           25,535           17,753
                                              Refining and Marketing
        755            729            713     US                                                                      2,590            2,761
        610            356            656     Non-US                                                                  1,540            1,268
      1,365          1,085          1,369                                                                             4,130            4,029
                                              Other businesses and corporate
        630           198             423     US(f)                                                                    877              977
        104            63             204     Non-US(g)                                                                976              257
        734           261             627                                                                            1,853            1,234
      5,461        11,658           7,645                                                                           31,518           23,016
                                              By geographical area
      2,428         1,930           3,472     US(a)(b)(f)                                                            8,830           10,370
      3,033         9,728           4,173     Non-US(c)(d)(e)(g)                                                    22,688           12,646
      5,461        11,658           7,645                                                                           31,518           23,016
                                              Included above:
       212           6,987            282     Acquisitions and asset exchanges(b)(c)(d)(g)                          11,283             3,406

(a)    Fourth quarter and year 2011 included $1,096 million associated with deepening our natural gas asset base.
(b)    Year 2010 included $1,767 million in the US deepwater Gulf of Mexico as part of the transaction with Devon Energy announced in
       first quarter 2010.
(c)    Third quarter, fourth quarter and year 2011 included $6,957 million, $69 million and $7,026 million respectively relating to the
       acquisition from Reliance Industries of interests in 21 oil and gas production-sharing agreements in India. See Note 3 for further
       details.
(d)    Year 2011 included $3,236 million in Brazil as part of the transaction with Devon Energy announced in first quarter 2010. Year 2010
       included $1,107 million in Azerbaijan as part of the transaction with Devon Energy.
(e)    Year 2010 included $492 million for the purchase of additional interests in the Valhall and Hod fields in the North Sea, and
       $900 million relating to the formation of a partnership with Value Creation Inc. to develop the Terre de Grace oil sands acreage in the
       Athabasca region of Alberta, Canada.
(f)    Fourth quarter and year 2010 included capital expenditure of $390 million and $557 million respectively for wind turbines, which was
       incurred at the time for future wind projects.
(g)    Year 2011 included capital expenditure of $680 million in Brazil relating to the acquisition of CNAA.


                                                        Exchange rates

  Fourth            Third          Fourth
 quarter          quarter         quarter                                                                              Year            Year
    2010            2011             2011                                                                              2011            2010
    1.58             1.61            1.57     US dollar/sterling average rate for the period                           1.60            1.54
    1.54             1.57            1.54     US dollar/sterling period-end rate                                       1.54            1.54
    1.36             1.41            1.35     US dollar/euro average rate for the period                               1.39            1.32
    1.33             1.36            1.29     US dollar/euro period-end rate                                           1.29            1.33


                                                                                                                                          16
BP Q4 2011 Results
BP Q4 2011 Results
BP Q4 2011 Results
BP Q4 2011 Results
BP Q4 2011 Results
BP Q4 2011 Results
BP Q4 2011 Results
BP Q4 2011 Results
BP Q4 2011 Results
BP Q4 2011 Results
BP Q4 2011 Results
BP Q4 2011 Results
BP Q4 2011 Results
BP Q4 2011 Results
BP Q4 2011 Results
BP Q4 2011 Results
BP Q4 2011 Results
BP Q4 2011 Results
BP Q4 2011 Results
BP Q4 2011 Results
BP Q4 2011 Results
BP Q4 2011 Results
BP Q4 2011 Results
BP Q4 2011 Results
BP Q4 2011 Results
BP Q4 2011 Results

Contenu connexe

En vedette

Mensagem a Câmara e Planilhas
Mensagem a Câmara e PlanilhasMensagem a Câmara e Planilhas
Mensagem a Câmara e PlanilhasJulio Silva
 
R034 伊藤武彦・田原俊司・朴 媛淑 (1993). 文の理解にはたす助詞の働き:日本語と韓国語を中心に 風間書房
R034 伊藤武彦・田原俊司・朴 媛淑 (1993). 文の理解にはたす助詞の働き:日本語と韓国語を中心に 風間書房R034 伊藤武彦・田原俊司・朴 媛淑 (1993). 文の理解にはたす助詞の働き:日本語と韓国語を中心に 風間書房
R034 伊藤武彦・田原俊司・朴 媛淑 (1993). 文の理解にはたす助詞の働き:日本語と韓国語を中心に 風間書房Takehiko Ito
 
Jarvisetal 2009 s_brevoortii
Jarvisetal 2009 s_brevoortiiJarvisetal 2009 s_brevoortii
Jarvisetal 2009 s_brevoortiiKerriL
 
Purification of the T lymphocyte growth factor Interleukin-2 from cultured me...
Purification of the T lymphocyte growth factor Interleukin-2 from cultured me...Purification of the T lymphocyte growth factor Interleukin-2 from cultured me...
Purification of the T lymphocyte growth factor Interleukin-2 from cultured me...Elke Stein
 
Ghbmc presentation for lstc conference
Ghbmc presentation for lstc conferenceGhbmc presentation for lstc conference
Ghbmc presentation for lstc conferenceJohn Combest
 
7 bolivia andina desde sucre
7 bolivia andina desde sucre7 bolivia andina desde sucre
7 bolivia andina desde sucreimperioinca
 
Сatalogue of the participants of "Wine & Winemaking 2011" exhibition, Odessa,...
Сatalogue of the participants of "Wine & Winemaking 2011" exhibition, Odessa,...Сatalogue of the participants of "Wine & Winemaking 2011" exhibition, Odessa,...
Сatalogue of the participants of "Wine & Winemaking 2011" exhibition, Odessa,...Polina Tashakova
 
ATM for targeted marketing
ATM for targeted marketingATM for targeted marketing
ATM for targeted marketingPavel Tulubiev
 
Klibel5 acc 25_
Klibel5 acc 25_Klibel5 acc 25_
Klibel5 acc 25_KLIBEL
 
Handout -revenue recognition webcast 5-27-15
Handout -revenue recognition webcast 5-27-15Handout -revenue recognition webcast 5-27-15
Handout -revenue recognition webcast 5-27-15Jin Young Park
 

En vedette (17)

Mensagem a Câmara e Planilhas
Mensagem a Câmara e PlanilhasMensagem a Câmara e Planilhas
Mensagem a Câmara e Planilhas
 
R034 伊藤武彦・田原俊司・朴 媛淑 (1993). 文の理解にはたす助詞の働き:日本語と韓国語を中心に 風間書房
R034 伊藤武彦・田原俊司・朴 媛淑 (1993). 文の理解にはたす助詞の働き:日本語と韓国語を中心に 風間書房R034 伊藤武彦・田原俊司・朴 媛淑 (1993). 文の理解にはたす助詞の働き:日本語と韓国語を中心に 風間書房
R034 伊藤武彦・田原俊司・朴 媛淑 (1993). 文の理解にはたす助詞の働き:日本語と韓国語を中心に 風間書房
 
Articol
ArticolArticol
Articol
 
Jarvisetal 2009 s_brevoortii
Jarvisetal 2009 s_brevoortiiJarvisetal 2009 s_brevoortii
Jarvisetal 2009 s_brevoortii
 
Purification of the T lymphocyte growth factor Interleukin-2 from cultured me...
Purification of the T lymphocyte growth factor Interleukin-2 from cultured me...Purification of the T lymphocyte growth factor Interleukin-2 from cultured me...
Purification of the T lymphocyte growth factor Interleukin-2 from cultured me...
 
Ghbmc presentation for lstc conference
Ghbmc presentation for lstc conferenceGhbmc presentation for lstc conference
Ghbmc presentation for lstc conference
 
7 bolivia andina desde sucre
7 bolivia andina desde sucre7 bolivia andina desde sucre
7 bolivia andina desde sucre
 
Lindpere__Anna
Lindpere__AnnaLindpere__Anna
Lindpere__Anna
 
Сatalogue of the participants of "Wine & Winemaking 2011" exhibition, Odessa,...
Сatalogue of the participants of "Wine & Winemaking 2011" exhibition, Odessa,...Сatalogue of the participants of "Wine & Winemaking 2011" exhibition, Odessa,...
Сatalogue of the participants of "Wine & Winemaking 2011" exhibition, Odessa,...
 
Jornal digital 4646_seg_13042015
Jornal digital 4646_seg_13042015Jornal digital 4646_seg_13042015
Jornal digital 4646_seg_13042015
 
Scan0009
Scan0009Scan0009
Scan0009
 
Campana Teka NC2 985
Campana Teka NC2 985Campana Teka NC2 985
Campana Teka NC2 985
 
ATM for targeted marketing
ATM for targeted marketingATM for targeted marketing
ATM for targeted marketing
 
Resurrection Sunday
Resurrection SundayResurrection Sunday
Resurrection Sunday
 
Klibel5 acc 25_
Klibel5 acc 25_Klibel5 acc 25_
Klibel5 acc 25_
 
Metaxalone 1665-48-1-api
Metaxalone 1665-48-1-apiMetaxalone 1665-48-1-api
Metaxalone 1665-48-1-api
 
Handout -revenue recognition webcast 5-27-15
Handout -revenue recognition webcast 5-27-15Handout -revenue recognition webcast 5-27-15
Handout -revenue recognition webcast 5-27-15
 

Dernier

the 25 most beautiful words for a loving and lasting relationship.pdf
the 25 most beautiful words for a loving and lasting relationship.pdfthe 25 most beautiful words for a loving and lasting relationship.pdf
the 25 most beautiful words for a loving and lasting relationship.pdfFrancenel Paul
 
9654467111 Call Girls In Katwaria Sarai Short 1500 Night 6000
9654467111 Call Girls In Katwaria Sarai Short 1500 Night 60009654467111 Call Girls In Katwaria Sarai Short 1500 Night 6000
9654467111 Call Girls In Katwaria Sarai Short 1500 Night 6000Sapana Sha
 
Corporate Presentation Probe April 2024.pdf
Corporate Presentation Probe April 2024.pdfCorporate Presentation Probe April 2024.pdf
Corporate Presentation Probe April 2024.pdfProbe Gold
 
Collective Mining | Corporate Presentation - April 2024
Collective Mining | Corporate Presentation - April 2024Collective Mining | Corporate Presentation - April 2024
Collective Mining | Corporate Presentation - April 2024CollectiveMining1
 
Best investment platform in india - falcon invoice discounting
Best investment platform in india - falcon invoice discountingBest investment platform in india - falcon invoice discounting
Best investment platform in india - falcon invoice discountingFalcon Invoice Discounting
 
9654467111 Low Rate Call Girls In Tughlakabad, Delhi NCR
9654467111 Low Rate Call Girls In Tughlakabad, Delhi NCR9654467111 Low Rate Call Girls In Tughlakabad, Delhi NCR
9654467111 Low Rate Call Girls In Tughlakabad, Delhi NCRSapana Sha
 
slideshare_2404_presentation materials_en.pdf
slideshare_2404_presentation materials_en.pdfslideshare_2404_presentation materials_en.pdf
slideshare_2404_presentation materials_en.pdfsansanir
 
WheelTug PLC Pitch Deck | Investor Insights | April 2024
WheelTug PLC Pitch Deck | Investor Insights | April 2024WheelTug PLC Pitch Deck | Investor Insights | April 2024
WheelTug PLC Pitch Deck | Investor Insights | April 2024Hector Del Castillo, CPM, CPMM
 
Q1 Quarterly Update - April 16, 2024.pdf
Q1 Quarterly Update - April 16, 2024.pdfQ1 Quarterly Update - April 16, 2024.pdf
Q1 Quarterly Update - April 16, 2024.pdfProbe Gold
 
Corporate Presentation Probe April 2024.pdf
Corporate Presentation Probe April 2024.pdfCorporate Presentation Probe April 2024.pdf
Corporate Presentation Probe April 2024.pdfProbe Gold
 
Leveraging USDA Rural Development Grants for Community Growth and Sustainabil...
Leveraging USDA Rural Development Grants for Community Growth and Sustainabil...Leveraging USDA Rural Development Grants for Community Growth and Sustainabil...
Leveraging USDA Rural Development Grants for Community Growth and Sustainabil...USDAReapgrants.com
 

Dernier (15)

the 25 most beautiful words for a loving and lasting relationship.pdf
the 25 most beautiful words for a loving and lasting relationship.pdfthe 25 most beautiful words for a loving and lasting relationship.pdf
the 25 most beautiful words for a loving and lasting relationship.pdf
 
young call girls in Govindpuri 🔝 9953056974 🔝 Delhi escort Service
young call girls in Govindpuri 🔝 9953056974 🔝 Delhi escort Serviceyoung call girls in Govindpuri 🔝 9953056974 🔝 Delhi escort Service
young call girls in Govindpuri 🔝 9953056974 🔝 Delhi escort Service
 
9654467111 Call Girls In Katwaria Sarai Short 1500 Night 6000
9654467111 Call Girls In Katwaria Sarai Short 1500 Night 60009654467111 Call Girls In Katwaria Sarai Short 1500 Night 6000
9654467111 Call Girls In Katwaria Sarai Short 1500 Night 6000
 
Corporate Presentation Probe April 2024.pdf
Corporate Presentation Probe April 2024.pdfCorporate Presentation Probe April 2024.pdf
Corporate Presentation Probe April 2024.pdf
 
Call Girls in South Ex⎝⎝9953056974⎝⎝ Escort Delhi NCR
Call Girls in South Ex⎝⎝9953056974⎝⎝ Escort Delhi NCRCall Girls in South Ex⎝⎝9953056974⎝⎝ Escort Delhi NCR
Call Girls in South Ex⎝⎝9953056974⎝⎝ Escort Delhi NCR
 
Collective Mining | Corporate Presentation - April 2024
Collective Mining | Corporate Presentation - April 2024Collective Mining | Corporate Presentation - April 2024
Collective Mining | Corporate Presentation - April 2024
 
Best investment platform in india - falcon invoice discounting
Best investment platform in india - falcon invoice discountingBest investment platform in india - falcon invoice discounting
Best investment platform in india - falcon invoice discounting
 
9654467111 Low Rate Call Girls In Tughlakabad, Delhi NCR
9654467111 Low Rate Call Girls In Tughlakabad, Delhi NCR9654467111 Low Rate Call Girls In Tughlakabad, Delhi NCR
9654467111 Low Rate Call Girls In Tughlakabad, Delhi NCR
 
young call girls in Hauz Khas,🔝 9953056974 🔝 escort Service
young call girls in Hauz Khas,🔝 9953056974 🔝 escort Serviceyoung call girls in Hauz Khas,🔝 9953056974 🔝 escort Service
young call girls in Hauz Khas,🔝 9953056974 🔝 escort Service
 
slideshare_2404_presentation materials_en.pdf
slideshare_2404_presentation materials_en.pdfslideshare_2404_presentation materials_en.pdf
slideshare_2404_presentation materials_en.pdf
 
WheelTug PLC Pitch Deck | Investor Insights | April 2024
WheelTug PLC Pitch Deck | Investor Insights | April 2024WheelTug PLC Pitch Deck | Investor Insights | April 2024
WheelTug PLC Pitch Deck | Investor Insights | April 2024
 
young Call girls in Dwarka sector 1🔝 9953056974 🔝 Delhi escort Service
young Call girls in Dwarka sector 1🔝 9953056974 🔝 Delhi escort Serviceyoung Call girls in Dwarka sector 1🔝 9953056974 🔝 Delhi escort Service
young Call girls in Dwarka sector 1🔝 9953056974 🔝 Delhi escort Service
 
Q1 Quarterly Update - April 16, 2024.pdf
Q1 Quarterly Update - April 16, 2024.pdfQ1 Quarterly Update - April 16, 2024.pdf
Q1 Quarterly Update - April 16, 2024.pdf
 
Corporate Presentation Probe April 2024.pdf
Corporate Presentation Probe April 2024.pdfCorporate Presentation Probe April 2024.pdf
Corporate Presentation Probe April 2024.pdf
 
Leveraging USDA Rural Development Grants for Community Growth and Sustainabil...
Leveraging USDA Rural Development Grants for Community Growth and Sustainabil...Leveraging USDA Rural Development Grants for Community Growth and Sustainabil...
Leveraging USDA Rural Development Grants for Community Growth and Sustainabil...
 

BP Q4 2011 Results

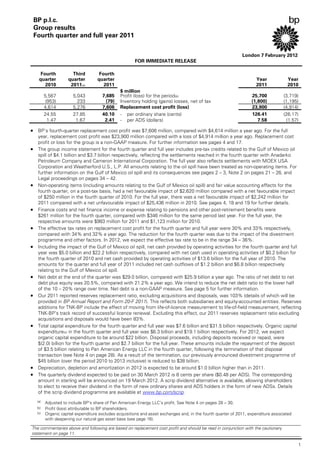
  • 1. BP p.l.c. Group results Fourth quarter and full year 2011 London 7 February 2012 FOR IMMEDIATE RELEASE Fourth Third Fourth quarter quarter quarter Year Year 2010 2011(a) 2011 2011 2010 $ million 5,567 5,043 7,685 Profit (loss) for the period(b) 25,700 (3,719) (953) 233 (79) Inventory holding (gains) losses, net of tax (1,800) (1,195) 4,614 5,276 7,606 Replacement cost profit (loss) 23,900 (4,914) 24.55 27.85 40.10 - per ordinary share (cents) 126.41 (26.17) 1.47 1.67 2.41 - per ADS (dollars) 7.58 (1.57) • BP’s fourth-quarter replacement cost profit was $7,606 million, compared with $4,614 million a year ago. For the full year, replacement cost profit was $23,900 million compared with a loss of $4,914 million a year ago. Replacement cost profit or loss for the group is a non-GAAP measure. For further information see pages 4 and 17. • The group income statement for the fourth quarter and full year includes pre-tax credits related to the Gulf of Mexico oil spill of $4.1 billion and $3.7 billion respectively, reflecting the settlements reached in the fourth quarter with Anadarko Petroleum Company and Cameron International Corporation. The full year also reflects settlements with MOEX USA Corporation and Weatherford U.S., L.P. All amounts relating to the oil spill have been treated as non-operating items. For further information on the Gulf of Mexico oil spill and its consequences see pages 2 – 3, Note 2 on pages 21 – 26, and Legal proceedings on pages 34 – 42. • Non-operating items (including amounts relating to the Gulf of Mexico oil spill) and fair value accounting effects for the fourth quarter, on a post-tax basis, had a net favourable impact of $2,620 million compared with a net favourable impact of $250 million in the fourth quarter of 2010. For the full year, there was a net favourable impact of $2,242 million for 2011 compared with a net unfavourable impact of $25,436 million in 2010. See pages 4, 18 and 19 for further details. • Finance costs and net finance income or expense relating to pensions and other post-retirement benefits were $261 million for the fourth quarter, compared with $346 million for the same period last year. For the full year, the respective amounts were $983 million for 2011 and $1,123 million for 2010. • The effective tax rates on replacement cost profit for the fourth quarter and full year were 30% and 33% respectively, compared with 34% and 32% a year ago. The reduction for the fourth quarter was due to the impact of the divestment programme and other factors. In 2012, we expect the effective tax rate to be in the range 34 – 36%. • Including the impact of the Gulf of Mexico oil spill, net cash provided by operating activities for the fourth quarter and full year was $5.0 billion and $22.2 billion respectively, compared with net cash used in operating activities of $0.2 billion for the fourth quarter of 2010 and net cash provided by operating activities of $13.6 billion for the full year of 2010. The amounts for the quarter and full year of 2011 included net cash outflows of $1.2 billion and $6.8 billion respectively relating to the Gulf of Mexico oil spill. • Net debt at the end of the quarter was $29.0 billion, compared with $25.9 billion a year ago. The ratio of net debt to net debt plus equity was 20.5%, compared with 21.2% a year ago. We intend to reduce the net debt ratio to the lower half of the 10 – 20% range over time. Net debt is a non-GAAP measure. See page 5 for further information. • Our 2011 reported reserves replacement ratio, excluding acquisitions and disposals, was 103% (details of which will be provided in BP Annual Report and Form 20-F 2011). This reflects both subsidiaries and equity-accounted entities. Reserves additions for TNK-BP include the effect of moving from life-of-licence measurement to life-of-field measurement, reflecting TNK-BP’s track record of successful licence renewal. Excluding this effect, our 2011 reserves replacement ratio excluding acquisitions and disposals would have been 83%. • Total capital expenditure for the fourth quarter and full year was $7.6 billion and $31.5 billion respectively. Organic capital expenditure(c) in the fourth quarter and full year was $6.3 billion and $19.1 billion respectively. For 2012, we expect organic capital expenditure to be around $22 billion. Disposal proceeds, including deposits received or repaid, were $(2.0) billion for the fourth quarter and $2.7 billion for the full year. These amounts include the repayment of the deposit of $3.5 billion relating to Pan American Energy LLC in the fourth quarter, following the termination of that disposal transaction (see Note 4 on page 28). As a result of the termination, our previously announced divestment programme of $45 billion (over the period 2010 to 2013 inclusive) is reduced to $38 billion. • Depreciation, depletion and amortization in 2012 is expected to be around $1.0 billion higher than in 2011. • The quarterly dividend expected to be paid on 30 March 2012 is 8 cents per share ($0.48 per ADS). The corresponding amount in sterling will be announced on 19 March 2012. A scrip dividend alternative is available, allowing shareholders to elect to receive their dividend in the form of new ordinary shares and ADS holders in the form of new ADSs. Details of the scrip dividend programme are available at www.bp.com/scrip. (a) Adjusted to include BP’s share of Pan American Energy LLC’s profit. See Note 4 on pages 28 – 30. (b) Profit (loss) attributable to BP shareholders. (c) Organic capital expenditure excludes acquisitions and asset exchanges and, in the fourth quarter of 2011, expenditure associated with deepening our natural gas asset base (see page 16). The commentaries above and following are based on replacement cost profit and should be read in conjunction with the cautionary statement on page 11. 1
  • 2. Gulf of Mexico oil spill Completing the response We remain committed to meeting our responsibilities to the US federal, state and local governments and communities of the Gulf coast following the Deepwater Horizon oil spill. During the fourth quarter, BP, working under the direction of the US Coast Guard’s Federal On-Scene Coordinator (FOSC), and collaboratively with the individual federal and state entities, continued to clean areas of the shoreline impacted by the oil spill. In November 2011, the FOSC approved the Shoreline Clean-up Completion Plan. This plan describes the process whereby the various shoreline segments included in the area of response operations can be surveyed, verified as meeting the applicable clean-up standards, and moved out of operational activity. For those shoreline segments that needed active mechanical or manual cleaning, the majority of the active cleaning was completed by the end of the fourth quarter of 2011. These segments will continue to be patrolled and maintained until they meet the applicable clean-up standards such that the FOSC concludes that the operational activities are complete. It is expected that the majority of the 4,300 miles of the Gulf coast shoreline that were surveyed will be deemed operationally complete in 2012. Resources continue to be maintained in line with operational requirements. The Coast Guard has indicated that if oil is discovered in a segment that has been transitioned out of operational activity, the Coast Guard will follow long-standing response protocols established under the law and contact whoever it believes is the responsible party or parties. Economic restoration To support the economic restoration of the impacted Gulf coast communities since the Deepwater Horizon oil spill occurred in 2010, BP has paid a total of $7.8 billion to fund individuals, businesses and government entity claims and advances as well as other payments for seafood research and testing, tourism, behavioural health and other contributions. Trust update During the fourth quarter, BP made contributions totalling $5.3 billion to the Deepwater Horizon Oil Spill Trust (Trust) fund, including a $4 billion cash settlement received from Anadarko Petroleum Company (Anadarko). This brings the total Trust contributions for 2011 to $10.1 billion, which also included the third-quarter settlements received from MOEX USA Corporation and Weatherford U.S., L.P. The Trust was established in 2010 to satisfy legitimate individual and business claims administered by the Gulf Coast Claims Facility (GCCF), state and local government claims resolved by BP, final judgments and settlements and natural resource damages (NRD) and related costs. Payments from the Trust during the fourth quarter were $700 million, bringing Trust disbursements for the year to $3.7 billion. Fourth-quarter disbursements consisted of $526 million paid through the GCCF for individual and business claims, $145 million for NRD assessment costs, and $29 million for state and local government claims and other resolved items. As of 31 December 2011, the cumulative amount paid from the Trust since its inception was $6.7 billion. BP’s cumulative contributions to the Trust amounted to $15.1 billion. Claims update As of 31 December 2011, a total of $7.5 billion had been paid for individual, business and government claims and advances including payments made by BP prior to the establishment of the Trust. Since the oil spill occurred in 2010, $6.2 billion in total has been paid to individual and business claimants, of which $5.8 billion was paid by the GCCF and $0.4 billion by BP prior to the establishment of the Trust. More than 189,000 individual and business claimants accepted full and final settlements, while about 33,000 have received interim payments. As at 31 December 2011, the GCCF reported that the claims submitted by 96% of phase 2(a) claimants had been reviewed. Since the oil spill occurred, BP has paid federal, state and local government entities $1.3 billion for claims and advances. BP has resolved over 90% of government claims filed. BP has also paid an additional $292 million for seafood research and testing, tourism, behavioural health and other contributions. Environmental restoration During the fourth quarter we continued to work with scientists and trustee agencies through the NRD assessment process to identify natural resources that may have been exposed to oil or otherwise impacted by the oil spill, and to look for evidence of injury. To date, BP has paid over $600 million for NRD assessment efforts including $511 million paid from the Trust. (a) Phase 2 refers to the second and final protocol for the resolution and finalization of claims, issued by the GCCF during the first quarter of 2011. It followed the ending of the emergency advance payments (phase 1) in 2010. 2
  • 3. Gulf of Mexico oil spill (continued) Under an agreement signed with federal and state agencies in April 2011, BP voluntarily committed to provide up to $1 billion to fund early restoration projects aimed at accelerating restoration efforts in the Gulf coast areas that were impacted by the accident. The agreement enables work on restoration projects to begin at the earliest opportunity, before all of the studies under the NRD assessment process are complete, and before funding is required by the Oil Pollution Act 1990 (OPA 90). On 14 December 2011, state and federal Trustees unveiled the first set of early environmental restoration projects that are proposed for funding. The eight proposed projects are located in Alabama, Florida, Louisiana and Mississippi. Collectively, the projects aim to restore and enhance wildlife and habitats, and provide additional access for recreational use. A 60-day public comment period for the initial proposed projects ends on 14 February 2012 and the projects are expected to start this year. Commitment to long-term oil spill research In 2010, BP committed $500 million over 10 years to fund independent scientific research through the Gulf of Mexico Research Initiative (GoMRI). The research will improve our knowledge of the Gulf ecosystem and help the industry and others to better understand and mitigate the potential impacts of oil spills in the region and elsewhere. To date, BP has contributed $70 million to the GoMRI. Financial update The group income statement includes a pre-tax credit of $4.1 billion for the fourth quarter in relation to the Deepwater Horizon oil spill, and a pre-tax credit of $3.7 billion for the full year 2011. The amount for the fourth quarter primarily reflects credits of $4.3 billion relating to settlements agreed in the period, partially offset by adjustments to the spill response provision and functional expenses of the Gulf Coast Restoration Organization (GCRO). The amount for the full year reflects credits of $5.5 billion relating to settlements, partially offset by further costs associated with the spill response, adjustments to provisions, and an increase in the amount provided for legal fees, as well as functional expenses of the GCRO. The pre-tax income statement charge in 2010 amounted to $40.9 billion. As at 31 December 2011, the cumulative charges for provisions to be paid from the Trust and the associated reimbursement asset recognized amounted to $14.5 billion. This included a $0.6 billion increase in the fourth-quarter provisioned amounts, primarily for personal injury and death claims and claims resulting from the Vessels of Opportunity programme. A further $5.5 billion could be provided in subsequent periods for items covered by the Trust, with no net impact on the income statement. The settlement payment from Anadarko was received by BP during the fourth quarter and we received Cameron’s payment in January 2012. Both payments were subsequently paid by BP to the $20-billion Trust. The total amounts that will be paid by BP in relation to all obligations relating to the oil spill are subject to significant uncertainty as described further in Note 2 on pages 21 – 26. Legal proceedings and investigations See Gulf of Mexico oil spill on pages 34 – 39 of BP’s Annual Report and Form 20-F 2010 and Legal proceedings on pages 34 – 42 herein for details of legal proceedings, including external investigations relating to the oil spill. 3
  • 4. Analysis of replacement cost profit (loss) before interest and tax and reconciliation to profit (loss) for the period Fourth Third Fourth quarter quarter quarter Year Year 2010 2011(a) 2011 2011 2010 $ million 8,000 7,687 7,551 Exploration and Production 30,500 30,886 964 1,493 564 Refining and Marketing 5,474 5,555 (550) (330) (1,072) Other businesses and corporate (2,478) (1,516) (1,010) (541) 4,108 Gulf of Mexico oil spill response(b) 3,800 (40,858) 56 (213) 127 Consolidation adjustment (113) 447 7,460 8,096 11,278 RC profit (loss) before interest and tax(c) 37,183 (5,486) Finance costs and net finance income or expense relating to pensions and other (346) (234) (261) post-retirement benefits (983) (1,123) (2,404) (2,409) (3,322) Taxation on a replacement cost basis (11,903) 2,090 (96) (177) (89) Minority interest (397) (395) Replacement cost profit (loss) attributable 4,614 5,276 7,606 to BP shareholders 23,900 (4,914) 1,445 (372) 101 Inventory holding gains (losses) 2,634 1,784 Taxation (charge) credit on inventory holding (492) 139 (22) gains and losses (834) (589) Profit (loss) for the period attributable 5,567 5,043 7,685 to BP shareholders 25,700 (3,719) (a) Exploration and Production result adjusted to include BP’s share of Pan American Energy LLC’s profit. See Note 4 on pages 28 – 30. (b) See Note 2 on pages 21 – 26 for further information on the accounting for the Gulf of Mexico oil spill response. (c) Replacement cost profit or loss reflects the replacement cost of supplies. Replacement cost profit or loss for the group is a non- GAAP measure. For further information see page 17. Total of non-operating items and fair value accounting effects(a)(b) Fourth Third Fourth quarter quarter quarter Year Year 2010 2011 2011 2011 2010 $ million 1,344 461 640 Exploration and Production 1,141 3,196 220 (173) (195) Refining and Marketing (539) 672 (67) 76 (454) Other businesses and corporate (822) (200) (1,010) (541) 4,108 Gulf of Mexico oil spill response 3,800 (40,858) 487 (177) 4,099 Total before interest and taxation 3,580 (37,190) (30) (14) (13) Finance costs(c) (58) (77) 457 (191) 4,086 Total before taxation 3,522 (37,267) (207) 4 (1,466) Taxation credit (charge)(d) (1,280) 11,831 250 (187) 2,620 Total after taxation for the period 2,242 (25,436) (a) An analysis of non-operating items by type is provided on page 18 and an analysis by region is shown on pages 7, 9 and 10. (b) Information on fair value accounting effects is non-GAAP. For further details, see page 19. (c) Finance costs relate to the Gulf of Mexico oil spill. See Note 2 on pages 21 – 26 for further details. (d) Tax is calculated by applying discrete quarterly effective tax rates (excluding the impact of the Gulf of Mexico oil spill and, for the first quarter 2011, the impact of a $683-million one-off deferred tax adjustment in respect of an increase in the supplementary charge on UK oil and gas production) on group profit or loss. However, the US statutory tax rate has been used for recoveries relating to the Gulf of Mexico oil spill and expenditures that qualify for tax relief. 4
  • 5. Per share amounts Fourth Third Fourth quarter quarter quarter Year Year 2010 2011(a) 2011 2011 2010 Per ordinary share (cents)(b) 29.62 26.62 40.51 Profit (loss) for the period 135.93 (19.81) 24.55 27.85 40.10 RC profit (loss) for the period 126.41 (26.17) Per ADS (dollars)(b) 1.78 1.60 2.43 Profit (loss) for the period 8.16 (1.19) 1.47 1.67 2.41 RC profit (loss) for the period 7.58 (1.57) (a) Adjusted to include BP’s share of Pan American Energy LLC’s profit. See Note 4 on pages 28 – 30. (b) See Note 7 on page 31 for details of the calculation of earnings per share. Net debt ratio – net debt: net debt + equity Fourth Third Fourth quarter quarter quarter Year Year 2010 2011(a) 2011 2011 2010 $ million 45,336 45,283 44,213 Gross debt 44,213 45,336 Less: fair value asset of hedges 916 1,454 1,133 related to finance debt 1,133 916 44,420 43,829 43,080 43,080 44,420 18,556 17,997 14,067 Cash and cash equivalents 14,067 18,556 25,864 25,832 29,013 Net debt 29,013 25,864 95,891 110,659 112,482 Equity 112,482 95,891 21.2% 18.9% 20.5% Net debt ratio 20.5% 21.2% (a) Adjusted following the termination of the Pan American Energy LLC sale agreement. See Note 4 on pages 28 – 30. See Note 8 on page 32 for further details on finance debt. Net debt and net debt ratio are non-GAAP measures. Net debt includes the fair value of associated derivative financial instruments that are used to hedge foreign exchange and interest rate risks relating to finance debt, for which hedge accounting is claimed. The derivatives are reported on the balance sheet within the headings ‘Derivative financial instruments’. We believe that net debt and net debt ratio provide useful information to investors. Net debt enables investors to see the economic effect of gross debt, related hedges and cash and cash equivalents in total. The net debt ratio enables investors to see how significant net debt is relative to equity from shareholders. Dividends Dividends payable BP today announced a dividend of 8 cents per ordinary share expected to be paid in March. The corresponding amount in sterling will be announced on 19 March 2012, calculated based on the average of the market exchange rates for the four dealing days commencing on 13 March 2012. Holders of American Depositary Shares (ADSs) will receive $0.48 per ADS. The dividend is due to be paid on 30 March 2012 to shareholders and ADS holders on the register on 17 February 2012. A scrip dividend alternative is available, allowing shareholders to elect to receive their dividend in the form of new ordinary shares and ADS holders in the form of new ADSs. Details of the fourth-quarter dividend and timetable are available at www.bp.com/dividends and details of the scrip dividend programme are available at www.bp.com/scrip. Dividends paid Fourth Third Fourth quarter quarter quarter Year Year 2010 2011 2011 2011 2010 Dividends paid per ordinary share – 7.000 7.000 cents 28.000 14.000 – 4.3160 4.4694 pence 17.4035 8.679 – 42.00 42.00 Dividends paid per ADS (cents) 168.00 84.00 Scrip dividends – 14.8 11.4 Number of shares issued (millions) 165.6 – – 101 83 Value of shares issued ($ million) 1,219 – 5
  • 6. Exploration and Production Fourth Third Fourth quarter quarter quarter Year Year 2010 2011(a) 2011 2011 2010 $ million 8,114 7,691 7,559 Profit before interest and tax 30,632 30,970 (114) (4) (8) Inventory holding (gains) losses (132) (84) 8,000 7,687 7,551 Replacement cost profit before interest and tax 30,500 30,886 By region 1,522 1,432 2,158 US 6,196 9,684 6,478 6,255 5,393 Non-US 24,304 21,202 8,000 7,687 7,551 30,500 30,886 (a) Adjusted to include BP’s share of Pan American Energy LLC’s profit. See Note 4 on pages 28 – 30. The replacement cost profit before interest and tax for the fourth quarter and full year was $7,551 million and $30,500 million respectively, compared with $8,000 million and $30,886 million respectively for the same periods in 2010. The fourth quarter benefited from net non-operating gains of $584 million, mainly comprising gains on disposals partly offset by a charge associated with the termination of the agreement to sell our 60% interest in Pan American Energy LLC to Bridas Corporation (Bridas). (See Note 4 on page 28 for further information on the termination of this agreement.) In the same period a year ago, there were net non-operating gains of $1,356 million. The full year included net non-operating gains of $1,130 million, compared with $3,199 million in 2010, with gains on disposals being partly offset by impairments, the fourth- quarter Bridas charge and other non-operating items. In the fourth quarter and full year, fair value accounting effects had favourable impacts of $56 million and $11 million respectively, compared with unfavourable impacts of $12 million and $3 million in the same periods of last year. The primary additional factors impacting replacement cost profit for both the fourth quarter and full year, compared with the same periods a year ago, were higher realizations partially offset by lower production volumes (including in higher margin areas). The fourth quarter was also impacted by increased depreciation (due to increased decommissioning provisions and higher activity in Iraq), higher costs (including ongoing maintenance and integrity-related spend), and rig standby costs in the Gulf of Mexico. There was a loss in the fourth quarter in gas marketing and trading, but the contribution for the full year improved compared with 2010. The full-year result was also impacted by rig standby costs in the Gulf of Mexico, higher costs related to turnarounds, certain one-off costs, and higher exploration write-offs. Earnings from equity-accounted entities, including TNK-BP, were higher in both the fourth quarter and full year compared with the same periods in 2010, primarily due to higher realizations. Production for the quarter was 3,487mboe/d, 5% lower than the fourth quarter of 2010. After adjusting for the effect of acquisitions and divestments and entitlement impacts in our production-sharing agreements (PSAs), the decrease was 4%. This primarily reflects lower Gulf of Mexico production, as a result of ongoing base decline owing to the impacts of the drilling moratorium. This was partly offset by the ramp-up of production at Greater Plutonio and the start-up of Pazflor in Angola. For the full year production was 3,454mboe/d, 10% lower than 2010. After adjusting for the effect of acquisitions and divestments and PSA entitlement impacts, the full-year production was 7% lower than a year ago. In addition to the factors noted above, production for the full year was impacted by higher turnaround and maintenance activity. For 2012, production excluding TNK-BP is expected to be broadly flat compared with 2011, after adjusting for divestments and at an oil price of $100 per barrel. We continue to make strategic progress. In October, BP Egypt announced the Salmon gas discovery in the North El Burg Offshore Concession, Nile Delta. In Vietnam, we completed the disposal of Block 06.1 and pipeline assets to TNK-BP. In November, we announced that a Notification of Discovery for the Itaipu-2 pre-salt appraisal well, located in block BM-C-32 in the deepwater sector of the Campos Basin, has been lodged with the Brazilian National Petroleum Agency. Also in November, we confirmed that we have been awarded a 100% interest in the offshore West Aru I and II PSAs in the Arafura Sea, Indonesia, approximately 500 kilometres southwest of the BP-operated North Arafura PSA. In December, we announced that we have agreed to sell our Canadian natural gas liquids (NGL) business to Plains Midstream Canada ULC. Completion of the transaction is subject to closing conditions including the receipt of all necessary governmental and regulatory approvals. We also completed the sale of our interests in the Pompano and Mica fields in the deepwater Gulf of Mexico, to Stone Energy Offshore LLC, for $204 million. Additionally, BP completed the sale of its interests in the Wytch Farm, Wareham, Beacon and Kimmeridge fields to Perenco UK Ltd. Also in December, we were awarded four more deepwater exploration and production blocks offshore Angola. These give BP a leading position in Angola, with interests in nine blocks covering more than 30,000 square kilometres. We also deepened our position in US natural gas. During the quarter we resumed drilling activity in the Gulf of Mexico and, at the end of 2011, five rigs were operational at BP-operated leases. In December, we reached our final investment decision to proceed with phase 2 of the Mad Dog field development. This is the first such investment decision we have made on a BP-operated stand-alone project in the Gulf of Mexico in a decade. 6
  • 7. Exploration and Production Fourth Third Fourth quarter quarter quarter Year Year 2010 2011 2011 2011 2010 $ million Non-operating items (273) (32) 831 US 73 1,190 1,629 532 (247) Non-US 1,057 2,009 1,356 500 584 1,130 3,199 Fair value accounting effects(a) 9 (9) 17 US 15 141 (21) (30) 39 Non-US (4) (144) (12) (39) 56 11 (3) Exploration expense 254 52 80 US(b) 1,065 465 177 48 262 Non-US(c) 455 378 431 100 342 1,520 843 Production (net of royalties)(d) Liquids (mb/d)(e) 567 388 439 US 453 594 155 120 145 Europe 145 177 858 872 874 Russia(f) 865 856 686 695 699 Rest of World(f) 694 747 2,266 2,075 2,157 2,157 2,374 Natural gas (mmcf/d) 2,085 1,819 1,817 US 1,843 2,184 390 214 497 Europe 368 487 698 658 744 Russia(f) 699 640 4,987 4,522 4,656 Rest of World(f) 4,608 5,090 8,160 7,213 7,714 7,518 8,401 Total hydrocarbons (mboe/d)(g) 927 702 752 US 771 970 222 157 230 Europe 209 261 978 985 1,002 Russia(f) 985 967 1,546 1,475 1,503 Rest of World(f) 1,489 1,624 3,673 3,319 3,487 3,454 3,822 Average realizations(h) 78.80 103.53 101.84 Total liquids ($/bbl) 101.29 73.41 3.98 4.95 5.07 Natural gas ($/mcf) 4.69 3.97 50.41 63.74 63.49 Total hydrocarbons ($/boe) 62.31 47.90 (a) These effects represent the favourable (unfavourable) impact relative to management’s measure of performance. Further information on fair value accounting effects is provided on page 19. (b) Full year 2011 includes $395 million classified within the ‘other’ category of non-operating items. Full year 2011 also includes a net charge of $14 million related to decommissioning of idle infrastructure, as required by BOEMRE’s Notice to Lessees No. 2010-GO5 issued in October 2010. This net charge reflects an expense of $93 million in the first quarter, partially offset by a net credit in the subsequent periods due to amendments to previous estimates. (c) Full year 2011 includes $44 million classified within the ‘other’ category of non-operating items. (d) Includes BP’s share of production of equity-accounted entities. (e) Crude oil and natural gas liquids. (f) A minor amendment has been made in the third quarter 2011. (g) Natural gas is converted to oil equivalent at 5.8 billion cubic feet = 1 million barrels. (h) Based on sales of consolidated subsidiaries only - this excludes equity-accounted entities. Because of rounding, some totals may not agree exactly with the sum of their component parts. 7
  • 8. Refining and Marketing Fourth Third Fourth quarter quarter quarter Year Year 2010 2011 2011 2011 2010 $ million 2,282 1,117 657 Profit before interest and tax 7,961 7,239 (1,318) 376 (93) Inventory holding (gains) losses (2,487) (1,684) 964 1,493 564 Replacement cost profit before interest and tax 5,474 5,555 By region 21 761 31 US 1,415 935 943 732 533 Non-US 4,059 4,620 964 1,493 564 5,474 5,555 The replacement cost profit before interest and tax for the fourth quarter and full year was $564 million and $5,474 million respectively, compared with $964 million and $5,555 million for the same periods last year. The fourth-quarter and full-year results include net non-operating charges of $140 million, and $602 million respectively, principally relating to impairment charges associated with our divestment programme, partially offset by gains on disposal. In 2010, there were net non-operating gains of $86 million and $630 million for the fourth quarter and full year respectively. Fair value accounting effects had unfavourable impacts of $55 million for the fourth quarter and favourable impacts of $63 million for the full year. The corresponding periods in 2010 reflected favourable fair value accounting effects of $134 million and $42 million respectively. The fourth quarter saw continued strong operations with our refinery utilization remaining well above the industry average. Compared with the same period last year, our result benefited from an improved contribution from supply and trading relative to the fourth-quarter loss in 2010 and our ability to access WTI-priced crude grades in the US, although the differentials for these grades narrowed compared with the third-quarter highs. These factors were offset, however, by a reduced refining margin environment, lower petrochemicals margins and foreign exchange impacts. For the full year, Refining and Marketing reported record earnings after adjusting for non-operating items and fair value accounting effects. Strong refinery operations enabled us to capture the benefits available in 2011 from BP’s location advantage in accessing WTI-based crude grades. Compared with 2010, the result also benefited from a higher refining margin environment and a stronger supply and trading contribution. These benefits were partly offset by a significantly higher level of turnarounds in 2011 than 2010, negative impacts from increased relative sweet crude prices in Europe and Australia, and the weather-related power outages in the second quarter. In the fuels business, financial performance in both the fourth quarter and full year was impacted by the factors noted above. Operational performance was strong, with Solomon refining availability at 95.3% for the fourth quarter and throughputs more than 30mb/d higher than the same period last year. Refining margins however declined in the fourth quarter, averaging $0.88/bbl lower than the same period last year. The US fuels environment was particularly impacted in the fourth quarter as refining margins reduced by more than 40% from the previous quarter and the differentials between WTI and Brent crude reduced significantly from their third-quarter highs. In December, Air BP announced the purchase of aviation fuels assets at seven Brazilian airports enabling the direct marketing of fuel to commercial airlines in these locations. The acquisition from Shell Brasil and Cosan Industria e Commercio, for consideration of approximately $100 million, is expected to be completed in the first quarter of 2012 subject to regulatory approvals. In addition BP intends to sell its bulk and bottled LPG marketing businesses in nine countries. Performance in our lubricants business in both the fourth quarter and full year was impacted by an increasingly difficult marketing environment characterized by significant base oil price increases and weaker demand. These impacts were partly offset by supply chain efficiencies, and the strength of our products and brands which has allowed the increased cost of goods to be largely recovered in the market. In our petrochemicals business, compared with 2010, the fourth-quarter result was impacted by weakening market conditions as additional Asian capacity has come onstream at a time of weaker demand. The full-year result benefited from the strength in aromatics margins and volumes in the first half of the year but this benefit was more than offset by weakening market conditions, as the year progressed. In November, BP and IndianOil signed a Memorandum of Understanding to explore the potential for establishing a 50:50 joint venture to invest in a 1-million tonne-per-annum acetic acid plant in Gujarat, with a targeted start-up date in 2015. The proposed plant would employ BP's latest Cativa® catalyst and technology, while the associated gasification facilities would utilize petroleum coke feedstock from IndianOil. BP also received local government approval for a 1.3-million tonne-per-annum PTA plant in Zhuhai, China in the fourth quarter and is now seeking final central government approval. Looking ahead, in line with the usual seasonal trend, we expect refining margins in the first quarter to be stronger than in the fourth quarter. We expect the differential between WTI and Brent crude to return eventually to lower levels as additional US pipeline capacity is brought online. The level of BP’s refinery turnaround activity is expected to be broadly similar in 2012 compared with 2011. We also expect the marketing environment in fuels, lubricants and petrochemicals to remain subdued given the outlook for global demand. 8
  • 9. Refining and Marketing Fourth Third Fourth quarter quarter quarter Year Year 2010 2011 2011 2011 2010 $ million Non-operating items (12) (184) (123) US (562) 352 98 (43) (17) Non-US (40) 278 86 (227) (140) (602) 630 Fair value accounting effects(a) 27 18 (41) US – 19 107 36 (14) Non-US 63 23 134 54 (55) 63 42 RC profit before interest and tax(b)(c) 402 994 194 Fuels 3,003 2,628 319 263 274 Lubricants 1,350 1,357 243 236 96 Petrochemicals 1,121 1,570 964 1,493 564 5,474 5,555 Non-operating items and fair value accounting effects(a) 258 (190) (206) Fuels (640) 381 (20) 16 11 Lubricants 100 (47) (18) 1 – Petrochemicals 1 338 220 (173) (195) (539) 672 Refining Marker Margin (RMM) ($/bbl)(d) 9.98 12.51 9.10 BP Average RMM 11.64 10.02 Refinery throughputs (mb/d) 1,343 1,371 1,352 US 1,277 1,350 777 776 790 Europe 771 775 300 283 312 Rest of World 304 301 2,420 2,430 2,454 Total throughput 2,352 2,426 94.9 95.3 95.3 Refining availability (%)(e) 94.8 95.0 Sales volumes (mb/d)(f) Marketing sales by region 1,415 1,411 1,409 US 1,401 1,433 1,379 1,353 1,302 Europe 1,305 1,402 597 592 607 Rest of World 605 610 3,391 3,356 3,318 Total marketing sales 3,311 3,445 2,485 2,358 2,515 Trading/supply sales 2,465 2,482 5,876 5,714 5,833 Total refined product sales 5,776 5,927 Petrochemicals production (kte) 1,046 1,127 1,001 US 4,029 4,146 894 955 864 Europe(c) 3,854 4,051 1,780 1,504 1,715 Rest of World 6,983 7,397 3,720 3,586 3,580 Total production 14,866 15,594 (a) Fair value accounting effects represent the favourable (unfavourable) impact relative to management’s measure of performance. For Refining and Marketing, these arise solely in the fuels business. Further information is provided on page 19. (b) Segment-level overhead expenses are included in the fuels business result. (c) BP’s share of income from petrochemicals at our Gelsenkirchen and Mulheim sites in Germany is reported in the fuels business result. (d) The RMM is the average of regional indicator margins weighted for BP’s crude refining capacity in each region. They may not be representative of the margins achieved by BP in any period because of BP’s particular refinery configurations and crude and product slate. The quarterly regional marker margins can be found on bp.com and are updated weekly. (e) Refining availability represents Solomon Associates’ operational availability, which is defined as the percentage of the year that a unit is available for processing after subtracting the annualized time lost due to turnaround activity and all planned mechanical, process and regulatory maintenance downtime. (f) Marketing sales do not include volumes relating to crude oil. 9
  • 10. Other businesses and corporate Fourth Third Fourth quarter quarter quarter Year Year 2010 2011 2011 2011 2010 $ million (537) (330) (1,072) Profit (loss) before interest and tax (2,463) (1,500) (13) – – Inventory holding (gains) losses (15) (16) Replacement cost profit (loss) before (550) (330) (1,072) interest and tax (2,478) (1,516) By region (225) (294) (580) US (1,230) (731) (325) (36) (492) Non-US (1,248) (785) (550) (330) (1,072) (2,478) (1,516) Results include Non-operating items (54) (112) (310) US (433) (238) (13) 188 (144) Non-US (389) 38 (67) 76 (454) (822) (200) Other businesses and corporate comprises the Alternative Energy business, Shipping, Treasury (which includes interest income on the group's cash and cash equivalents), and corporate activities worldwide. It also included the group’s aluminium business until its disposal during the third quarter of 2011. The replacement cost loss before interest and tax for the fourth quarter and full year was $1,072 million and $2,478 million respectively, compared with losses of $550 million and $1,516 million a year ago. The fourth quarter included a net non- operating charge of $454 million. A year ago, there was a net charge of $67 million. For the full year the net non-operating charge was $822 million, compared with a net charge of $200 million a year ago. In Alternative Energy, net wind generation capacity(a) at the end of the fourth quarter was 1,048MW (1,763MW gross), compared with 774MW (1,362MW gross) at the end of the same period a year ago. On 22 November, BP increased its share of Tropical BioEnergia S.A. to 100%, by acquiring the remaining 50% for cash consideration of $71 million. BP now owns and operates three producing ethanol mills in Brazil, with a total crush capacity(b) of 7.2 million tonnes per annum. At the end of 2011, BP began winding down its remaining solar operations as it prepares to exit the solar business. BP will take the necessary steps to transfer its obligations and assets to its affiliates or to third parties. Non-operating charges of $306 million for the fourth quarter and $687 million for the full year have been recognized with respect to raw materials purchase contracts. In 2012, we expect the quarterly loss, excluding non-operating items, for Other businesses and corporate to average around $500 million. As in previous years, this is likely to be volatile on an individual quarterly basis. (a) Net wind generation capacity is the sum of the rated capacities of the assets/turbines that have entered into commercial operation, including BP’s share of equity-accounted entities. The gross data is the equivalent capacity on a gross-JV basis, which includes 100% of the capacity of equity-accounted entities where BP has partial ownership. Capacity figures include 32MW in the Netherlands managed by our Refining and Marketing segment. (b) Crush capacity represents the maximum capacity of the plant to process biofuels feedstock. 10
  • 11. Cautionary statement Cautionary statement regarding forward-looking statements: The discussion in this results announcement contains forward-looking statements particularly those regarding the level of organic capital expenditure in 2012; the quarterly dividend payment; the timing of the removal from the Shoreline Clean-up Completion Plan of certain Gulf coast shoreline that was surveyed; the expected timing for the commencement of certain BP-funded early restoration projects; the amount of charges for provisions that could be provided in subsequent periods for items covered by the Trust with no net impact on the income statement; the expected level of production in the first quarter of 2012; the timing of the start-up date of an acetic acid plant in Gujarat in which BP may participate via a joint venture, the technology employed therein and the feedstock used in an associated gasification plant thereto; the level of refining margins in the first quarter of 2012; the level of refinery turnaround activity in 2012; expectations for the marketing environment in 2012; BP’s intention, in connection with its plans to exit the solar business, to transfer obligations and assets to its affiliates or to third parties; expectations for the level and volatility of quarterly losses in Other businesses and corporate; BP’s plans to file a timely appeal with respect to the Notification of Incidents of Noncompliance received on 7 December 2011; the anticipated filing of further lawsuits against BP or BP entities by the Mexican federal government; the commencement of investigations relating to the Deepwater Horizon oil spill by US federal agencies; the source of funding for BP’s $1-billion commitment to early restoration projects; the magnitude and timing of remaining remediation costs related to the Gulf of Mexico oil spill; the factors that could affect the magnitude of BP’s ultimate exposure and the cost to BP in relation to the spill and any potential mitigation resulting from BP’s partners or others involved in the spill; the potential liabilities resulting from pending and future legal proceedings and potential investigations and civil or criminal actions that US state and/or local governments could seek to take against BP as a result of the spill; the timing of claims and litigation outcomes and of payment of legal costs; contributions to and payments from the trust fund and the setting aside of assets while the fund is building; the estimated amount of legal fees in connection with the Gulf of Mexico oil spill; the timing for publication of investigation reports; the impact of BP’s potential liabilities relating to the Gulf of Mexico oil spill on the group, including its business, results and financial condition; the anticipated commencement of the Trial of Liability, Limitation, Exoneration, and Fault Allocation; the anticipated commencement of the trial regarding assertions of certain air emissions and reporting violations at the Texas City refinery; the anticipated commencement of the trial regarding allegations pertaining to the Atlantis platform; and the timing for an arbitration hearing regarding allegations by Apache Canada Ltd in connection with the July 2010 Purchase and Sale Agreement between Apache Canada Ltd and BP Canada Energy. By their nature, forward-looking statements involve risk and uncertainty because they relate to events and depend on circumstances that will or may occur in the future. Actual results may differ from those expressed in such statements, depending on a variety of factors including the timing of bringing new fields onstream; future levels of industry product supply; demand and pricing; OPEC quota restrictions; PSA effects; operational problems; general economic conditions; political stability and economic growth in relevant areas of the world; changes in laws and governmental regulations; regulatory or legal actions including the types of enforcement action pursued and the nature of remedies sought; the impact on our reputation following the Gulf of Mexico oil spill; exchange rate fluctuations; development and use of new technology; the success or otherwise of partnering; the actions of competitors, trading partners, creditors, rating agencies and others; natural disasters and adverse weather conditions; changes in public expectations and other changes to business conditions; wars and acts of terrorism or sabotage; and other factors discussed under “Principal risks and uncertainties” in our Form 6-K for the period ended 30 June 2011 and under “Risk factors” in our Annual Report and Form 20-F 2010 as filed with the US Securities and Exchange Commission (SEC). 11
  • 12. Group income statement Fourth Third Fourth quarter quarter quarter Year Year 2010 2011(a) 2011 2011 2010 $ million 79,703 95,383 93,441 Sales and other operating revenues (Note 5) 375,517 297,107 Earnings from jointly controlled entities – after 233 300 211 interest and tax 1,304 1,175 Earnings from associates – after interest 1,125 1,108 1,144 and tax 4,916 3,582 174 151 170 Interest and other income 596 681 2,753 790 1,377 Gains on sale of businesses and fixed assets 4,130 6,383 83,988 97,732 96,343 Total revenues and other income 386,463 308,928 58,339 73,825 71,791 Purchases 285,618 216,211 Production and manufacturing 7,522 7,809 3,628 expenses(b)(c) 24,145 64,615 1,524 2,021 2,072 Production and similar taxes (Note 6) 8,280 5,244 2,634 2,647 2,982 Depreciation, depletion and amortization 11,135 11,164 Impairment and losses on sale of businesses 1,201 211 405 and fixed assets 2,058 1,689 431 100 342 Exploration expense 1,520 843 3,409 3,693 3,910 Distribution and administration expenses(c) 13,958 12,555 23 (298) (166) Fair value (gain) loss on embedded derivatives (68) 309 8,905 7,724 11,379 Profit (loss) before interest and taxation 39,817 (3,702) 359 298 326 Finance costs(b) 1,246 1,170 Net finance income relating to (13) (64) (65) pensions and other post-retirement benefits (263) (47) 8,559 7,490 11,118 Profit (loss) before taxation 38,834 (4,825) 2,896 2,270 3,344 Taxation(b) 12,737 (1,501) 5,663 5,220 7,774 Profit (loss) for the period 26,097 (3,324) Attributable to 5,567 5,043 7,685 BP shareholders 25,700 (3,719) 96 177 89 Minority interest 397 395 5,663 5,220 7,774 26,097 (3,324) Earnings per share – cents (Note 7) Profit (loss) for the period attributable to BP shareholders 29.62 26.62 40.51 Basic 135.93 (19.81) 29.28 26.28 39.99 Diluted 134.29 (19.81) (a) Adjusted to include BP’s share of Pan American Energy LLC’s profit. See Note 4 on pages 28 – 30. (b) See Note 2 on pages 21 – 26 for further details of the impact of the Gulf of Mexico oil spill on the income statement line items. (c) Cash costs for the fourth quarter of 2011 increased significantly compared to the same period a year ago and reflected higher turnaround and related maintenance spend and rig standby costs in the Gulf of Mexico. Cash costs are a subset of production and manufacturing expenses plus distribution and administration expenses. They represent the substantial majority of the expenses in these line items but exclude associated non-operating items (including amounts relating to the Gulf of Mexico oil spill), and certain costs that are variable, primarily with volumes (such as freight costs). They are the principal operating and overhead costs that management considers to be most directly under their control although they include certain foreign exchange and commodity price effects. 12
  • 13. Group statement of comprehensive income Fourth Third Fourth quarter quarter quarter Year Year 2010 2011(a) 2011 2011 2010 $ million 5,663 5,220 7,774 Profit (loss) for the period 26,097 (3,324) 26 (1,483) (106) Currency translation differences (531) 259 Exchange (gains) losses on translation of foreign operations transferred to gain or loss (48) 6 – on sales of businesses and fixed assets 19 (20) Actuarial gain (loss) relating to pensions and (320) – (5,960) other post-retirement benefits (5,960) (320) Available-for-sale investments marked to 65 (338) 96 market (71) (191) Available-for-sale investments – recycled to (8) 2 – the income statement (3) (150) 20 (125) (24) Cash flow hedges marked to market 44 (65) Cash flow hedges – recycled to the income 16 (70) 3 statement (195) (25) Cash flow hedges – recycled to the balance 8 (4) (6) sheet (13) 53 Share of equity-accounted entities' – – (57) other comprehensive income, net of tax (57) – 121 6 1,601 Taxation 1,659 (137) (120) (2,006) (4,453) Other comprehensive income (expense) (5,108) (596) 5,543 3,214 3,321 Total comprehensive income (expense) 20,989 (3,920) Attributable to 5,449 3,049 3,243 BP shareholders 20,605 (4,318) 94 165 78 Minority interest 384 398 5,543 3,214 3,321 20,989 (3,920) (a) Adjusted to include BP’s share of Pan American Energy LLC’s profit. See Note 4 on pages 28 – 30. Group statement of changes in equity BP shareholders’ Minority Total equity interest equity $ million At 1 January 2011 94,987 904 95,891 Total comprehensive income 20,605 384 20,989 Dividends (4,072) (245) (4,317) Share-based payments (net of tax) (8) – (8) Transactions involving minority interests (47) (26) (73) At 31 December 2011 111,465 1,017 112,482 BP shareholders’ Minority Total equity interest equity $ million At 1 January 2010 101,613 500 102,113 Total comprehensive income (expense) (4,318) 398 (3,920) Dividends (2,627) (315) (2,942) Share-based payments (net of tax) 339 – 339 Transactions involving minority interests (20) 321 301 At 31 December 2010 94,987 904 95,891 13
  • 14. Group balance sheet 31 December 31 December 2011 2010(a) $ million Non-current assets Property, plant and equipment 119,214 110,163 Goodwill 12,100 8,598 Intangible assets 21,102 14,298 Investments in jointly controlled entities 15,518 14,927 Investments in associates 13,291 13,335 Other investments 2,117 1,191 Fixed assets 183,342 162,512 Loans 884 894 Other receivables 4,096 6,298 Derivative financial instruments 5,038 4,210 Prepayments 1,255 1,432 Deferred tax assets 611 528 Defined benefit pension plan surpluses 17 2,176 195,243 178,050 Current assets Loans 244 247 Inventories 25,661 26,218 Trade and other receivables 41,626 36,549 Derivative financial instruments 3,857 4,356 Prepayments 1,286 1,574 Current tax receivable 235 693 Other investments 288 1,532 Cash and cash equivalents 14,067 18,556 87,264 89,725 Assets classified as held for sale (Note 4) 8,420 4,487 95,684 94,212 Total assets 290,927 272,262 Current liabilities Trade and other payables 52,405 46,329 Derivative financial instruments 3,220 3,856 Accruals 5,932 5,612 Finance debt 9,044 14,626 Current tax payable 1,941 2,920 Provisions 9,338 9,489 81,880 82,832 Liabilities directly associated with assets classified as held for sale (Note 4) 538 1,047 82,418 83,879 Non-current liabilities Other payables 3,437 14,285 Derivative financial instruments 3,773 3,677 Accruals 389 637 Finance debt 35,169 30,710 Deferred tax liabilities 15,078 10,908 Provisions 26,163 22,418 Defined benefit pension plan and other post-retirement benefit plan deficits 12,018 9,857 96,027 92,492 Total liabilities 178,445 176,371 Net assets 112,482 95,891 Equity BP shareholders’ equity 111,465 94,987 Minority interest 1,017 904 112,482 95,891 (a) Adjusted following the termination of the Pan American Energy LLC sale agreement. See Note 4 on pages 28 – 30. 14
  • 15. Condensed group cash flow statement Fourth Third Fourth quarter quarter quarter Year Year 2010 2011(a) 2011 2011 2010 $ million Operating activities 8,559 7,490 11,118 Profit (loss) before taxation 38,834 (4,825) Adjustments to reconcile profit before taxation to net cash provided by operating activities Depreciation, depletion and amortization 2,877 2,674 3,083 and exploration expenditure written off 12,159 11,539 Impairment and (gain) loss on sale of (1,552) (579) (972) businesses and fixed assets (2,072) (4,694) Earnings from equity-accounted entities, (76) (687) 856 less dividends received (839) (1,480) Net charge for interest and other finance 5 15 (54) expense, less net interest paid (109) 139 72 128 (205) Share-based payments (88) 197 Net operating charge for pensions and other post-retirement benefits, less contributions (298) (106) (300) and benefit payments for unfunded plans (1,004) (959) 2,005 555 71 Net charge for provisions, less payments 835 19,217 Movements in inventories and other current (10,215) (372) (6,049) and non-current assets and liabilities(b) (17,527) 1,092 (1,555) (2,226) (2,538) Income taxes paid (8,035) (6,610) (178) 6,892 5,010 Net cash provided by (used in) operating activities 22,154 13,616 Investing activities (5,118) (4,146) (5,805) Capital expenditure(c) (17,845) (18,421) (8) (2,005) (3,018) Acquisitions, net of cash acquired (10,909) (2,468) (174) (171) (362) Investment in jointly controlled entities(c) (857) (461) (27) (6) (19) Investment in associates (55) (65) 2,555 447 1,396 Proceeds from disposal of fixed assets(d) 3,500 7,492 Proceeds from disposal of businesses, net of 4,818 1,627 (3,357) cash disposed(d)(e) (768) 9,462 109 63 87 Proceeds from loan repayments 301 501 2,155 (4,191) (11,078) Net cash provided by (used in) investing activities (26,633) (3,960) Financing activities 31 14 30 Net issue of shares 74 169 6,529 391 3,596 Proceeds from long-term financing 11,600 11,934 (1,963) (1,863) (1,515) Repayments of long-term financing (9,102) (4,702) (533) (145) 1,580 Net increase (decrease) in short-term debt 2,227 (3,619) – (1,225) (1,244) Dividends paid – BP shareholders (4,072) (2,627) (117) (80) (63) Dividends paid – Minority interest (245) (315) 3,947 (2,908) 2,384 Net cash provided by (used in) financing activities 482 840 Currency translation differences relating to (171) (545) (246) cash and cash equivalents (492) (279) Increase (decrease) in cash and cash 5,753 (752) (3,930) equivalents (4,489) 10,217 Cash and cash equivalents at beginning 12,803 18,749 17,997 of period 18,556 8,339 18,556 17,997 14,067 Cash and cash equivalents at end of period 14,067 18,556 (a) Adjusted to include BP’s share of Pan American Energy LLC’s profit. See Note 4 on pages 28 – 30. (b) Includes (1,445) 372 (101) Inventory holding (gains) losses (2,634) (1,784) 23 (298) (166) Fair value (gain) loss on embedded derivatives (68) 309 (6,542) (1,523) (5,965) Movements related to Gulf of Mexico oil spill response (13,264) 3,846 Inventory holding gains and losses and fair value gains and losses on embedded derivatives are also included within profit before taxation. See Note 2 for further information on the cash flow impacts of the Gulf of Mexico oil spill. (c) A minor amendment has been made to capital expenditure in each of the first, second and third quarters of 2011 with offsetting amendments to investment in jointly controlled entities, with no net effect on net cash used in investing activities. (d) Included in disposal proceeds are deposits received in respect of disposal transactions expected to complete in subsequent periods as follows: fourth quarter 2011 nil; third quarter 2011 nil; fourth quarter 2010 $4,947 million; full year 2011 $500 million; full year 2010 $9,992 million. For further information see Note 8. (e) Fourth quarter 2011 includes the repayment of the deposit of $3,530 million following the termination of the Pan American Energy LLC sale agreement as described in Note 4. 15
  • 16. Capital expenditure and acquisitions Fourth Third Fourth quarter quarter quarter Year Year 2010 2011 2011 2011 2010 $ million By business Exploration and Production 1,043 1,003 2,336 US(a)(b) 5,363 6,632 2,319 9,309 3,313 Non-US(c)(d)(e) 20,172 11,121 3,362 10,312 5,649 25,535 17,753 Refining and Marketing 755 729 713 US 2,590 2,761 610 356 656 Non-US 1,540 1,268 1,365 1,085 1,369 4,130 4,029 Other businesses and corporate 630 198 423 US(f) 877 977 104 63 204 Non-US(g) 976 257 734 261 627 1,853 1,234 5,461 11,658 7,645 31,518 23,016 By geographical area 2,428 1,930 3,472 US(a)(b)(f) 8,830 10,370 3,033 9,728 4,173 Non-US(c)(d)(e)(g) 22,688 12,646 5,461 11,658 7,645 31,518 23,016 Included above: 212 6,987 282 Acquisitions and asset exchanges(b)(c)(d)(g) 11,283 3,406 (a) Fourth quarter and year 2011 included $1,096 million associated with deepening our natural gas asset base. (b) Year 2010 included $1,767 million in the US deepwater Gulf of Mexico as part of the transaction with Devon Energy announced in first quarter 2010. (c) Third quarter, fourth quarter and year 2011 included $6,957 million, $69 million and $7,026 million respectively relating to the acquisition from Reliance Industries of interests in 21 oil and gas production-sharing agreements in India. See Note 3 for further details. (d) Year 2011 included $3,236 million in Brazil as part of the transaction with Devon Energy announced in first quarter 2010. Year 2010 included $1,107 million in Azerbaijan as part of the transaction with Devon Energy. (e) Year 2010 included $492 million for the purchase of additional interests in the Valhall and Hod fields in the North Sea, and $900 million relating to the formation of a partnership with Value Creation Inc. to develop the Terre de Grace oil sands acreage in the Athabasca region of Alberta, Canada. (f) Fourth quarter and year 2010 included capital expenditure of $390 million and $557 million respectively for wind turbines, which was incurred at the time for future wind projects. (g) Year 2011 included capital expenditure of $680 million in Brazil relating to the acquisition of CNAA. Exchange rates Fourth Third Fourth quarter quarter quarter Year Year 2010 2011 2011 2011 2010 1.58 1.61 1.57 US dollar/sterling average rate for the period 1.60 1.54 1.54 1.57 1.54 US dollar/sterling period-end rate 1.54 1.54 1.36 1.41 1.35 US dollar/euro average rate for the period 1.39 1.32 1.33 1.36 1.29 US dollar/euro period-end rate 1.29 1.33 16