SlideShare une entreprise Scribd logo
1  sur  24
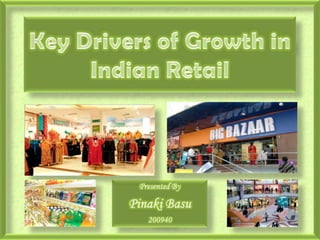
Key Drivers of Growth in Indian Retail Presented By Pinaki Basu 200940
Introduction An Overview of Indian Retail Industry Size of Indian Retail Industry :  	$ 390 Billion or ₹ 18,10,000 crore  Compounded Annual Growth Rate : 11.74% Source: F & R Research
Source: Source: F & R Research
Key Drivers
Consumer or Demand-Side Drivers Personal Consumption as a percentage of GDP Only second to Vietnam in Asia Fourth in the world China (~35%), Singapore (~45%), Hong Kong (~50%),  	South Korea (~46%) in 2007
Consumer or Demand-Side Drivers Population as a Growth Driver Source: censusindia.gov.in
Consumer or Demand-Side Drivers Population as a Growth Driver Adoption of Nuclear Family Culture Average Household Size in 1991 : 5.57 Average Household Size in 2001 : 5.36 Average Household Size in 2011 : 5.02 (Expected) Source: censusindia.gov.in
Consumer or Demand-Side Drivers Population as a Growth Driver Baby Boomer Effect Steep Growth in Earning Population (15-60 yrs) 335 million people (54 % of total population) in 1975 593 million people (58.3% of total population) in 2000 Growth in Earning Population over 25 yrs: 77%  ( CAGR of 2.3%) Growth in Indian Population over 25 yrs: 64% (CAGR of 2%) 782 million people (62.8% of total population) in 2015 (Expected) Source: censusindia.gov.in
Consumer or Demand-Side Drivers Population as a Growth Driver Growing Working Women Population  Working women can spend 1.3 times more than housewives Working women in 1991: 22% Working women in 2001: 26% Source: censusindia.gov.in
Consumer or Demand-Side Drivers Population as a Growth Driver Growth in Urban Population Urbanization has increased at a rate of 2.7 percent from 1991-2001 Urban population 2000 : 28.1 crore Expected to grow at 2.4% Source: censusindia.gov.in
Consumer or Demand-Side Drivers Plastic Money Becoming a Greater Pie of Credit India is the second fastest growing Financial Cards market in the Asia - Pacific region. Growth at 30-35% p.a. from 27mn cards in 2007.  Credit Card Sales: 1.2% in 2008 Credit Card Sales: 1.4% in 2010 	(Expected) Source: Euro Monitor (www.euromonitor.com)
Consumer or Demand-Side Drivers Internet Driving Awareness and Online Purchases  Source: Internet World Stats, Angel Research
Retailer or Supply-Side Drivers Increased Investments in Retail Organised Retail will possibly touch ₹ 2300 bn in 2010 Funds through Private Equity, IPO route and infusion of funds through warrants  Allow organised players in Retail to expand  Source: Ernst & Young (www.ey.com)
Retailer or Supply-Side Drivers Increased Investments in Retail At an average investment of ₹ 3,000 per sq. ft. by Retailers, these investments would translate to 750 mn sq. ft. of Organised Retail space by FY2010 All key Retailers in India have chalked out substantial investments over next 3-4 years to fuel their expansion plans.  Source: Ernst & Young (www.ey.com)
Retailer or Supply-Side Drivers Increased Investments in Retail Pantaloon is expected to invest around ₹ 6,000  cr over the next four years to fuel its three-fold expansion plan and take  its total Retail space to 26mn sq. ft. by FY2012.  	Vishal Retail is expected to invest ₹ 3,000cr to fuel its ambitious five-fold expansion plan to take its total Retail space to 10mn sq. ft. by FY2011. Source: Ernst & Young (www.ey.com)
Retailer or Supply-Side Drivers Tier- II & III cities to fuel future growth of Modern Retail The Top-784  cities in India constitute about 26% of population They contribute 35% to Total Retail Sales. Tier- II and III cities account for 18% of the overall population They contribute 22% to the Total Retail sales.
Retailer or Supply-Side Drivers  Shortened Supply Chain benefits consumers  A Traditional supply chain in India comprises 5-6 levels   Two major disadvantages:  Cost of the product increases Increase in shrinkage
Traditional v/s Modern supply chain  Company / Manufacturer Distributor 5% Margins for Distributors 5% Commission for Buying Agents Buying Agent Back End Franchisees Multi-Brand Outlets 30%  Margins for Franchisees Company owned outlets / large organized retailers 30-32%  Margins for company owned outlets/ large retailers 35%  Margins for Multi-Brand Outlet Retailers Consumers Front End
Traditional v/s Modern supply chain  Company / Manufacturer Back End 38-40%  Margins for Retailers Consumers Retailers Front End
Thank You

Contenu connexe

Tendances (20)

Big bazaar consumer behaviour
Big bazaar consumer behaviourBig bazaar consumer behaviour
Big bazaar consumer behaviour
 
Hul success in rural market
Hul success in rural marketHul success in rural market
Hul success in rural market
 
Big basket Supply Chain Management
Big basket Supply Chain ManagementBig basket Supply Chain Management
Big basket Supply Chain Management
 
Rural Products
Rural ProductsRural Products
Rural Products
 
Reliance trends
Reliance trendsReliance trends
Reliance trends
 
Pantaloons presentation
Pantaloons presentationPantaloons presentation
Pantaloons presentation
 
Non store retailing
Non store retailingNon store retailing
Non store retailing
 
pantaloons
pantaloonspantaloons
pantaloons
 
Zara
Zara Zara
Zara
 
Store Locations
Store LocationsStore Locations
Store Locations
 
D'mart supply chain management
D'mart supply chain managementD'mart supply chain management
D'mart supply chain management
 
Big Bazaar Retail store visit by manpreet singh Digital
Big Bazaar Retail store visit by manpreet singh DigitalBig Bazaar Retail store visit by manpreet singh Digital
Big Bazaar Retail store visit by manpreet singh Digital
 
Rural Marketing Strategies
Rural Marketing StrategiesRural Marketing Strategies
Rural Marketing Strategies
 
SUPPLY CHAIN MANAGEMENT OF BIG BAZAAR
SUPPLY CHAIN MANAGEMENT OF BIG  BAZAARSUPPLY CHAIN MANAGEMENT OF BIG  BAZAAR
SUPPLY CHAIN MANAGEMENT OF BIG BAZAAR
 
Rural marketing module 4
Rural marketing module 4Rural marketing module 4
Rural marketing module 4
 
Zudio Retail Marketing Presentation
Zudio Retail Marketing PresentationZudio Retail Marketing Presentation
Zudio Retail Marketing Presentation
 
Pantaloons - Retail Complete Study
Pantaloons - Retail Complete StudyPantaloons - Retail Complete Study
Pantaloons - Retail Complete Study
 
Retail theories
Retail theoriesRetail theories
Retail theories
 
Rreliance fresh
Rreliance freshRreliance fresh
Rreliance fresh
 
Retail presentation
Retail presentationRetail presentation
Retail presentation
 

Similaire à Key Drivers Of Growth In Indian Retail

Indiafmcgsectorreportaugust2013 140201042859-phpapp01
Indiafmcgsectorreportaugust2013 140201042859-phpapp01Indiafmcgsectorreportaugust2013 140201042859-phpapp01
Indiafmcgsectorreportaugust2013 140201042859-phpapp01Supa Buoy
 
Invest In India Consumer Fund - UTI Mutual Funds
Invest In India Consumer Fund - UTI Mutual FundsInvest In India Consumer Fund - UTI Mutual Funds
Invest In India Consumer Fund - UTI Mutual FundsRinkuMishra13
 

Similaire à Key Drivers Of Growth In Indian Retail (20)

FMCG Sector Report - July 2018
FMCG Sector Report - July 2018FMCG Sector Report - July 2018
FMCG Sector Report - July 2018
 
Fmcg Sector Report - April 2018
Fmcg Sector Report - April 2018Fmcg Sector Report - April 2018
Fmcg Sector Report - April 2018
 
Indiafmcgsectorreportaugust2013 140201042859-phpapp01
Indiafmcgsectorreportaugust2013 140201042859-phpapp01Indiafmcgsectorreportaugust2013 140201042859-phpapp01
Indiafmcgsectorreportaugust2013 140201042859-phpapp01
 
India : Fmcg august 2013
India : Fmcg   august 2013India : Fmcg   august 2013
India : Fmcg august 2013
 
Fmcg Sector Report - June 2018
Fmcg Sector Report - June 2018Fmcg Sector Report - June 2018
Fmcg Sector Report - June 2018
 
FMCG Sector Report - March 2019
FMCG Sector Report - March 2019FMCG Sector Report - March 2019
FMCG Sector Report - March 2019
 
FMCG Sector Report May 2018
FMCG Sector Report May 2018FMCG Sector Report May 2018
FMCG Sector Report May 2018
 
FMCG Sector Report March 2018
FMCG Sector Report March 2018FMCG Sector Report March 2018
FMCG Sector Report March 2018
 
Invest In India Consumer Fund - UTI Mutual Funds
Invest In India Consumer Fund - UTI Mutual FundsInvest In India Consumer Fund - UTI Mutual Funds
Invest In India Consumer Fund - UTI Mutual Funds
 
FMCG Sector Report - October 2018
FMCG Sector Report - October 2018FMCG Sector Report - October 2018
FMCG Sector Report - October 2018
 
FMCG Sector Report September 2017
FMCG Sector Report September 2017FMCG Sector Report September 2017
FMCG Sector Report September 2017
 
FMCG Sector Report - December 2018
FMCG Sector Report - December 2018FMCG Sector Report - December 2018
FMCG Sector Report - December 2018
 
FMCG Sector Report - September 2018
FMCG Sector Report - September 2018FMCG Sector Report - September 2018
FMCG Sector Report - September 2018
 
FMCG Sector Report - February 2019
FMCG Sector Report - February 2019FMCG Sector Report - February 2019
FMCG Sector Report - February 2019
 
FMCG Sector Report - August 2018
FMCG Sector Report - August 2018FMCG Sector Report - August 2018
FMCG Sector Report - August 2018
 
FMCG Sector Report June 2017
FMCG Sector Report June 2017FMCG Sector Report June 2017
FMCG Sector Report June 2017
 
FMCG Sector Report October 2017
FMCG Sector Report October 2017FMCG Sector Report October 2017
FMCG Sector Report October 2017
 
FMCG Sector Report - April 2019
FMCG Sector Report - April 2019FMCG Sector Report - April 2019
FMCG Sector Report - April 2019
 
FMCG Sector Report - January 2019
FMCG Sector Report - January 2019FMCG Sector Report - January 2019
FMCG Sector Report - January 2019
 
FMCG Sector Report - November 2018
FMCG Sector Report - November 2018FMCG Sector Report - November 2018
FMCG Sector Report - November 2018
 

Plus de Pinaki Basu

PGDM in Marketing & Finance with 6.5+ Years Experience in Corporate Marketing...
PGDM in Marketing & Finance with 6.5+ Years Experience in Corporate Marketing...PGDM in Marketing & Finance with 6.5+ Years Experience in Corporate Marketing...
PGDM in Marketing & Finance with 6.5+ Years Experience in Corporate Marketing...Pinaki Basu
 
Impact of Celebrity on Brand Acceptance & Perception
Impact of Celebrity on Brand Acceptance & PerceptionImpact of Celebrity on Brand Acceptance & Perception
Impact of Celebrity on Brand Acceptance & PerceptionPinaki Basu
 
Congruence of Eco Friendly Brand Image and Employee Retention
Congruence of Eco Friendly Brand Image and Employee RetentionCongruence of Eco Friendly Brand Image and Employee Retention
Congruence of Eco Friendly Brand Image and Employee RetentionPinaki Basu
 
Role Of RFID In Logistics
Role Of RFID In LogisticsRole Of RFID In Logistics
Role Of RFID In LogisticsPinaki Basu
 
Management Information System
Management Information SystemManagement Information System
Management Information SystemPinaki Basu
 
Guerrilla Marketing
Guerrilla MarketingGuerrilla Marketing
Guerrilla MarketingPinaki Basu
 
Reinventing Bisleri
Reinventing BisleriReinventing Bisleri
Reinventing BisleriPinaki Basu
 

Plus de Pinaki Basu (7)

PGDM in Marketing & Finance with 6.5+ Years Experience in Corporate Marketing...
PGDM in Marketing & Finance with 6.5+ Years Experience in Corporate Marketing...PGDM in Marketing & Finance with 6.5+ Years Experience in Corporate Marketing...
PGDM in Marketing & Finance with 6.5+ Years Experience in Corporate Marketing...
 
Impact of Celebrity on Brand Acceptance & Perception
Impact of Celebrity on Brand Acceptance & PerceptionImpact of Celebrity on Brand Acceptance & Perception
Impact of Celebrity on Brand Acceptance & Perception
 
Congruence of Eco Friendly Brand Image and Employee Retention
Congruence of Eco Friendly Brand Image and Employee RetentionCongruence of Eco Friendly Brand Image and Employee Retention
Congruence of Eco Friendly Brand Image and Employee Retention
 
Role Of RFID In Logistics
Role Of RFID In LogisticsRole Of RFID In Logistics
Role Of RFID In Logistics
 
Management Information System
Management Information SystemManagement Information System
Management Information System
 
Guerrilla Marketing
Guerrilla MarketingGuerrilla Marketing
Guerrilla Marketing
 
Reinventing Bisleri
Reinventing BisleriReinventing Bisleri
Reinventing Bisleri
 

Key Drivers Of Growth In Indian Retail

  • 1. Key Drivers of Growth in Indian Retail Presented By Pinaki Basu 200940
  • 2. Introduction An Overview of Indian Retail Industry Size of Indian Retail Industry : $ 390 Billion or ₹ 18,10,000 crore Compounded Annual Growth Rate : 11.74% Source: F & R Research
  • 3. Source: Source: F & R Research
  • 4. Source: Source: F & R Research
  • 6. Consumer or Demand-Side Drivers Personal Consumption as a percentage of GDP Only second to Vietnam in Asia Fourth in the world China (~35%), Singapore (~45%), Hong Kong (~50%), South Korea (~46%) in 2007
  • 7. Consumer or Demand-Side Drivers Population as a Growth Driver Source: censusindia.gov.in
  • 8. Consumer or Demand-Side Drivers Population as a Growth Driver Adoption of Nuclear Family Culture Average Household Size in 1991 : 5.57 Average Household Size in 2001 : 5.36 Average Household Size in 2011 : 5.02 (Expected) Source: censusindia.gov.in
  • 9. Consumer or Demand-Side Drivers Population as a Growth Driver Baby Boomer Effect Steep Growth in Earning Population (15-60 yrs) 335 million people (54 % of total population) in 1975 593 million people (58.3% of total population) in 2000 Growth in Earning Population over 25 yrs: 77% ( CAGR of 2.3%) Growth in Indian Population over 25 yrs: 64% (CAGR of 2%) 782 million people (62.8% of total population) in 2015 (Expected) Source: censusindia.gov.in
  • 10. Consumer or Demand-Side Drivers Population as a Growth Driver Growing Working Women Population Working women can spend 1.3 times more than housewives Working women in 1991: 22% Working women in 2001: 26% Source: censusindia.gov.in
  • 11. Consumer or Demand-Side Drivers Population as a Growth Driver Growth in Urban Population Urbanization has increased at a rate of 2.7 percent from 1991-2001 Urban population 2000 : 28.1 crore Expected to grow at 2.4% Source: censusindia.gov.in
  • 12.
  • 13. Consumer or Demand-Side Drivers Plastic Money Becoming a Greater Pie of Credit India is the second fastest growing Financial Cards market in the Asia - Pacific region. Growth at 30-35% p.a. from 27mn cards in 2007. Credit Card Sales: 1.2% in 2008 Credit Card Sales: 1.4% in 2010 (Expected) Source: Euro Monitor (www.euromonitor.com)
  • 14. Consumer or Demand-Side Drivers Internet Driving Awareness and Online Purchases Source: Internet World Stats, Angel Research
  • 15. Retailer or Supply-Side Drivers Increased Investments in Retail Organised Retail will possibly touch ₹ 2300 bn in 2010 Funds through Private Equity, IPO route and infusion of funds through warrants Allow organised players in Retail to expand Source: Ernst & Young (www.ey.com)
  • 16. Retailer or Supply-Side Drivers Increased Investments in Retail At an average investment of ₹ 3,000 per sq. ft. by Retailers, these investments would translate to 750 mn sq. ft. of Organised Retail space by FY2010 All key Retailers in India have chalked out substantial investments over next 3-4 years to fuel their expansion plans. Source: Ernst & Young (www.ey.com)
  • 17. Retailer or Supply-Side Drivers Increased Investments in Retail Pantaloon is expected to invest around ₹ 6,000 cr over the next four years to fuel its three-fold expansion plan and take its total Retail space to 26mn sq. ft. by FY2012. Vishal Retail is expected to invest ₹ 3,000cr to fuel its ambitious five-fold expansion plan to take its total Retail space to 10mn sq. ft. by FY2011. Source: Ernst & Young (www.ey.com)
  • 18. Retailer or Supply-Side Drivers Tier- II & III cities to fuel future growth of Modern Retail The Top-784 cities in India constitute about 26% of population They contribute 35% to Total Retail Sales. Tier- II and III cities account for 18% of the overall population They contribute 22% to the Total Retail sales.
  • 19. Retailer or Supply-Side Drivers Shortened Supply Chain benefits consumers A Traditional supply chain in India comprises 5-6 levels Two major disadvantages: Cost of the product increases Increase in shrinkage
  • 20. Traditional v/s Modern supply chain Company / Manufacturer Distributor 5% Margins for Distributors 5% Commission for Buying Agents Buying Agent Back End Franchisees Multi-Brand Outlets 30% Margins for Franchisees Company owned outlets / large organized retailers 30-32% Margins for company owned outlets/ large retailers 35% Margins for Multi-Brand Outlet Retailers Consumers Front End
  • 21. Traditional v/s Modern supply chain Company / Manufacturer Back End 38-40% Margins for Retailers Consumers Retailers Front End
  • 22.
  • 23.