3. Clients, Lecturing & Press Coverage
Usability Testing
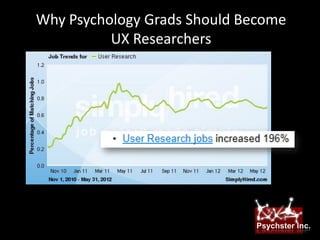
User Research
Lecturing & Training
Press Coverage
4. Skills you Didn’t Know You Had
A survey that reveals what Individual interviews remotely or in
attributes are associated a laboratory designed to increase
with what brands. the usability of an interface.
Correspondence
Usability Testing
Analysis
A special analysis that
shows whether new
A quantitative scoring of
product features delight
Kano Analysis Heuristic Analysis common usability problems
users or are seen as
performed by a interface
necessities.
expert.
Psychographic
Scenario
Segmentation
Experiments
A survey where you measure
reactions to multivariate strategies The statistical derivation of
by randomly assigning people to clusters of users with similar wants
view embedded videos. and needs.
6. Usability Methods Through the Development Cycle
• You Have Text: marketing pitch, • You Have Static Images: wireframes
technology description, wireframes
• Can Learn: findability, expectation
• Can Learn: needs, value-proposition gaps, comprehension gaps
(concept acceptance), re-invention,
• Techniques: walkthroughs, paper
taxonomies
prototyping, qualitative usability
• Techniques: ethnography, focus testing
groups, card sorting, surveys
Requirements
Gathering, Design
Business Case
Launch “Design Complete”
• You Have a Launch-Ready or
Already-Launched Build Testing Development •You Have an Interactive Build:
• Can Learn: performance, bugs, •flash, sketchflow, test build
requirements for next rev, •Can Learn: goal attainment
comparison •Techniques: quantitative
• Techniques: qualitative and usability testing
quantitative usability testing; •success, clicks,
time, paths,
subjective rating
8. Heuristic Analysis
A quantitative scoring of common usability problems
performed by a interface expert.
• Psychster Inc. developed an
online scoring tool for MS that
quantitatively scores usability
for tracking over time.
• Faster and cheaper than
interviews.
• Uses a checklist from Forrester,
Psychster, and 4 years of MS
operations research.
• Outputs results for bug fixing.
http://easyaudit.cloudapp.net
9. Psychographic Segmentation
The statistical derivation of clusters of users with similar wants
and needs from your business.
The Survey: 1-5
ratings of how
important
people find
every value
proposition of
your business,
or every feature
of your media.
Factor Analysis: 1. Status updates/photos
Reveals “basic 2. Info/news
3. App content
hooks.” 4. Profile management
Cluster Analysis:
Reveals groups
of similar users.
10. Scenario Experiments
A survey where you measure reactions to different strategies by
randomly assigning people to view embedded videos.
11. Kano Analysis
An analysis technique that informs new product creation.
• Kano analysis teases 4.0 Things at the
Primary Satisfiers
Differentiators Store
apart two dimensions of
features: whether they Cookbooks
3.5
delight users or are seen Cooking Charts
as a necessity.
delight 3.0 Stencils
• Four quadrants are Party Kit
Invitations
created, which help to Party Kit with
better understand 2.5 Music.
Place-cards
Menus this Dish?’
‘What’s
product positioning.
2.0
1.5 Indifferent Expected Must Haves
1.5 2 2.5 3 3.5 4
necessity