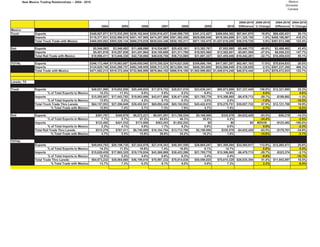
2. New Mexico Trading Relationships -- 2004 - 2010 Mexico
Domestic
Canada
2009-2010 2009-2010 2004-2010 2004-2010
2004 2005 2006 2007 2008 2009 2010 Difference % Change Difference % Change
Eagle Pass, TX
Truck Exports $1,319,148 $13,206,290 $14,511,788 $1,096,096 $247,984 $260,399 $230,726 -$29,673 -11.4% -$1,088,422 -82.5%
% of Total Exports to Mexico 0.4% 7.7% 6.1% 0.3% 0.1% 0.1% 0.1% 0.0% -0.3%
Imports $567,620 $383,604 $147,908 $684,927 $1,446,023 $305,998 $60,148 -$245,850 -80.3% -$507,472 -89.4%
% of Total Imports to Mexico 0.5% 0.1% 0.0% 0.1% 0.2% 0.0% 0.0% 0.0% -0.5%
Total Truck Trade Thru Eagle Pass $1,886,768 $13,589,894 $14,659,696 $1,781,023 $1,694,007 $566,397 $290,874 -$275,523 -48.6% -$1,595,894 -84.6%
% Total Trade with Mexico 0.4% 2.7% 2.1% 0.2% 0.2% 0.1% 0.0% 0.0% -0.4%
Rail Exports $262,928 $58,684 $1,050,652 $1,181,239 $3,379,657 $2,200,867 $1,974,682 -$226,185 -10.3% $1,711,754 651.0%
% of Total Exports to Mexico 4.7% 1.7% 9.1% 8.1% 13.3% 16.4% 24.8% 8.4% 20.1%
Imports $0 $0 $0 $0 $1,654,451 $39,575 $155,733 $116,158 293.5% $155,733 #DIV/0!
% of Total Imports to Mexico 0.0% 0.0% 0.0% 0.0% 5.3% 0.2% 1.2% 0.9% 1.2%
Total Rail Trade Thru Eagle Pass $262,928 $58,684 $1,050,652 $1,181,239 $5,034,108 $2,240,442 $2,130,415 -$110,027 -4.9% $1,867,487 710.3%
% Total Trade with Mexico 2.4% 0.4% 2.5% 2.4% 8.9% 7.0% 9.9% 2.9% 7.5%
TOTAL
Exports $1,582,076 $13,264,974 $15,562,440 $2,277,335 $3,627,641 $2,461,266 $2,205,408 -$255,858 -10.4% $623,332 39.4%
% of Total Exports to Mexico 0.5% 7.5% 6.2% 0.6% 1.0% 0.7% 0.5% -0.2% 0.1%
Imports $567,620 $383,604 $147,908 $684,927 $3,100,474 $345,573 $215,881 -$129,692 -37.5% -$351,739 -62.0%
% of Total Imports to Mexico 0.5% 0.1% 0.0% 0.1% 0.5% 0.1% 0.0% 0.0% -0.4%
Total Trade Thru Eagle Pass $2,149,696 $13,648,578 $15,710,348 $2,962,262 $6,728,115 $2,806,839 $2,421,289 -$385,550 -13.7% $271,593 12.6%
% Total Trade with Mexico 0.5% 2.6% 2.1% 0.3% 0.7% 0.3% 0.2% 0.0% -0.2%
Del Rio, TX
Truck Exports $395,095 $9,995,039 $9,928,847 $15,850,374 $7,477,264 $438,055 $598,893 $160,838 36.7% $203,798 51.6%
% of Total Exports to Mexico 0.1% 5.8% 4.2% 4.5% 2.1% 0.1% 0.1% 0.0% 0.0%
Imports $61,631 $150,542 $588,502 $64,335 $54,030 $66,572 $0 -$66,572 -100.0% -$61,631 -100.0%
% of Total Imports to Mexico 0.1% 0.0% 0.0% 0.0% 0.0% 0.0% 0.0% 0.0% -0.1%
Total Truck Trade Thru Del Rio $456,726 $10,145,581 $10,517,349 $15,914,709 $7,531,294 $504,627 $598,893 $94,266 18.7% $142,167 31.1%
% Total Trade with Mexico 0.1% 2.0% 1.5% 1.9% 0.8% 0.1% 0.1% 0.0% 0.0%
Rail Exports $0 $0 $0 #DIV/0! $0 #DIV/0!
% of Total Exports to Mexico 0.0% 0.0% #DIV/0! #DIV/0! #DIV/0! #DIV/0! #DIV/0! #DIV/0!
Imports $0 $0 $0 #DIV/0! $0 #DIV/0!
% of Total Imports to Mexico 0.0% 0.0% #DIV/0! #DIV/0! #DIV/0! #DIV/0! #DIV/0! #DIV/0!
Total Rail Trade Thru Del Rio $0 $0 $0 #DIV/0! $0 #DIV/0!
% Total Trade with Mexico 0.0% 0.0% 0.0% 0.0% 0.0% 0.0% 0.0% 0.0%
TOTAL
Exports $395,095 $9,995,039 $9,928,847 $15,850,374 $7,477,264 $438,055 $598,893 $160,838 36.7% $203,798 51.6%
% of Total Exports to Mexico 0.1% 5.7% 51.8% 4.3% 2.0% 0.1% 0.1% 0.0% 0.0%
Imports $61,631 $150,542 $588,502 $64,335 $54,030 $66,572 $0 -$66,572 -100.0% -$61,631 -100.0%
% of Total Imports to Mexico 0.0% 0.0% 0.1% 0.0% 0.0% 0.0% 0.0% 0.0% 0.0%
Total Trade Thru Del Rio $456,726 $10,145,581 $10,517,349 $15,914,709 $7,531,294 $504,627 $598,893 $94,266 18.7% $142,167 31.1%
% Total Trade with Mexico 0.1% 2.0% 22.8% 3.1% 1.2% 0.1% 0.1% 0.0% 0.0%
3. New Mexico Trading Relationships -- 2004 - 2010 Mexico
Domestic
Canada
2009-2010 2009-2010 2004-2010 2004-2010
2004 2005 2006 2007 2008 2009 2010 Difference % Change Difference % Change
GPITC
Truck Exports $50,366,239 $43,054,185 $44,890,490 $34,821,222 $36,356,264 $24,334,695 $61,803,305 $37,468,610 154.0% $11,437,066 22.7%
% of Total Exports to Mexico 14.8% 25.0% 18.8% 9.8% 10.4% 7.1% 15.1% 8.0% 0.3%
Imports $16,135,208 $17,977,939 $19,739,476 $43,766,948 $37,971,089 $22,158,348 $15,366,213 -$6,792,135 -30.7% -$768,995 -4.8%
% of Total Imports to Mexico 13.5% 5.4% 4.4% 9.2% 6.5% 3.5% 2.5% -1.0% -11.0%
Total Truck Trade Thru GPITC $66,501,447 $61,032,124 #REF! $78,588,170 $74,327,353 $46,493,043 $77,169,518 $30,676,475 66.0% $10,668,071 16.0%
% Total Trade with Mexico 14.5% 12.1% #REF! 9.5% 8.0% 4.8% 7.5% 2.7% -6.9%
Rail Exports $654,725 $404,563 $7,622,873 $10,722,830 $15,140,191 $7,368,873 $2,310,260 -$5,058,613 -68.6% $1,655,535 252.9%
% of Total Exports to Mexico 11.8% 11.4% 66.4% 73.8% 59.6% 55.0% 29.0% -26.0% 17.2%
Imports $123,482 $421,532 $173,868 $563,203 $3,606,703 $39,575 $155,733 $116,158 293.5% $32,251 26.1%
% of Total Imports to Mexico 2.3% 4.1% 0.6% 1.7% 11.5% 0.2% 1.2% 0.9% -1.1%
Total Rail Trade Thru GPITC $778,207 $826,095 $7,796,741 $11,286,033 $18,746,894 $7,408,448 $2,465,993 -$4,942,455 -66.7% $1,687,786 216.9%
% Total Trade with Mexico 7.1% 6.0% 18.2% 23.2% 33.0% 23.2% 11.5% -11.7% 4.4%
TOTAL
Exports $51,020,964 $43,458,748 $52,513,363 $45,544,052 $51,496,455 $31,703,568 $64,113,565 $32,409,997 102.2% $13,092,601 25.7%
% of Total Exports to Mexico 14.7% 24.7% 21.0% 12.3% 13.8% 8.9% 15.4% 6.4% 0.6%
Imports $16,258,690 $18,399,471 $19,913,344 $44,330,151 $41,577,792 $22,197,923 $15,521,946 -$6,675,977 -30.1% -$736,744 -4.5%
% of Total Imports to Mexico 13.0% 5.4% 4.1% 8.7% 6.8% 3.4% 2.5% -1.0% -10.6%
Total Trade Thru GPITC $67,279,654 $61,858,219 $72,426,707 $89,874,203 $93,074,247 $53,901,491 $79,635,511 $25,734,020 47.7% $12,355,857 18.4%
% Total Trade with Mexico 14.3% 11.9% 9.9% 10.2% 9.4% 5.4% 7.6% 2.2% -6.7%
4. New Mexico Trading Relationships -- 2004 - 2010 Mexico
Domestic
Canada
2010 Leading Exports from New Mexico to Mexico (Surface 2010 2010 Leading Exports from New Mexico to Mexico (Surface 2010
Transportation) Transportation)
Rank Export Rank Coahuila Export
1 84 Computer-Related Machinery and Parts $132,039,476 1 84 Computer-Related Machinery and Parts $18,398,264
2 85 Electrical Machinery; Equipment and Parts $73,501,957 2 90 Measuring and Testing Instruments $1,819,474
3 39 Plastics and Articles $38,279,433 3 12 Oil Seeds and Oleaginous Fruits $1,472,240
4 73 Articles of Iron and Steel $34,853,079 4 26 Ores; Slag and Ash $263,000
5 90 Measuring and Testing Instruments $17,929,009 5 87 Vehicles Other than Railway $162,391
6 17 Sugars and Sugar Confectionery $14,373,739 6 85 Electrical Machinery; Equipment and Parts $26,650
7 76 Aluminum and Articles $13,863,478 7 59 Impregnated Fabrics $17,704
8 4 Dairy Products $13,842,617 8 40 Rubber and Articles $12,094
9 87 Vehicles Other than Railway $13,667,919 9 17 Sugars and Sugar Confectionery $4,284
10 48 Paper and Paperboard $10,306,789 10 28 Inorganic Chemicals 3,900
2010 Leading Imports to New Mexico from Mexico (Surface 2010
Rank Import 2010 Leading Exports from New Mexico to Mexico (Surface 2010
1 84 Computer-Related Machinery and Parts $223,371,676 Rank Nuevo Leon Export
2 85 Electrical Machinery; Equipment and Parts $157,526,291 1 84 Computer-Related Machinery and Parts $4,456,494
3 1 Live Animals $67,436,090 2 85 Electrical Machinery; Equipment and Parts $3,023,915
4 90 Measuring and Testing Instruments $37,643,904 3 31 Fertilizers $1,615,065
5 7 Edible Vegetables and Roots $30,117,685 4 48 Paper and Paperboard $330,210
6 8 Edible Fruit and Nuts $21,265,830 5 72 Iron and Steel $203,332
7 39 Plastics and Articles $19,811,364 6 39 Plastics and Articles $161,447
8 87 Vehicles Other than Railway $19,421,595 7 81 Other Base Metals and Cermets $41,283
9 98 Special Classification Provisions $16,462,934 8 71 Pearls; Stones; Metals and Imitation Jewelry $24,955
10 73 Articles of Iron and Steel $12,539,002 9 12 Oil Seeds and Oleaginous Fruits $19,550
10 38 Miscellaneous Chemical Products $17,959
2010 Leading Exports from New Mexico to Mexico (Surface 2010
Rank Tamaulipas Export
1 10 Cereals $106,920
2 87 Vehicles Other than Railway $18,209
3 84 Computer-Related Machinery and Parts $8,401
4 98 Special Classification Provisions $8,190
5 17 Sugars and Sugar Confectionery $5,984
6
7
8
9
10
7. New Mexico Trading Relationships -- 2004 - 2010 Mexico
Domestic
Canada
2009-2010 2009-2010 2004-2010 2004-2010
2004 2005 2006 2007 2008 2009 2010 Difference % Change Difference % Change
Sweet Grass, MT
Truck Exports $18,262,975 $26,082,684 $35,908,907 $38,888,227 $34,837,491 $23,862,243 $26,105,636 $2,243,393 9.4% $7,842,661 42.9%
% of Total Exports to Canada 22.2% 27.1% 28.4% 25.6% 18.7% 20.8% 23.6% 2.8% 1.4%
Imports $22,495,813 $29,364,205 $38,309,956 $31,715,867 $44,987,168 $27,505,196 $39,705,785 $12,200,589 44.4% $17,209,972 76.5%
% of Total Exports to Canada 18.8% 20.4% 24.2% 15.7% 19.8% 23.1% 23.0% -0.1% 4.2%
Total Truck Trade Thru Sweet Grass 40,758,788 $55,446,889 $74,218,863 $70,604,094 $79,824,659 $51,367,439 $65,811,421 $14,443,982 28.1% $25,052,633 61.5%
% Total Trade with Canada 20.2% 23.1% 26.0% 20.0% 19.3% 22.0% 23.2% 1.3% 3.0%
Rail Exports $162,949 $298,448 $16,162,745 $36,170,236 $78,437,092 $66,453,389 $74,096,637 $7,643,248 11.5% $73,933,688 45372.3%
% of Total Exports to Canada 5.0% 3.2% 66.8% 77.9% 70.5% 60.5% 51.2% -9.3% 46.2%
Imports $17,116,782 $9,397,459 $2,795,297 $3,447,595 $3,571,106 $2,034,905 $836,398 -$1,198,507 -58.9% -$16,280,384 -95.1%
% of Total Exports to Canada 13.2% 12.0% 6.1% 7.7% 8.5% 14.4% 6.4% -8.0% -6.8%
Total Rail Trade Thru Sweet Grass $17,279,731 $9,695,907 $18,958,042 $39,617,831 $82,008,198 $68,488,294 $74,933,035 $6,444,741 9.4% $57,653,304 333.6%
% Total Trade with Canada 13.0% 11.1% 27.1% 43.5% 53.5% 55.2% 47.4% -7.8% 34.5%
TOTAL
Exports $18,425,924 $26,381,132 $52,071,652 $75,058,463 $113,274,583 $90,315,632 $100,202,273 $9,886,641 10.9% $81,776,349 443.8%
% of Total Exports to Canada 21.6% 25.0% 34.5% 37.8% 38.1% 40.2% 39.2% -1.0% 17.7%
Imports $39,612,595 $38,761,664 $41,105,253 $35,163,462 $48,558,274 $29,540,101 $40,542,183 $11,002,082 37.2% $929,588 2.3%
% of Total Imports to Canada 15.9% 17.5% 20.1% 14.3% 18.1% 22.2% 21.8% -0.4% 5.9%
Total Trade Thru Sweet Grass $58,038,519 $65,142,796 $93,176,905 $110,221,925 $161,832,857 $119,855,733 $140,744,456 $20,888,723 17.4% $82,705,937 142.5%
% Total Trade with Canada 17.3% 19.9% 26.2% 24.8% 28.6% 33.5% 31.9% -1.6% 14.6%
Portal, ND
Truck Exports $1,739,027 $756,937 $505,984 $331,616 $7,263,454 $3,081,802 $2,125,686 -$956,116 -31.0% $386,659 22.2%
% of Total Exports to Canada 2.1% 0.8% 0.4% 0.2% 3.9% 2.7% 1.9% -0.8% -0.2%
Imports $3,410,593 $2,101,949 $1,750,655 $2,095,330 $643,624 $1,303,458 $302,708 -$1,000,750 -76.8% -$3,107,885 -91.1%
% of Total Imports to Canada 2.8% 1.5% 1.1% 1.0% 0.3% 1.1% 0.2% -0.9% -2.7%
Total Truck Trade Thru Portal $5,149,620 $2,858,886 $2,256,639 $2,426,946 $7,907,078 $4,385,260 $2,428,394 -$1,956,866 -44.6% -$2,721,226 -52.8%
% Total Trade with Canada 2.5% 1.2% 0.8% 0.7% 1.9% 1.9% 0.9% -1.0% -1.7%
Rail Exports $13,559 $13,272 $113,438 $29,977 $23,956 $2,464,994 $156,209 $42,771 -93.7% $142,650 1052.1%
% of Total Exports to Canada 0.4% 0.1% 0.5% 0.1% 0.0% 2.2% 0.1% -2.1% -0.3%
Imports $56,055 $193,069 $55,321 $40,767 $89,251 $105,655 $14,914 -$40,407 -85.9% -$41,141 -73.4%
% of Total Imports to Canada 0.0% 0.2% 0.1% 0.1% 0.2% 0.7% 0.1% -0.6% 0.1%
Total Rail Trade Thru Portal $69,614 $206,341 $168,759 $70,744 $113,207 $2,570,649 $171,123 $2,364 -93.3% $101,509 145.8%
% Total Trade with Canada 0.1% 0.2% 0.2% 0.1% 0.1% 2.1% 0.1% -2.0% 0.1%
TOTAL
Exports $1,752,586 $770,209 $505,984 $331,616 $7,263,454 $3,081,802 $2,125,686 -$956,116 -31.0% $529,309 21.3%
% of Total Exports to Canada 2.0% 0.7% 0.3% 0.2% 2.4% 1.4% 0.8% -0.5% -1.2%
Imports $3,466,648 $2,295,018 $1,805,976 $2,136,097 $732,875 $1,409,113 $317,622 -$1,091,491 -77.5% -$3,149,026 -90.8%
% of Total Imports to Canada 1.4% 1.0% 0.9% 0.9% 0.3% 1.1% 0.2% -0.9% -1.2%
Total Trade Thru Portal $5,219,234 $3,065,227 $2,311,960 $2,467,713 $7,996,329 $4,490,915 $2,443,308 -$2,047,607 -45.6% -$2,619,717 -53.2%
% Total Trade with Canada 1.6% 0.9% 0.7% 0.6% 1.4% 1.3% 0.6% -0.7% -1.0%
8. New Mexico Trading Relationships -- 2004 - 2010 Mexico
Domestic
Canada
2009-2010 2009-2010 2004-2010 2004-2010
2004 2005 2006 2007 2008 2009 2010 Difference % Change Difference % Change
Wild Horse
0
Truck Exports $0 $0 $0 $0 $0 $0 $0 $0 #DIV/0! $0 #DIV/0!
% of Total Exports to Canada 0.0% 0.0% 0.0% 19.4% 0.0% 0.0% 0.0% 0.0% 0.0%
Imports $0 $0 $0 $0 $0 $0 $0 $0 #DIV/0! $0 #DIV/0!
% of Total Imports to Canada 0.0% 0.0% 0.0% 19.0% 0.0% 0.0% 0.0% 0.0% 0.0%
Total Truck Trade Thru GPITC $0 $0 $0 $0 $0 $0 $0 $0 #DIV/0! $0 #DIV/0!
% Total Trade with Canada 0.0% 0.0% 0.0% 19.3% 0.0% 0.0% 0.0% 0.0% 0.0%
Rail Exports $0 $0 $0 $0 #DIV/0! $0 #DIV/0!
% of Total Exports to Canada 0.0% 0.0% 0.0% 11.0% 0.0% 0.0% 0.0% 0.0% 0.0%
Imports $0 $0 $0 $0 #DIV/0! $0 #DIV/0!
% of Total Imports to Canada 0.0% 0.0% 0.0% 22.4% 0.0% 0.0% 0.0% 0.0% 0.0%
Total Rail Trade Thru GPITC $0 $0 $0 $0 $0 $0 $0 $0 #DIV/0! $0 #DIV/0!
% Total Trade with Canada 0.0% 0.0% 0.0% 17.7% 0.0% 0.0% 0.0% 0.0% 0.0%
TOTAL
Exports $0 $0 $0 $0 $0 $0 $0 $0 #DIV/0! $0 #DIV/0!
% of Total Exports to Canada 0.0% 0.0% 0.0% 0.0% 0.0% 0.0% 0.0% 0.0% 0.0%
Imports $0 $0 $0 $0 $0 $0 $0 $0 #DIV/0! $0 #DIV/0!
% of Total Imports to Canada 0.0% 0.0% 0.0% 0.0% 0.0% 0.0% 0.0% 0.0% 0.0%
Total Trade Thru GPITC $0 $0 $0 $0 $0 $0 $0 $0 #DIV/0! $0 #DIV/0!
% Total Trade with Canada 0.0% 0.0% 0.0% 0.0% 0.0% 0.0% 0.0% 0.0% 0.0%
GPITC
#DIV/0!
Truck Exports $21,528,308 $26,942,162 $37,095,542 $39,284,843 $42,204,666 $27,022,982 $29,580,182 $2,557,200 9.5% $8,051,874 37.4%
% of Total Exports to Canada 26.2% 28.0% 29.3% 25.9% 22.7% 23.5% 26.7% -60.6% 3.2% 0.5%
Imports $27,432,712 $31,568,695 $40,741,262 $33,876,197 $45,734,513 $28,887,591 $41,357,353 $12,469,762 43.2% $13,924,641 50.8%
% of Total Imports to Canada 22.9% 22.0% 25.7% 16.8% 20.1% 24.3% 24.0% 23.2% -0.3% 1.0%
Total Truck Trade Thru GPITC $48,961,020 $58,510,857 $77,836,804 $73,161,040 $87,939,179 $55,910,573 $70,937,535 $15,026,962 26.9% $21,976,515 44.9%
% Total Trade with Canada 24.2% 24.4% 27.3% 20.7% 21.3% 23.9% 25.0% 30.4% 1.1% 0.8%
Rail Exports $176,508 $311,720 $16,276,183 $36,200,213 $78,461,048 $68,918,383 $74,252,846 $7,686,019 7.7% $74,076,338 41967.7%
% of Total Exports to Canada 0.2% 0.3% 12.9% 23.8% 42.2% 60.0% 67.1% -182.1% 7.1% 66.8%
Imports $17,172,837 $9,590,528 $2,850,618 $3,488,362 $3,660,357 $2,140,560 $851,312 -$1,238,914 -60.2% -$16,321,525 -95.0%
% of Total Imports to Canada 14.3% 6.7% 1.8% 1.7% 1.6% 1.8% 0.5% -2.3% -1.3% -13.9%
Total Rail Trade Thru GPITC $17,349,345 $9,902,248 $19,126,801 $39,688,575 $82,121,405 $71,058,943 $75,104,158 $6,447,105 5.7% $57,754,813 332.9%
% Total Trade with Canada 8.6% 4.1% 6.7% 11.2% 19.9% 30.4% 26.5% 13.0% -3.9% 17.9%
TOTAL
Exports $21,704,816 $27,253,882 $53,371,725 $75,485,056 $120,665,714 $95,941,365 $103,833,028 $10,243,219 8.2% $82,128,212 378.4%
% of Total Exports to Canada 25.4% 25.8% 35.4% 38.1% 40.6% 42.7% 40.6% 33.4% -2.0% 15.2%
Imports $44,605,549 $41,159,223 $43,591,880 $37,364,559 $49,394,870 $31,028,151 $42,208,665 $11,230,848 36.0% -$2,396,884 -5.4%
% of Total Imports to Canada 17.9% 18.5% 21.3% 15.2% 18.4% 23.3% 22.7% 21.3% -0.6% 4.8%
Total Trade Thru GPITC $66,310,365 $68,413,105 $96,963,605 $112,849,615 $170,060,584 $126,969,516 $146,041,693 $21,474,067 15.0% $79,731,328 120.2%
% Total Trade with Canada 19.8% 20.9% 27.3% 25.4% 30.0% 35.5% 33.1% 25.8% -2.4% 13.3%
9. New Mexico Trading Relationships -- 2004 - 2010 Mexico
Domestic
Canada
2010 Leading Exports from New Mexico to Canada (Surface 2010 2010 Leading Exports from New Mexico to Canada (Surface 2010
Transportation) Transportation)
Rank Export Rank Alberta Export
1 27 Mineral Fuels; Oils and Waxes $77,003,245 1 27 Mineral Fuels; Oils and Waxes $76,063,242
2 84 Computer-Related Machinery and Parts $70,336,335 2 71 Pearls; Stones; Metals and Imitation Jewelry $13,557,222
3 85 Electrical Machinery; Equipment and Parts $29,998,303 3 84 Computer-Related Machinery and Parts $3,985,776
4 71 Pearls; Stones; Metals and Imitation Jewelry $15,011,122 4 87 Vehicles Other than Railway $2,603,046
5 87 Vehicles Other than Railway $13,657,995 5 19 Preparations of Cereals and Flour $1,619,990
6 31 Fertilizers $11,790,383 6 38 Miscellaneous Chemical Products $937,836
7 19 Preparations of Cereals and Flour $8,564,251 7 85 Electrical Machinery; Equipment and Parts $928,115
8 90 Measuring and Testing Instruments $4,470,088 8 8 Edible Fruit and Nuts $581,377
9 7 Edible Vegetables and Roots $3,624,405 9 75 Nickel and Articles $530,146
10 73 Articles of Iron and Steel $2,095,327 10 88 Aircraft; Spacecraft and Parts $356,900
2010 Leading Imports to New Mexico from Canada (Surface 2010 2010 Leading Exports from New Mexico to Canada (Surface 2010
Rank Import Rank British Colombia Export
1 28 Inorganic Chemicals $38,701,521 1 84 Computer-Related Machinery and Parts $834,384
2 84 Computer-Related Machinery and Parts $33,919,676 2 8 Edible Fruit and Nuts $670,177
3 98 Special Classification Provisions $19,701,250 3 85 Electrical Machinery; Equipment and Parts $549,993
4 85 Electrical Machinery; Equipment and Parts $13,306,107 4 30 Pharmaceutical Products $421,389
5 71 Pearls; Stones; Metals and Imitation Jewelry $10,066,921 5 94 Furniture; Lamps and Prefabricated Buildings $270,487
6 44 Wood and Articles $9,847,134 6 10 Cereals $263,131
7 39 Plastics and Articles $8,163,777 7 12 Oil Seeds and Oleaginous Fruits $257,006
8 94 Furniture; Lamps and Prefabricated Buildings $7,746,764 8 31 Fertilizers $238,104
9 90 Measuring and Testing Instruments $7,482,686 9 87 Vehicles Other than Railway $225,371
10 73 Articles of Iron and Steel $5,094,312 10 4 Dairy Products $202,959
2010 Leading Exports from New Mexico to Canada (Surface 2010
Rank Saskatchewan Export
1 87 Vehicles Other than Railway $2,417,646
2 84 Computer-Related Machinery and Parts $358,325
3 97 Works of Art and Antiques $203,228
4 7 Edible Vegetables and Roots $155,442
5 85 Electrical Machinery; Equipment and Parts $132,227
6 31 Fertilizers $44,453
7 19 Preparations of Cereals and Flour $41,060
8 48 Paper and Paperboard $30,301
9 95 Toys; Games and Sport Equipment $8,756
10 57 Carpets and Other Textile Floor Coverings $3,686