Tata Global Beverages BUY target 15% upside9.062.4511.2191.57FY12A FY13A FY14E FY15E FY16E515148484855555555554141414141
•
1 j'aime•1,184 vues


Recommandé
Contenu connexe
Tendances
Tendances (14)
En vedette
Similaire à Tata Global Beverages BUY target 15% upside9.062.4511.2191.57FY12A FY13A FY14E FY15E FY16E515148484855555555554141414141
Similaire à Tata Global Beverages BUY target 15% upside9.062.4511.2191.57FY12A FY13A FY14E FY15E FY16E515148484855555555554141414141 (20)
Plus de Pushkaraj Jamsandekar
Plus de Pushkaraj Jamsandekar (14)
Tata Global Beverages BUY target 15% upside9.062.4511.2191.57FY12A FY13A FY14E FY15E FY16E515148484855555555554141414141
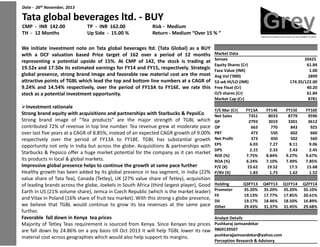
- 1. Date - 26th November, 2013 Tata global beverages ltd. - BUY CMP - INR 142.00 TH - 12 Months TP - INR 162.00 Up Side - 15.00 % Risk - Medium Return - Medium “Over 15 % “ We initiate investment note on Tata global beverages ltd. (Tata Global) as a BUY with a DCF valuation based Price target of 162 over a period of 12 months representing a potential upside of 15%. At CMP of 142, the stock is trading at 19.52x and 17.50x its estimated earnings for FY14 and FY15, respectively. Strategic global presence, strong brand image and favorable raw material cost are the most attractive points of TGBL which lead the top and bottom line numbers at a CAGR of 9.24% and 14.54% respectively, over the period of FY13A to FY16E. we rate this stock as a potential investment opportunity. Investment rationale Strong brand equity with acquisitions and partnerships with Starbucks & PepsiCo cquisitions Strong brand image of “Tea products” are the major strength of TGBL which contributed 72% of revenue in top line number. Tea revenue grew at moderate pace over last five years at a CAGR of 8.85%, instead of an expected CAGR growth of 9.00% respectively over the period of FY13A to FY18E. TGBL has substantial growth opportunity not only in India but across the globe. Acquisitions & partnerships with Starbucks & Pepsico offer a huge market potential for the company as it can market its products in local & global markets. Impressive global presence helps to continue the growth at same pace further Healthy growth has been added by its global presence in tea segment, in India (22% value share of Tata Tea), Canada (Tetley), UK (27% value share of Tetley), acquisition of leading brands across the globe, Joekels in South Africa (third largest player), Good Earth in US (21% volume share), Jemca in Czech Republic (which is the market leader) and Vitax in Poland (16% share of fruit tea market). With this strong s globe presence, we believe that TGBL would continue to grow its tea revenues at the same pace further. Favorable fall down in Kenya tea prices Majority of Tetley Teas requirement is sourced from Kenya. Since Kenyan tea prices are fall down by 24.86% on a yoy basis till Oct 2013 it will help TGBL lower its raw material cost across geographies which would also help support its margins. Market Data Sensex Equity Shares (Cr) Face Value (INR) Avg Vol (‘000) 52-wk HI/LO (INR) Free Float (Cr) O/S shares (Cr) Market Cap (Cr) Y/E Mar (Cr) Net Sales GP OP PBT Net Profit EPS DPS ROE (%) ROA (%) P/E (X) P/BV (X) Holding Promoter FII DII Other 20425 61.84 1.00 2899 174.35/122.00 40.20 61.84 8781 FY13A 7351 2793 663 473 373 6.03 2.15 7.75% 6.24% 23.62 1.83 FY14E 8033 3019 770 550 450 7.27 2.33 8.84% 7.10% 19.52 1.73 FY15E 8779 3301 843 602 502 8.11 2.43 9.27% 7.49% 17.5 1.62 FY16E 9596 3612 925 660 560 9.06 2.45 9.67% 7.85% 15.68 1.52 Q3FY13 35.20% 19.13% 19.17% 29.43% Q4FY13 35.20% 17.77% 18.46% 31.37% Q1FY14 35.20% 17.85% 18.50% 31.45% Q2FY14 35.10% 20.61% 16.89% 29.68% Analyst Details Pushkaraj Jamsandekar 9869139507 pushkarajjamsandekar@yahoo.com Perception Research & Advisory
- 2. Company background Tata Global Beverages Limited, through its subsidiaries, joint ventures and associates, is a global beverages company engaged in the trading, production and distribution of tea, coffee and water. The Company operates in three segments, Tea, which includes cultivation and manufacture of black tea and instant tea, tea buying/blending and sale of tea in bulk or value added form; Coffee and Other Produce, which includes cultivation of coffee, pepper and other plantation crops and conversion of coffee into products, such as roast and ground coffee and instant coffee, and Others, which includes sale of natural mineral water, other minor crops, curing operations of coffee and trading of items required for coffee plantations. Share holding pattern Y/E March 31 (A) Promoter Group Bodies Corporate (B) Public Shareholding (1) Institutions Mutual Funds / UTI Financial Institutions / Banks Government State / Central Insurance Companies Foreign Institutional Investors (2) Non-Institutions Bodies Corporate (3) Individuals Individual holding up to Rs. 1 lakh Individual holding excess of Rs. 1 lakh Others Total Source: Perception research FY13Q2 35.57% 35.57% FY13Q3 35.57% 35.57% FY13Q4 35.55% 35.55% FY14Q1 35.54% 35.54% FY14Q2 35.61% 35.61% % QOQ 0.20% 0.20% % SPLY 0.11% 0.11% 0.40% 0.39% 0.37% 0.37% 0.38% 3.62% -5.23% 4.86% 4.22% 4.29% 4.64% 4.28% -7.76% -11.93% 13.14% 10.93% 10.69% 10.52% 9.64% -8.37% -26.64% 0.03% 0.03% 0.03% 0.03% 0.08% 166.67% 166.67% 5.43% 4.18% 3.62% 3.50% 3.14% -10.29% -42.17% 16.69% 19.33% 17.94% 18.03% 20.91% 15.97% 25.28% 0.02% 0.03% 0.03% 0.03% 0.02% -23.76% -4.94% 2.43% 2.96% 2.83% 3.03% 2.31% -23.76% -4.94% 0.22% 0.23% 0.25% 0.25% 0.24% -2.79% 9.93% 20.25% 20.98% 22.83% 22.47% 21.88% -2.63% 8.05% 0.84% 0.96% 1.06% 1.01% 0.98% -2.97% 16.67% 0.77% 0.83% 1.14% 1.24% 1.17% -5.65% 51.95% 100.00% 100.00% 100.00% 100.00% 100.00% 0.00% 0.00% Q2FY14 Promoter 29% FII DII 34% 17% 20% Other
- 3. Investment rationale Strong brand equity with acquisitions and partnerships with Starbucks & Pepsico cquisitions Strong brand image of “Tea products” are the major strength of TGBL which contributed 72% of revenue in top line number. Tea revenue grew at moderate pace over last five years at a CAGR of 8.85%, instead of an expected CAGR growth of 9.00% respectively over the period of FY13A to FY18E. TGBL has substantial growth opportunity not only in India but across the globe. Acquisitions & partnerships with Starbucks & Pepsico offer a huge market potential for the company as it can market its products in local & global markets. Exhibit 01: Growth in Tea revenue Exhibit 02: Growth in Coffee revenue 8000 11% 6000 5766 5290 4767 6285 9% 9% 9% 12% 3000 10% 6851 2500 1000 2% 20% 500 0% 2247 2043 1857 0 15% 9% 10% 10% 10% 2000 0 FY12A FY13A FY14E Tea FY15E Growth 25% 1500 4% 1706 2000 6% 6% 4000 8% 20% 2472 10% 5% 0% FY12A FY16E FY13A FY14E Coffee Source: Perception research FY16E Source: Perception research Exhibit 03: Growth in paper and other revenue FY15E Growth Exhibit 04:NIM - Growth in Total revenue 120 100 80 95 90 42% 86 100 50% 40% 80 30% 12000 12% 10000 8000 6633 11% 7352 11% 8781 8034 9597 11% 11% 6000 60 20% 40 20 8% 10% 5% 5% 5% 0 0% FY12A FY13A FY14E Paper & Other Source: Perception research FY15E Growth FY16E 10% 4000 10% 2000 9% 9% 9% 0 9% FY12A Source: Perception research FY13A FY14E Total Revenue FY15E Growth FY16E
- 4. Impressive global presence helps to continue the growth at same space further Healthy growth has been added by its global presence in tea segment, in India (22% value share of Tata Tea), Canada (Tetley), UK (27% value share of Tetley), acquisition of leading brands across the globe, Joekels in South Africa (third largest player), Good Earth in US (21% volume share), Jemca in Czech Republic (which is the market leader) and Vitax in Poland (16% share of fruit tea market). With this strong s globe presence, we believe that TGBL would continue to grow its tea revenues at the same space further. Favorable fall down in Kenya tea prices Majority of Tetley Teas requirement is sourced from Kenya. Since Kenyan tea prices are fall down by 24.86% on a yoy basis till Oct 2013 it will help TGBL lower its raw material cost across geographies which would also help support its margins margins. Exhibit 05: Kenya tea prices 400 300 200 100 Jun 13 Jun-13 Jul 13 Jul-13 Aug 13 Aug-13 Sep 13 Sep-13 Oct 13 Oct-13 Jun 13 Jun-13 Jul 13 Jul-13 Aug 13 Aug-13 Sep 13 Sep-13 Oct 13 Oct-13 May 13 May-13 Apr 13 Apr-13 Mar 13 Mar-13 Feb 13 Feb-13 Jan 13 Jan-13 Dec 12 Dec-12 Nov 12 Nov-12 Oct 12 Oct-12 Sep 12 Sep-12 Aug 12 Aug-12 Jul 12 Jul-12 Jun 12 Jun-12 May 12 May-12 Apr 12 Apr-12 Mar 12 Mar-12 Feb 12 Feb-12 Jan 12 Jan-12 Dec 11 Dec-11 Nov 11 Nov-11 Oct 11 Oct-11 0 Price Source: Perception research Exhibit 06: Change in Kenya tea prices 4.00% 2.00% -6.00% -8.00% -10.00% -12.00% Source: Perception research May 13 May-13 Apr 13 Apr-13 Mar 13 Mar-13 Feb 13 Feb-13 Jan 13 Jan-13 Dec 12 Dec-12 Nov 12 Nov-12 Oct 12 Oct-12 Sep 12 Sep-12 Aug 12 Aug-12 Jul 12 Jul-12 Jun 12 Jun-12 May 12 May-12 Apr 12 Apr-12 Mar 12 Mar-12 Feb 12 Feb-12 Jan 12 Jan-12 Dec 11 Dec-11 Nov 11 Nov-11 -4.00% Oct 11 Oct-11 0.00% -2.00%
- 5. Financials & projections Exhibit 07: Tata global beverages ltd. Valuation (Rs In Cr) Profit And Loss A/C Net Sales Cost of sales Depreciation Gross Profit Ad, S&D Expenses Operating profit Other income Net interest Pre tax Income Income tax Post Tax Income Net Profit FY12A FY13A 6631 7351 4218 4452 96 105 2317 2793 1768 2130 549 663 95 58 70 84 574 637 142 164 432 473 356 373 FY14E 8033 4901 113 3019 2250 770 61 92 738 188 550 450 FY15E 8779 5356 122 3301 2459 843 64 99 808 206 602 502 FY16E 9596 5854 129 3612 2687 925 67 106 886 226 660 560 Ratio And Valuation Value Per Share EPS DPS CEPS BV/Sh Dividend Pay Out Ratio(%) Balance Sheet FY12A FY13A Net Fixed Assets 4244 4435 WIP 49 91 Investments 567 578 Current assets Inventories 1161 1383 Sundry Debtors 652 713 Cash and Bank 736 698 Other Current Assets 0 0 Loans and Advances 871 897 Current Liabilities Creditors 1311 1640 Other 448 513 Net Current Assets 1661 1538 Long Term debt 888 1017 Defer Tax 1066 814 Net Worth 4566 4810 Share Capital 62 62 Total Reserves 4504 4748 Net Worth 4566 4810 Source: Perception research FY14E 4759 50 607 FY15E 5101 50 637 FY16E 5376 50 669 Efficiency Ratios Receivable days Inventory Days Payable days 1409 759 709 0 916 1546 829 646 0 1005 1689 906 713 0 1098 1686 531 1576 1088 814 5089 62 5028 5089 1843 580 1602 1164 814 5413 62 5351 5413 2014 634 1758 1246 814 5794 62 5732 5794 FY12A FY13A FY14E FY15E FY16E 5.76 2.15 7.31 73.83 6.03 2.15 7.73 77.78 7.27 2.33 9.10 82.30 8.11 2.43 10.08 87.53 9.06 2.45 11.15 93.69 6.03% 7.80% 1.12 3.63 10.17 6.24% 7.75% 1.23 3.22 10.31 7.10% 8.84% 1.27 3.48 10.59 7.49% 9.27% 1.31 3.47 10.59 7.85% 9.67% 1.35 3.47 10.59 35 102 82 36 107 77 36 110 80 36 110 80 36 110 80 Margins Gross Profit Margin (%) Operating Profit Margin (%) EBITDA Margin(%) Pre-Tax Profit Margin (%) Tax Net Profit Margin (%) 34.9% 8.3% 11.2% 8.7% 5.4% 38.0% 9.0% 11.2% 8.7% 5.1% 37.6% 9.6% 11.7% 9.2% 5.6% 37.6% 9.6% 11.7% 9.2% 5.7% 37.6% 9.6% 11.7% 9.2% 5.8% Valuation Ratio P/E (x) P/BV (x) EV/Net Sales(x) EV/EBITDA(x) EV/EBIT(x) EV/CE(x) M Cap / Sales 27.76 2.17 1.68 5.23 5.58 1.94 1.20 23.62 1.83 0.40 3.09 3.58 0.66 0.12 19.52 1.73 1.09 10.18 12.05 2.36 0.93 17.50 1.62 1.51 13.56 15.59 3.79 1.49 15.68 1.52 1.24 11.04 12.65 2.88 1.20 Performance Ratios ROA (%) ROE (%) Asset Turnover(x) Inventory Turnover(x) Debtors Turnover(x)
- 6. Valuation Exhibit 08: Tata global beverages ltd. Valuation (Rs In Cr) Risk Free Rate Market return Market Premium Beta Ke Kd G Equity Debt We Wd WACC Source: Perception research 7.00% 13.76% 6.76% 0.33 9.24% 8.50% 3.00% 4810.12 1016.83 0.83 0.17 9.11% Valuation FCFF Terminal Value Discount Rate Period Discount PV of FCFF PV of FCFF PV of TV Enterprise value Net debt & Minority Income Equity Value No of shares Stock Price FY14E 612.89 FY15E 653.80 FY16E 689.19 FY17E 733.36 0.92 1 561.73 0.84 2 549.19 0.77 3 530.59 0.71 4 517.46 At CMP of 142 the stock is trading at 19.52x & 17.50x its FY14 & FY15E EPS. Strategic 14E global presence, strong brand image and favorable raw material cost are the most attractive points of TGBL which lead the top and bottom line numbers at a CAGR of 9.24% and 14.54% respectively, over the period of FY13A to FY FY16E. Based on our DCF valuation we arrive at the target price of 162 with a BUY rating and a potential upside of 15%. FY18E 779.57 13143.78 0.65 5 504.14 2663.10 8499.97 11163.08 1116.80 10046.28 61.84 162.46
- 7. Investment Criteria & Disclaimer Rating Buy Accumulate Hold Sell Low Risk Over 15 % 10 % to 15 % 0% to 10 % Negative Returns Risk Description Low Risk Medium Risk High Risk Medium Risk Over 20% 15% to 20% 0% to 15% Negative Returns High Risk Over 25% 20% to 25% 0% to 20% Negative Returns Predictability High predictability Moderate predictability Low predictability Price Volatility Low volatility Average volatility High volatility Analyst Details Pushkaraj Jamsandekar MMS - Finance Contact - +09869139507 Email ID - pushkarajjamsandekar@yahoo.com Perception Research & Advisory Disclaimer This document is for private circulation and information purposes only and should not be regarded as an investment, taxation or legal advice. Investors should seek financial advice regarding the appropriateness of investing in any securities or investment strategies discussed or recommended in this publication and should under-stand that statements regarding future prospects may not be realized. In no circumstances it be used or considered as an offer to sale or a solicitation of any offer to buy or sell the securities mentioned in it. We and our affiliates, officers, directors and employees including persons involved in the preparation or issuance of this material may: (a) from time to time, have long or short positions in, and buy or sell the securities thereof, of company(ies) mentioned herein or (b) be engaged in any other transaction involving such securities and earn brokerage or other compensation or act as a market maker in the financial instruments of the company(ies) dis-cussed herein or act as an advisor or lender or borrower to such company or have other potential conflict of interest with respect to any recommendation and re-lated information and opinions. The information contained in this publication may have been taken from trade and statistical services and other sources, which we believe are reliable. We does not guarantee that such information is accurate or complete and it should not be relied upon as such. Any opinion expressed reflects judgments at this date and are subject to change without notice. Caution: Risk of loss in trading & investment can be substantial. You should carefully consider whether trading & investment is appropriate for you in light of your experience, objectives, financial resources and other relevant circumstances circumstances. Perception Research & Advisory