2. Optimization of Electrical Discharge Machining of
Composite 90WC-10Co Base on Taguchi Approach 427
from the work piece at a controlled rate. Thus, the material is removed by a succession of electrical
discharges that, occur between the electrode and the work piece. During the EDM process, the work
piece and the electrode are submerged in dielectric fluid oil, which is an insulator that helps to control
the arc discharge. The dielectric oil, which provides a means of flushing, is pumped through the arc
gap between electrode and the work piece. This process removes suspended particles of the work piece
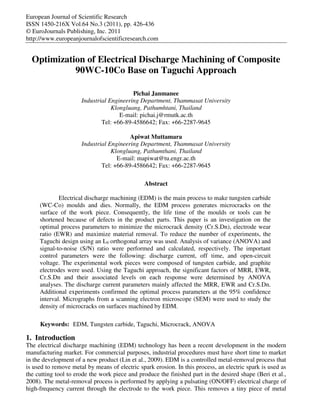
and the electrode form the work area. The schematic diagram of EDM is shown Fig. 1, along with the
procedure for dielectric flushing. EDM is one of the non-traditional machining techniques widely used
to manufacture harder materials for the automotive, aerospace, and surgical, moulds and dies (Ponappa
et al., 2010). Therefore, the EDM technique is an essential approach for mould and die making
industries to fabricate their products with superior performance and accuracy (Lin et al., 2009). This
machining process produces tools with complex shapes and is extensively used in industrial settings.
EDM can operate as a surface finish in the last stage of tool production (Singh et al., 2004). Tungsten
carbide (WC-Co) is an important tool and die material mainly because of its high hardness, strength
and wear resistance (Mahdavinejad and Mahdavinejad, 2005). Due to its high melting point of 2870 oC,
WC-Co cannot be processed easily by conventional machining techniques. The principle of the EDM
process is based on erosion of materials by electrical sparking, and particles that are removed could be
solid, liquid, or gas (Mukherjee and Ray, 2006). Currently, an insulating material can be machined
with EDM using assisting electrode (Fukuzawa et al., 2004). Muttamara et al. (2003) studied the
probability of precision micro-machining of insulating Si3N4 ceramics by the EDM process.
Copper-tungsten electrodes are important in machining small holes in the EDM process.
Therefore the EDM process will open up an opportunity for the machining of tungsten carbide.
Tungsten carbide is a type of cemented carbide, in which particles of carbide such as WC-Co and
titanium carbide (TiC) are bonded the process of powder metallurgy. In tungsten carbide, small cobalt
particle, approximately 1-10 µm, are used as binders (Puertas et al., 2004). Microcracks are observed
on the surface of tungsten carbide work piece when they are machined with EDM. Because of their
lower melting point, cobalt particles can melt and separate away from tungsten carbide and result in
microcracks. When the work piece is used as a mould or tool, an important consideration is the product
lifespan. Singh et al. (2004) studied the effects of material removal rate (MRR), electrode wear ratio
(EWR), surface roughness (SR), and diametral overcut of grade EN-31 cutting tool steel, when used as
an electrode material. The experimental results showed that an increasing current could increase MRR,
SR, and diametral overcut. The best electrode is copper due to its maximum MRR, minimum EWR,
SR, and over-cut. Lee and Li (2001) researched the effects of electrode material in machining tungsten
carbide by comparing copper, graphite, and copper tungsten electrode. The results showed that copper
tungsten had the highest MRR and the lowest EWR.
In an EDM operation, optimizing sparking performance requires the use of correct parameters.
However, choosing the correct parameters often calls experience, an instruction manual or a large
number of experiments that can consume both material and time. The Taguchi method solves this
problem by using specially designed orthogonal arrays. The process parameters can be studied with a
minimum number of experiments (Wang et al., 2000). Recently, the Taguchi method was widely
employed in several industrial field and research applications. Mahapatra and Patnaik (2006) used this
method to optimize the process parameters of wire electrical discharge machining (WEDM). Marafona
and Araujo (2009) used this method to study the influence of work piece hardness on EDM
performance. Their results show that the work piece hardness and its interaction influence the MRR
and the SR of the work piece. Prihandana et al. (2009) studied the effect of micro-powder suspension
and ultrasonic vibration of dielectric fluid in micro-EDM process, while. Sundaram et al. (2008)
studied the process parameters of ultrasonic assisted micro-EDM using the Taguchi approach as well.
Tzeng and Chen (2007) reported the application of fuzzy logic analysis coupled with Taguchi method
to optimize the precision and accuracy of the high-speed EDM process. Gaitonde et al. (2008)
presented the application of the Taguchi optimization method for simultaneously minimizing burr
height and burr thickness with respect to the influence of cutting drill and geometry. Kao et al. (2009)
3. 428 Pichai Janmanee and Apiwat Muttamara
optimized the EDM parameters with multiple quality characteristics on machining Ti-6Al-4V based on
the Taguchi method. Lin et al. (2009) showed grey relational analysis is more straight forward than the
fuzzy Taguchi method for optimizing the EDM process with multiple process responses.
The objective of this research was to use the Taguchi method to study the performance of the
EDM process on machining tungsten carbide. The most important performance measures in EDM were
material removal rate (MRR), electrode wear ratio (EWR) and microcrack density (Cr.S.Dn) on the
work piece surface.
Figure 1: The schematic diagram of EDM
2. Experimental Methods
2.1. Experimental Materials
Tungsten carbide was selected as the work piece for this research. The sample had 10% cobalt with
90% tungsten carbide and was bought from United Tungsten Co., Ltd. Tungsten carbide is a class of
hard material composite. It is widely used as a tool material in a variety of applications where the
demands on hardness and toughness are high. The essential properties of the work piece material are
shown in Table 1. The work piece had a diameter of 25 mm and thickness of 20 mm. The graphite
electrode (EDM-3) purchased from Poco Graphite (Thailand) Co., Ltd. was made from powders
produced by the semi-sintering process. The electrode was 3 mm in diameter and 50 mm in length, and
it was held on the spindle chuck of the EDM machine. Table 2 shows the essential properties of the
electrodes. The dielectric oil used in this investigation was Shell EDM Fluid 2A from Shell Co., Ltd.
(Thailand).
Table 1: Essential properties of tungsten carbide
Essential properties Description
Melting point (oC) 2,870
Density (g/cm3) 15.7
Thermal expansion (oC) 5x10⁻⁶
Hardness (HRA) 87.4
Elastic modulus (Gpa) 648
Electrical resistivity ( cm)
・ 17×10-6
Thermal conductivity (W/mK) 63
Table 2: Essential properties of graphite electrodes (EDM-3)
Essential properties Description
Melting point (oC) 3,350
Density (g/cm3) 1.81
Average particle size (µm) <5
Electrical resistivity ( cm)
・ 1.491×101
4. Optimization of Electrical Discharge Machining of
Composite 90WC-10Co Base on Taguchi Approach 429
Table 2: Essential properties of graphite electrodes (EDM-3) - continued
Flexural strength (kg/cm2) 950
Compressive strength (kg/cm2) 1,500
2.2. Experimental Procedures
The experiments were performed on a numerical control model EDM-FORM-2-LC manufactured by
Charmilles Technologies Corporation. A negative polarity electrode with depth of cut of 3 mm was
used. The machining parameters such as MRR (mm3/min), EWR (mm3/min), and Cr.S.Dn were varied
to determine the most important parameters that could affect performance characteristic. The MRR of
the work piece was measured by dividing the weight of the work piece before and after machining by
the machining time. The EWR in this study was defined by the ratio of the electrode weight to the
work piece weight and expressed as a percentage. Similar procedures for measuring the weight of the
work piece have been used to determine the weight of the electrode before and after machining
(Tomadi et al., 2009). Microcrack density on finished surfaces of work piece in the EDM process is an
important measurement of defects in the material (Lee and Li, 2003).
The microcrack density on the work piece surface can be measured by (O’Brien et al., 2003):
(1) number of microcrack per area, or numerical crack density per area, Cr.Dn (no. of crack/mm2): (2)
total length of microcrack per area, or surface crack density, Cr.S.Dn (µm/mm2); and (3) mean crack
length, Cr.Le (µm). In this research, measuring technique 2 was selected because the work piece
contained cracks of various widths. The unit of measurement was µm/0.05 mm2. The values of visually
measured microcrack width multiplied by the weight factor are shown in Table 3. For this experiment,
the EDM process parameters studied were as follows polarity, on time, off time, open-circuit voltage,
discharge current and electrode material. The detailed experimental conditions used in this
investigation are shown in Table 4. Finally, the optimal EDM parameters of material removal rate,
electrode wear ratio, and microcrack density were determined by the Taguchi method.
Table 3: Weight factor of width of microcracks (Cr.S.Dn) measurement
Width (µm) Weight factor(x)
Less than 3.23 1
3.23-6.45 2
6.45-9.68 3
9.68-12.90 4
12.90-16.13 5
Table 4: Experimental conditions
Working conditions Descriptions
Work piece 90WC-10Co
Electrode EDM-3
Polarity Nagative (-)
On-time 25 µs
Off-time 2,510,1600 µs
Open circuit voltage 90,150,250 V
Discharge current 1.5,38,75 A
Dielectric fluid Oil (Shell fluid 2A)
2.3. Procedure for the Taguchi Approach
The Taguchi method is statistical method developed by Genichi Taguchi to improve the quality of
manufactured goods. More recently has been applied to the field of (Rosa et al., 2009) engineering,
biotechnology, marketing and advertising (Sreenivas et al., 2004). The method consists of a plan to
acquire data from experiments in a controlled way, and to obtain information about the behaviour of a
5. 430 Pichai Janmanee and Apiwat Muttamara
given process (Ponappa et al., 2010). There are three characteristics of the Taguchi methodology:
smaller-the-better, larger-the-better, and nominal-the-best. In general the Taguchi method provides a
significant reduction in the size of experiments with considerable savings in time and cost, thereby
acclerating the experimental process (Sundaram et al., 2008; Lajis et al., 2009). Fig. 2 shows the
Taguchi method applied to the experimental procedures step. In this research, the Taguchi method was
used to determine optimal machining to parameters maximize MRR and minimize EWR, as well as
Cr.S.Dn in the EDM process. The method uses orthogonal arrays (OA) and calculates signal-to-noise
(S/N) ratios. In the L9 (33) orthogonal array design, three columns and nine rows set up three individual
levels. The first column was assigned to the discharge current (A), the second column to off-time (B),
and the third column to open-circuit voltage (C). In addition to the S/N ratio, a statistical analysis of
variance (ANOVA) was also employed to indicate the impact of process parameters. To calculate the
S/N ratio, the HB value for “the higher the better” and LB value for “the lower the better” were first
determined by equations (1), (2), and (3):
1 n 1
HB = ∑ 2
n i =1 y MRR (1)
1 n 1
LB = ∑ 2
n i =1 y EWR (2)
n
1 1
LB = ∑ y2
n i =1 Cr .S . Dn (3)
where y MRR , y EWR and yCr .S . Dn are material removal rate, electrode wear ratio and surface crack
density, respectively. n is the number of experiments in the trial, beginning with the ith experiment.
The S/N ratio can then be calculated as a logarithmic transformation of the loss function, as shown in
equations (4), (5), and (6):
S N ratio for MRR = −10 log ( HB ) (4)
10
S N ratio for EWR = −10 log10 ( LB ) (5)
S N ratio for Cr.S.Dn = −10 log 10 ( LB ) (6)
Figure 2: Taguchi method of procedure step
Table 5 shows the experimental values of the Taguchi approach on EDM machining control
parameters and the levels of machining parameters according to the S/N ratio.
6. Optimization of Electrical Discharge Machining of
Composite 90WC-10Co Base on Taguchi Approach 431
Table 5: Machining parameter of tungsten carbide
Levels
Symbol Control parameters Observed values
I II III
A Discharge current (A) 1.5 38 75 MRR (mm3/min)
B Off time (µs) 2 510 1600 EWR (%)
C Open circuit voltage (V) 90 150 250 Cr.S.Dn (µm/mm2)
3. Results and Discussions
The experimental results of each set of input parameters in the L9 orthogonal array are given in Table
6. The table also contains a detailed list of MRR, EWR and Cr.S.Dn correlated with each experimental
measurement of the EDM process on the composite WC-Co. Data analysis was done using the
MINITAB software, version 14.
Table 6: Experimental results of L9 orthogonal array
Parameters Response
Order
A B C MRR EWR Cr.S.Dn
1 1 1 1 0.163 455.217 346.13
2 1 2 2 0.084 365.667 183.87
3 1 3 3 0.125 275.550 460.97
4 2 1 2 0.540 355.556 954.84
5 2 2 1 0.281 287.143 1119.36
6 2 3 3 0.238 237.143 885.48
7 3 1 3 2.731 276.460 1459.68
8 3 2 1 1.730 87.360 1024.84
9 3 3 2 1.472 37.234 1056.45
3.1. Analysis of MRR
For the S/N ratio of MRR with larger-the-better algorithm, the results showed that discharge current
(A) had an effect on MRR. The experimental data analysed by ANOVA showed that discharge current
had an effect on MRR as well, at the 95% confidence level. Tables 7, 8 and Fig. 3 show a list of the
corresponding ANOVA results, where the contribution of each parameter is calculated. For the relation
between discharge current and MRR of work piece were found that an increased current have influence
to increasing MRR. That means, though a higher current causes more removal work piece material.
The optimal parameters for maximum MRR, as predicted by the MRR results were as follow:
discharge current of 75 A, on-time of 2 µs, and open-circuit voltage of 250 V. These values were
chosen because mean of the predicted values were similar to the experimental values of 2.531 and
2.731, as shown in Table 6.
3.2. Analysis of EWR
Tables 9 and 10 show the orthogonal array based on experimental results of electrode EWR and their
corresponding S/N ratio. The analysis of EWR with smaller-the-better algorithm revealed that
discharge current (A) and off-time (B) had an influence on EWR. Fig. 4 shows the main effect of EWR
of each factor for various level condition. According to Fig. 4, the EWR decreases with the two major
parameters, A and B. Moreover, to observed that mean the machining voltage (negative polarity),
maximum discharge current, and off-time may imply a smaller EWR (Lajis et al., 2009). Therefore, the
ANOVA results indicated that discharge current (A) significantly affected EWR and also off-time, at
the 95% confidence level. P-value of off-time (B) was 0.082 close to therefore the off-time
factor was shown to be a risk factor to EWR as well. Since P-values of factors A and B were less than
0.05, they had a statistically significant effect on MRR at the 95% confidence level.
7. 432 Pichai Janmanee and Apiwat Muttamara
Table 7: S/N ratio of MRR
MRR
Factors
I II III Delta
A -18.444 -9.615 5.615 24.059
B -4.127 -9.260 -9.057 5.132
C -7.821 -7.836 -6.787 1.049
Table 8: ANOVA of MRR
Source Df SS MS F P
A 2 6.1281 3.0640 28.21 0.034
B 2 0.4908 0.2454 2.26 0.307
C 2 0.2330 0.1165 1.07 0.483
Error 2 0.2172 0.1086
Total 8 7.0691
Figure 3: Main effect plot of MRR
Main Effects Plot for MRR
Fitted Means
A B
2.0
1.5
1.0
0.5
0.0
Mean
1 2 3 1 2 3
C
2.0
1.5
1.0
0.5
0.0
1 2 3
Table 9: S/N ratio of EWR
EWR
Factors
I II III Delta
A -51.08 -49.23 -39.69 11.38
B -51.01 -46.42 -42.57 8.43
C -46.50 -44.57 -48.93 4.37
Table 10: ANOVA of EWR
Source Df SS MS F P
A 2 84411 42206 19.22 0.049
B 2 49483 24741 11.27 0.082
C 2 1166 583 0.27 0.790
Error 2 4392 2196
Total 8 139452
8. Optimization of Electrical Discharge Machining of
Composite 90WC-10Co Base on Taguchi Approach 433
Figure 4: Main effect plot of EWR
Main Effects Plot for EWR
Fitted Means
A B
350
300
250
200
150
Mean
1 2 3 1 2 3
C
350
300
250
200
150
1 2 3
3.3. Analysis of Cr.S.Dn
Fig. 5 show the main effects of Cr.S.Dn of each factor for various level condition. According to this
figure the Cr.S.Dn increases with high value of discharge current, off-time and open-circuit voltage.
However, the results from the experimental study indicate that when the higher value of process
parameters, had a significant influence on Cr.S.Dn. Because of more electrical energy and thermal into
the machining zone. The analysis of S/N ratio of Cr.S.Dn with smaller-the-better algorithm and
ANOVA revealed that discharge current (A) and open-circuit voltage (C) had a significant influence on
Cr.S.Dn. Since P-values of factor A, B and C were less than 0.05, these factors had a statistically
significant effect on Cr.S.Dn as well, at the 95% confidence level. This is shown in Tables 11, and 12.
Table 11: S/N ratio of Cr.S.Dn
Cr.S.Dn
Factors
I II III Delta
A -49.78 -59.84 -61.33 11.54
B -57.89 -55.49 -57.56 2.40
C -56.65 -55.12 -59.18 4.06
Table 12: ANOVA of Cr.S.Dn
Source Df SS MS F P
A 2 1190691 595345 740.61 0.001
B 2 35634 17817 22.16 0.043
C 2 147944 73972 92.02 0.011
Error 2 1608 804
Total 8 1375877
Table 13: Results of the confirmation experiments
Optimal parameters Optimal parameters Optimal parameters of
Details
of MRR of EWR Cr.S.Dn
Prediction Experimental Prediction Experimental Prediction Experimental
Level A3 B1 C3 A3 B1 C3 A3 B3 C2 A3 B3 C2 A1 B2 C2 A1 B2 C2
Mean 2.53156 2.731 41.5171 37.234 173.262 183.87
9. 434 Pichai Janmanee and Apiwat Muttamara
Figure 5: Main effect plot of Cr.S.Dn
Main Effects Plot for CrSDN
Fitted Means
A B
1200
1000
800
600
400
Mean
1 2 3 1 2 3
C
1200
1000
800
600
400
1 2 3
4. Confirmation Experiments
To verify the improvement of the observed the optimal combination of the machining parameters were
used to perform confirmation experiments (Mahaparata et al., 2006). The estimated S/N ratios were
calculated by equation (7),
n0
η = η m + ∑ (η i − η m )
ˆ
i =1 (7)
ˆ
where η is the estimated S/N ratios for optimal combinations of machining parameters,
η m is the total
mean S/N ratio, η 0 is the number of significant parameters, and η i is the mean S/N ratios at the
optimal level (Lin et al., 2009). The results of the confirmation experiments are shown in Table 13.
The experiment performed at the A3 B1 C3 level of parameters showed that the maximum MRR
increased from 2.531 mm3/min to 2.731 mm3/min. The experiment performed at the A3 B3 C2 level of
parameters showed that the minimum EWR decreased from 41.517 % to 37.234 %. The experiment
performed at A1 B2 C2 level of parameters showed the minimum Cr.S.Dn increased from 173.262
µm/mm2 to 183.870 µm/mm2. In addition, the SEM micrograph in Fig. 7 shows the Cr.S.Dn of the
EDM surface with the orthogonal array parameter A1B2 C2 (a) as the best parameters with microcrack
density per area of 183.870 µm/mm2. The array parameter A3B1C3 (b) was poor with a microcrack
density per area of 1459.68 µm/mm2.
Figure 6: SEM micrographs of Cr.S.Dn on surface EDM a) the best parameters condition : A1 B2 C2, b) the
poor parameters condition : A3 B1 C3
a) A1 B2 C2 b) A3 B1 C3
10. Optimization of Electrical Discharge Machining of
Composite 90WC-10Co Base on Taguchi Approach 435
5. Conclusions
This study investigated the optimization of EDM machining parameters on the MRR, EWR and
Cr.S.Dn in tungsten carbide (90WC-10Co) work pieces. A 3 mm diameter, EDM-3 grade graphite
electrode with dielectric oil Shell EDM Fluid 2A was used for machining. Experimental results showed
that:
• The maximum MRR was obtained at discharge current of 75 A, an off-time of 2 µs, and an
open-circuit voltage of 250 V.
• The minimum EWR, was obtained at a discharge current of 75 A, an off-time of 1600 µs, and
open-circuit voltage of 150 V.
• The minimum Cr.S.Dn, was obtained at a discharge current of 75 A, an off-time of 510 µs, and
open-circuit voltage of 150 V.
• The Taguchi method was used to significantly reduce the size of experiments. Confirmation
experiments verified the optimal EDM machining parameters obtained from the experimental
results.
Acknowledgement
The authors are grateful to the Thailand Research Fund, Office of the Higher Education Commission
and the National Research Council of Thailand for their funding support. The authors would like to
thank the National Metal and Materials Technology Centre (MTEC) for its kind support in supplying
materials and equipments for analysis.
References
[1] Beri, N., Maheshwari, S., Sharma, C., Kumar, A., 2008. Performance Evaluation of Powder
Metallurgy Electrode in Electrical Discharge Machining of AISI D2 Steel Using Taguchi
Method. International Journal of Aerospace and Mechanical Engineering 2 (3), pp.167-171.
[2] Fukuzawa, Y., Mohri, N., Tani, T., Muttamara, A., 2004. Electrical Discharge Machining
Properties of Noble Crystals. Journal of Materials Processing Technology 149 (1-3), pp. 393-
397.
[3] Gaitonde, V.N., Karnik, S.R., Achyutha, B.T., Siddeswarappa, B., 2008. Taguchi Optimization
in Drilling of AISI 316L Stainless Steel to Minimize Burr Size Using Multi-Performance
Objective Based on Membership Function. Journal of Materials Processing Technology 202
(1-3), pp. 374-379.
[4] Kao, J.Y., Tsao, C.C., Wang, S.S., Hsu, C.Y., 2009. Optimization of the EDM Parameters on
Machining Ti–6Al–4V With Multiple Quality Characteristics. The International Journal of
Advanced Manufacturing Technology 47, pp. 395-402.
[5] Lajis, M.A., Radzi, H.C.D.M., Amin, A.K.M.N., 2009. The Implementation of Taguchi Method
Process of Tungsten Carbide. European Journal of Scienctific Research. 26 (4), pp. 609-617.
[6] Lee, S.H., Li, X.P., 2001. Study of the Effect of Machining Parameters on the Machining
Characteristics in Electrical Discharge Machining of Tungsten Carbide. Journal of Materials
Processing Technology 115(3), pp. 344-358.
[7] Lee, S.H., Li, X.P., 2003. Study of the Surface Integrity of the Machined Workpiece in the
EDM of Tungsten Carbide. Journal of Materials Processing Technology 139 (1-3), pp. 315-
321.
[8] Lin, Y.C., Chen, F.C., Wang, D.A., Lee, H.S., 2009. Optimization of Machining Parameters in
Magnetic Force Assisted EDM Based on Taguchi Method. Journal of Materials Processing
Technology 209 (7), pp. 3374-3383.
11. 436 Pichai Janmanee and Apiwat Muttamara
[9] Mahapatra, S.S., Patnaik, A., 2006. Parametric Optimization of Wire Electrical Discharge
Machining (WEDM) Process Using Taguchi Method. Journal of the Brazillian Society of
Mechanical Sciences and Engineering 28, pp. 422-429.
[10] Mahdavinejad, R.A., Mahdavinejad, A., 2005. ED Machining of WC-Co. Journal of Materials
Processing Technology 162-163, pp. 637-643.
[11] Marafona, J.D., Araujo A., 2009. Influence of Workpiece Hardness on EDM Performance.
International Journal of Machine Tools & Manufacture 49 (9), pp. 744-748.
[12] Mukherjee, I., Ray, P.K., 2006. A Review of Optimization Technique in Metal Cutting
Processes. Computer and Industrial Engineering 50 (1-2), pp. 15-34.
[13] Muttamara, A., Fukuzawa, Y., Mohri N., Tani, T., 2003. Probability of Precision Micro-
Machining of Insulating Si3N4 Ceramics by EDM. Journal of Materials Processing Technology
140 (1-3), pp. 243-247.
[14] O’Brien, F.J., Taylor, D., Lee, T.C., 2003. Microcrack Accumulation at Different Intervals
During Fatigue Testing of Compact Bone. Journal of Biomechanics 36 (7), pp. 973-980.
[15] Ponappa, K., Aravindan, S., Rao, P.V., Ramkumar, J., Gupta, M., 2010.The Effect of Process
Parameters on Machining of Magnesium Nano Alumina Composites Through EDM. The
International Journal of Advanced Manufacturing 46, pp. 1035-1042.
[16] Prihandana, G.S., Mahardika, M., Hamdi, M., Wong, Y.S., Mitsui, K., 2009. Effect of Micro-
Powder Suspension and Ultrasonic Vibration of Dielectric Fluid in Micro-EDM Process-
Taguchi Approach. International Journal of Machine Tools and Manufacture 49 (12-13), pp.
1035-1041.
[17] Puertas, I., Luis, C.J., Alvarez, L., 2004. Analysis of the Influence of EDM Parameters on
Surface Quality, MRR and EW of WC-Co. Journal of Materials Processing Technology 153-
154, pp. 1026-1032.
[18] Rosa, J.L., Robin, A., Silva, M.B., Baldan, C.A., Peres, M.P., 2009. Electrodeposition of
Copper on Titanium Wires : Taguchi Experimental Design Approach. Journal of Materials
Processing Technology 209 (3), pp. 1181-1188.
[19] Singh, S., Maheshwari, S., Pandey, P.C., 2004. Some Investigation into the Electric Discharge
Machining of Hardened Tool Steel Using Different Electrode Materials. Journal of Materials
Processing Technology 149 (1-3), pp. 272-277.
[20] Sreenivas, R.R., Prakasham, R.S., Prasad, K.K., Rajesham, S., Sarma, P.N., Rao L.V., 2004.
Xylitol Production by Candida sp.: Parameter Optimization Using Taguchi Approach. Process
Biochemistry 39 (8), pp. 951-956.
[21] Sundaram, M.M., Pavalarajan, G.B., Rajurkar, K.P., 2008. A Study on Process Parameters of
Ultrasonic Assisted Micro EDM Based on Taguchi Method. Journal of Materials Engineering
and Performance 17 (2), pp. 210-215.
[22] Tomadi, S.H., Hassan, M.A., Hamedon, Z., Daud, R., Khalid, A.G., 2009. Analysis of the
Influence of EDM Parameters on Surface Quality, Material Removal Rate and Electrode Wear
of Tungsten Carbide. In: Proceedings of the International Multi Conference of Engineers and
Computer Scientists, Hong Kong, pp.1803-1808.
[23] Tzeng, Y.F., Chen, F.C., 2007. Multi-Objective Optimization of High-Speed Electrical
Discharge Machining Process Using a Taguchi Fuzzy-Based Approach. Materials & Design 28
(4), pp. 1159-1168.
[24] Wang, C.C., Yan, B.H., 2000. Blind-Hole Drilling of Al2O3/6061Al Composite Using Rotary
Electrical Discharge Machining. Journal of Materials Processing Technology 102 (1-2), pp. 90-
102.