SlideShare une entreprise Scribd logo
1  sur  20
Apr-2013
1,000,000
Apr-2011
701,000
%
43
Change
299,000
Apr-2011 vs Apr-2013: The median sold price is up 43%
Median Sold Price by Month
Intero Real Estate
Apr-2011 vs. Apr-2013
Ronny Budiutama
Clarus MarketMetrics® 05/04/2013
Information not guaranteed. © 2013 - 2014 Terradatum and its suppliers and licensors (www.terradatum.com/about/licensors.td).
1/2
MLS: SFMLS Bedrooms:
All
All
Construction Type:
All2 Year Monthly SqFt:
Bathrooms: Lot Size:All All Square Footage
Period:All
Cities:
Property Types: : Residential
San Francisco
Price:
Median Sold Price by Month
Apr-2011 vs Apr-2013: The median sold price is up 43%
Intero Real EstateRonny Budiutama
Sold Median Price Units Avg DOMTime Period
Apr-13 1,000,000 205 32
Mar-13 920,000 205 38
Feb-13 800,500 130 40
Jan-13 748,000 161 47
Dec-12 837,500 207 58
Nov-12 810,000 270 42
Oct-12 830,000 256 45
Sep-12 725,000 179 46
Aug-12 766,500 240 50
Jul-12 759,000 216 47
Jun-12 780,000 268 59
May-12 781,000 237 47
Apr-12 760,000 221 54
Mar-12 711,500 223 65
Feb-12 635,000 182 63
Jan-12 635,000 130 81
Dec-11 610,000 231 63
Nov-11 675,000 233 57
Oct-11 743,000 201 54
Sep-11 652,325 211 65
Aug-11 696,060 210 65
Jul-11 735,000 205 62
Jun-11 743,450 265 59
May-11 709,500 222 63
Apr-11 701,000 197 67
Clarus MarketMetrics® 05/04/2013
Information not guaranteed. © 2013 - 2014 Terradatum and its suppliers and licensors (www.terradatum.com/about/licensors.td).
22/
Apr-2011 vs Apr-2013: The median price of for sale properties is up 27% and the median price of sold properties is up 43%
Intero Real Estate
Apr-2011 vs. Apr-2013
699,000 27
Ronny Budiutama
887,500
Apr-2013
Median For Sale vs Median Sold
ChangeApr-2011 %
188,500
Apr-2011 Apr-2013 %
701,000 43
Apr-2011 vs. Apr-2013
1,000,000
Change
299,000
Clarus MarketMetrics® 05/04/2013
Information not guaranteed. © 2013 - 2014 Terradatum and its suppliers and licensors (www.terradatum.com/about/licensors.td).
1/2
MLS: SFMLS Bedrooms:
All
All
Construction Type:
All2 Year Monthly SqFt:
Bathrooms: Lot Size:All All Square Footage
Period:All
Cities:
Property Types: : Residential
San Francisco
Price:
Median For Sale vs Median Sold
Apr-2011 vs Apr-2013: The median price of for sale properties is up 27% and the median price of sold properties is up 43%
Intero Real EstateRonny Budiutama
For SaleMedian SoldMedian
For Sale # Properties # PropertiesSold Price Difference
Time Period
Apr-13 538 205887,500 1,000,000 112,500
Mar-13 521 205899,000 920,000 21,000
Feb-13 462 130850,000 800,500 -49,500
Jan-13 431 161808,000 748,000 -60,000
Dec-12 422 207837,000 837,500 500
Nov-12 563 270845,000 810,000 -35,000
Oct-12 726 256828,000 830,000 2,000
Sep-12 694 179850,000 725,000 -125,000
Aug-12 616 240799,000 766,500 -32,500
Jul-12 645 216789,000 759,000 -30,000
Jun-12 650 268799,000 780,000 -19,000
May-12 718 237750,000 781,000 31,000
Apr-12 712 221699,400 760,000 60,600
Mar-12 740 223699,000 711,500 12,500
Feb-12 694 182699,000 635,000 -64,000
Jan-12 639 130649,950 635,000 -14,950
Dec-11 641 231659,000 610,000 -49,000
Nov-11 834 233678,500 675,000 -3,500
Oct-11 1,014 201668,250 743,000 74,750
Sep-11 1,057 211675,000 652,325 -22,675
Aug-11 971 210650,000 696,060 46,060
Jul-11 1,001 205659,000 735,000 76,000
Jun-11 976 265678,000 743,450 65,450
May-11 914 222689,000 709,500 20,500
Apr-11 924 197699,000 701,000 2,000
Clarus MarketMetrics®
Information not guaranteed. © 2013 - 2014 Terradatum and its suppliers and licensors (www.terradatum.com/about/licensors.td).
05/04/201322/
Apr-2013
205
Apr-2011
197
%
4
Change
8
Apr-2011 vs Apr-2013: The number of Sold properties is up 4%
Sold Properties by Month
Intero Real Estate
Apr-2011 vs. Apr-2013
Ronny Budiutama
Clarus MarketMetrics® 05/04/2013
Information not guaranteed. © 2013 - 2014 Terradatum and its suppliers and licensors (www.terradatum.com/about/licensors.td).
1/2
MLS: SFMLS Bedrooms:
All
All
Construction Type:
All2 Year Monthly SqFt:
Bathrooms: Lot Size:All All Square Footage
Period:All
Cities:
Property Types: : Residential
San Francisco
Price:
Sold Properties by Month
Apr-2011 vs Apr-2013: The number of Sold properties is up 4%
Intero Real EstateRonny Budiutama
Time Period
Full Market
Units Median Price Avg DOM
Bank Properties
Units % Bank Median Price
Non-Bank Properties
Units % Non-Bank Median Price
Apr-13 1,000,000205 32 16 7.8 580,500 189 92.2 1,050,000
Mar-13 920,000205 38 18 8.8 547,500 187 91.2 955,000
Feb-13 800,500130 40 20 15.4 508,500 110 84.6 876,000
Jan-13 748,000161 47 23 14.3 500,000 138 85.7 786,500
Dec-12 837,500207 58 25 12.1 488,000 182 87.9 909,000
Nov-12 810,000270 42 27 10.0 495,000 243 90.0 855,000
Oct-12 830,000256 45 27 10.5 495,000 229 89.5 912,000
Sep-12 725,000179 46 30 16.8 467,500 149 83.2 772,000
Aug-12 766,500240 50 32 13.3 485,000 208 86.7 810,750
Jul-12 759,000216 47 43 19.9 385,000 173 80.1 890,000
Jun-12 780,000268 59 55 20.5 500,000 213 79.5 840,000
May-12 781,000237 47 31 13.1 480,000 206 86.9 834,500
Apr-12 760,000221 54 38 17.2 437,000 183 82.8 801,000
Mar-12 711,500223 65 52 23.3 465,000 171 76.7 780,000
Feb-12 635,000182 63 41 22.5 460,000 141 77.5 700,000
Jan-12 635,000130 81 41 31.5 488,000 89 68.5 730,000
Dec-11 610,000231 63 47 20.3 471,000 184 79.7 685,500
Nov-11 675,000233 57 36 15.5 432,500 197 84.5 749,000
Oct-11 743,000201 54 34 16.9 458,500 167 83.1 792,000
Sep-11 652,325211 65 49 23.2 450,000 162 76.8 732,000
Aug-11 696,060210 65 45 21.4 430,000 165 78.6 750,000
Jul-11 735,000205 62 36 17.6 453,000 169 82.4 825,000
Jun-11 743,450265 59 44 16.6 459,500 221 83.4 765,000
May-11 709,500222 63 48 21.6 451,000 174 78.4 757,500
Apr-11 701,000197 67 42 21.3 434,000 155 78.7 825,000
Clarus MarketMetrics® 05/04/2013
Information not guaranteed. © 2013 - 2014 Terradatum and its suppliers and licensors (www.terradatum.com/about/licensors.td).
22/
Apr-2013
248
Apr-2011
213
%
16
Change
35
Apr-2011 vs Apr-2013: The number of Under Contract properties is up 16%
Under Contract Properties by Month
Intero Real Estate
Apr-2011 vs. Apr-2013
Ronny Budiutama
Clarus MarketMetrics® 05/04/2013
Information not guaranteed. © 2013 - 2014 Terradatum and its suppliers and licensors (www.terradatum.com/about/licensors.td).
1/2
AllBathrooms: SqFt:
All
: Residential
All Square FootageConstruction Type: Lot Size:SFMLS
San Francisco
Period: 2 Year Monthly
Price:
MLS:
All AllAll
Property Types:
Bedrooms:
Cities:
Under Contract Properties by Month
Apr-2011 vs Apr-2013: The number of Under Contract properties is up 16%
Intero Real EstateRonny Budiutama
Median Price UnitsUnits Median Price% Non-Bank
Full Market
% BankAvg DOMMedian Price
Bank Properties
Units
Non-Bank Properties
Time Period
Apr-13 898,500248 26 925,00094.0233529,9006.015
Mar-13 849,000227 29 899,00093.4212500,0006.615
Feb-13 799,000171 35 875,00087.1149526,50012.922
Jan-13 779,000147 41 799,00087.8129552,75012.218
Dec-12 699,000146 48 764,90080.1117559,90019.929
Nov-12 767,000210 58 799,00087.1183469,90012.927
Oct-12 799,000293 38 809,00091.1267469,9258.926
Sep-12 799,000226 43 849,00088.5200454,50011.526
Aug-12 699,000198 37 749,00089.4177410,00010.621
Jul-12 729,000235 46 779,00086.4203494,45013.632
Jun-12 699,000203 46 799,00084.2171399,49915.832
May-12 738,000277 55 799,00081.2225446,25018.852
Apr-12 719,000220 50 799,00083.2183499,00016.837
Mar-12 722,450254 52 799,00080.7205425,00019.349
Feb-12 704,231214 65 775,00076.2163450,00023.851
Jan-12 649,000166 67 780,00072.9121420,00027.145
Dec-11 604,500134 76 677,00077.6104494,45022.430
Nov-11 614,000216 71 699,00076.4165429,00023.651
Oct-11 665,000247 66 775,00076.5189468,90023.558
Sep-11 700,000219 61 787,00084.9186488,00015.133
Aug-11 679,000213 61 731,50078.9168444,90021.145
Jul-11 649,888223 57 725,00078.5175434,77721.548
Jun-11 699,000221 64 762,00080.5178429,90019.543
May-11 725,000239 57 798,00083.7200449,00016.339
Apr-11 729,000213 57 793,50083.6178488,00016.435
Clarus MarketMetrics® 05/04/2013
Information not guaranteed. © 2013 - 2014 Terradatum and its suppliers and licensors (www.terradatum.com/about/licensors.td).
22/
Apr-2013
268
Apr-2011
293
%
-9
Change
-25
Apr-2011 vs Apr-2013: The number of New properties is down -9%
New Properties by Month
Intero Real Estate
Apr-2011 vs. Apr-2013
Ronny Budiutama
Clarus MarketMetrics® 05/04/2013
Information not guaranteed. © 2013 - 2014 Terradatum and its suppliers and licensors (www.terradatum.com/about/licensors.td).
1/2
MLS: SFMLS Bedrooms:
All
All
Construction Type:
All2 Year Monthly SqFt:
Bathrooms: Lot Size:All All Square Footage
Period:All
Cities:
Property Types: : Residential
San Francisco
Price:
New Properties by Month
Apr-2011 vs Apr-2013: The number of New properties is down -9%
Intero Real EstateRonny Budiutama
Median Price UnitsUnits Median Price% Non-Bank
Full Market
% BankMedian Price
Bank Properties
Units
Non-Bank Properties
Time Period
Apr-13 827,000268 12 4.5 499,950 256 95.5 848,500
Mar-13 899,000250 20 8.0 544,950 230 92.0 930,250
Feb-13 849,000204 12 5.9 671,950 192 94.1 862,500
Jan-13 773,500208 25 12.0 499,900 183 88.0 799,000
Dec-12 699,000102 22 21.6 543,450 80 78.4 749,000
Nov-12 799,000183 24 13.1 577,500 159 86.9 825,000
Oct-12 789,000293 32 10.9 501,700 261 89.1 799,000
Sep-12 850,000322 32 9.9 454,500 290 90.1 942,000
Aug-12 795,000257 27 10.5 449,900 230 89.5 825,000
Jul-12 699,000257 33 12.8 498,000 224 87.2 762,500
Jun-12 829,000261 30 11.5 450,000 231 88.5 874,000
May-12 829,000267 44 16.5 444,000 223 83.5 949,000
Apr-12 722,500268 48 17.9 486,400 220 82.1 804,500
Mar-12 722,450298 50 16.8 433,350 248 83.2 818,500
Feb-12 749,000263 51 19.4 424,900 212 80.6 834,500
Jan-12 675,000251 61 24.3 415,000 190 75.7 788,708
Dec-11 559,900121 47 38.8 474,900 74 61.2 644,000
Nov-11 678,000151 39 25.8 459,999 112 74.2 749,500
Oct-11 678,500260 52 20.0 402,375 208 80.0 727,500
Sep-11 735,000397 74 18.6 462,450 323 81.4 798,000
Aug-11 649,000289 58 20.1 468,900 231 79.9 715,000
Jul-11 692,000330 62 18.8 492,450 268 81.2 738,500
Jun-11 698,000349 78 22.3 430,550 271 77.7 775,000
May-11 699,000279 65 23.3 430,000 214 76.7 761,500
Apr-11 779,000293 43 14.7 475,000 250 85.3 849,499
Clarus MarketMetrics® 05/04/2013
Information not guaranteed. © 2013 - 2014 Terradatum and its suppliers and licensors (www.terradatum.com/about/licensors.td).
22/
Apr-2013
538
Apr-2011
924
%
-42
Change
-386
Apr-2011 vs Apr-2013: The number of For Sale properties is down -42%
For Sale Properties by Month
Intero Real Estate
Apr-2011 vs. Apr-2013
Ronny Budiutama
Clarus MarketMetrics® 05/04/2013
Information not guaranteed. © 2013 - 2014 Terradatum and its suppliers and licensors (www.terradatum.com/about/licensors.td).
1/2
MLS: SFMLS Bedrooms:
All
All
Construction Type:
All2 Year Monthly SqFt:
Bathrooms: Lot Size:All All Square Footage
Period:All
Cities:
Property Types: : Residential
San Francisco
Price:
For Sale Properties by Month
Apr-2011 vs Apr-2013: The number of For Sale properties is down -42%
Intero Real EstateRonny Budiutama
Median Price UnitsUnits Median Price% Non-Bank
Full Market
% BankAvg DOMMedian Price
Bank Properties
Units
Non-Bank Properties
Time Period
Apr-13 887,500538 52 40 7.4 579,000 498 92.6 899,500
Mar-13 899,000521 55 45 8.6 574,900 476 91.4 949,999
Feb-13 850,000462 63 52 11.3 539,450 410 88.7 926,500
Jan-13 808,000431 71 63 14.6 500,000 368 85.4 899,000
Dec-12 837,000422 80 73 17.3 525,000 349 82.7 949,000
Nov-12 845,000563 68 81 14.4 510,000 482 85.6 926,500
Oct-12 828,000726 60 93 12.8 495,000 633 87.2 899,000
Sep-12 850,000694 58 94 13.5 459,950 600 86.5 949,000
Aug-12 799,000616 63 92 14.9 450,000 524 85.1 879,000
Jul-12 789,000645 65 109 16.9 479,000 536 83.1 889,500
Jun-12 799,000650 67 122 18.8 450,000 528 81.2 927,000
May-12 750,000718 70 162 22.6 454,750 556 77.4 899,000
Apr-12 699,400712 71 166 23.3 468,944 546 76.7 830,000
Mar-12 699,000740 71 179 24.2 449,900 561 75.8 799,000
Feb-12 699,000694 81 195 28.1 450,000 499 71.9 799,000
Jan-12 649,950639 92 201 31.5 450,000 438 68.5 775,000
Dec-11 659,000641 109 191 29.8 470,000 450 70.2 749,000
Nov-11 678,500834 94 216 25.9 457,000 618 74.1 750,000
Oct-11 668,2501,014 81 259 25.5 455,000 755 74.5 749,000
Sep-11 675,0001,057 75 263 24.9 467,900 794 75.1 759,000
Aug-11 650,000971 80 257 26.5 459,000 714 73.5 749,000
Jul-11 659,0001,001 76 268 26.8 449,900 733 73.2 759,000
Jun-11 678,000976 77 265 27.2 435,000 711 72.8 786,000
May-11 689,000914 77 233 25.5 448,888 681 74.5 799,000
Apr-11 699,000924 74 223 24.1 449,950 701 75.9 799,000
Clarus MarketMetrics® 05/04/2013
Information not guaranteed. © 2013 - 2014 Terradatum and its suppliers and licensors (www.terradatum.com/about/licensors.td).
22/
Apr-2013
27
Apr-2011
76
%
-64
Change
-49
Apr-2011 vs Apr-2013: The number of Expired properties is down -64%
Expired Properties by Month
Intero Real Estate
Apr-2011 vs. Apr-2013
Ronny Budiutama
05/04/2013Clarus MarketMetrics® 1/2
MLS: SFMLS Bedrooms:
All
All
Construction Type:
All2 Year Monthly SqFt:
Bathrooms: Lot Size:All All Square Footage
Period:All
Cities:
Property Types: : Residential
San Francisco
Price:
Expired Properties by Month
Apr-2011 vs Apr-2013: The number of Expired properties is down -64%
Intero Real EstateRonny Budiutama
Median Price Units% BankAvg DOMUnits Median Price
Bank Properties
Units
Non-Bank Properties
% Non-Bank Median Price
Full Market
Apr-13 815,00027 79 8 29.6 579,000 19 70.4 850,000
Mar-13 749,50024 113 2 8.3 599,950 22 91.7 783,500
Feb-13 728,95020 98 5 25.0 475,000 15 75.0 849,000
Jan-13 724,50026 91 5 19.2 500,000 21 80.8 899,000
Dec-12 1,495,00053 82 6 11.3 449,000 47 88.7 1,750,000
Nov-12 1,200,00033 78 3 9.1 680,000 30 90.9 1,332,000
Oct-12 988,00053 116 10 18.9 513,500 43 81.1 1,239,000
Sep-12 918,00035 71 7 20.0 368,000 28 80.0 999,000
Aug-12 833,50046 85 9 19.6 499,000 37 80.4 1,059,000
Jul-12 1,360,00051 84 12 23.5 474,500 39 76.5 1,699,000
Jun-12 879,00059 72 14 23.7 512,050 45 76.3 1,095,000
May-12 678,50052 69 18 34.6 454,750 34 65.4 898,500
Apr-12 675,00041 81 11 26.8 487,000 30 73.2 789,000
Mar-12 639,47542 87 12 28.6 424,500 30 71.4 764,000
Feb-12 649,50038 122 15 39.5 484,950 23 60.5 949,000
Jan-12 599,45042 120 12 28.6 444,500 30 71.4 799,000
Dec-11 770,000119 113 21 17.6 490,000 98 82.4 849,500
Nov-11 669,00098 96 21 21.4 450,000 77 78.6 764,000
Oct-11 628,75084 101 24 28.6 449,500 60 71.4 723,000
Sep-11 668,50084 104 23 27.4 405,000 61 72.6 738,000
Aug-11 759,50098 92 23 23.5 448,888 75 76.5 799,950
Jul-11 699,47596 92 21 21.9 435,000 75 78.1 786,000
Jun-11 769,00084 109 16 19.0 404,500 68 81.0 849,500
May-11 784,00048 108 7 14.6 434,900 41 85.4 850,000
Apr-11 676,50076 113 20 26.3 425,000 56 73.7 786,500
Clarus MarketMetrics® 05/04/2013
Information not guaranteed. © 2013 - 2014 Terradatum and its suppliers and licensors (www.terradatum.com/about/licensors.td).
22/
Apr-2011 vs Apr-2013: The number of for sale properties is down -42% and the number of sold properties is up 4%
Intero Real Estate
Apr-2011 vs. Apr-2013
924 -42
Ronny Budiutama
538
Apr-2013
Supply & Demand by Month
ChangeApr-2011 %
-386
Apr-2011 Apr-2013 %
197 4
Apr-2011 vs. Apr-2013
205
Change
8
Clarus MarketMetrics® 05/04/2013
Information not guaranteed. © 2013 - 2014 Terradatum and its suppliers and licensors (www.terradatum.com/about/licensors.td).
1/2
MLS: SFMLS Bedrooms:
All
All
Construction Type:
All2 Year Monthly SqFt:
Bathrooms: Lot Size:All All Square Footage
Period:All
Cities:
Property Types: : Residential
San Francisco
Price:
Supply & Demand by Month
Apr-2011 vs Apr-2013: The number of for sale properties is down -42% and the number of sold properties is up 4%
Ronny Budiutama Intero Real Estate
For Sale Sold
# Properties
Avg DOM Avg DOM
# Properties
Time Period
Apr-13 52 32538 205
Mar-13 55 38521 205
Feb-13 63 40462 130
Jan-13 71 47431 161
Dec-12 80 58422 207
Nov-12 68 42563 270
Oct-12 60 45726 256
Sep-12 58 46694 179
Aug-12 63 50616 240
Jul-12 65 47645 216
Jun-12 67 59650 268
May-12 70 47718 237
Apr-12 71 54712 221
Mar-12 71 65740 223
Feb-12 81 63694 182
Jan-12 92 81639 130
Dec-11 109 63641 231
Nov-11 94 57834 233
Oct-11 81 541,014 201
Sep-11 75 651,057 211
Aug-11 80 65971 210
Jul-11 76 621,001 205
Jun-11 77 59976 265
May-11 77 63914 222
Apr-11 74 67924 197
Clarus MarketMetrics® 05/04/2013
Information not guaranteed. © 2013 - 2014 Terradatum and its suppliers and licensors (www.terradatum.com/about/licensors.td).
22/
Apr-2013
26
Apr-2011
57
%
-55
Change
-31
Apr-2011 vs Apr-2013: The average days on market is down -55%
The Average Days on Market by Month
Intero Real Estate
Apr-2011 vs. Apr-2013
Ronny Budiutama
San Francisco
All 2 Year Monthly
Cities:
Period:Price:
Property Types: : Residential
05/04/20131/2Clarus MarketMetrics®
All Square Footage
Bedrooms: All AllSqFt:
All Lot Size:Bathrooms:AllConstruction Type:
MLS: SFMLS
The Average Days on Market by Month
Apr-2011 vs Apr-2013: The average days on market is down -55%
Intero Real EstateRonny Budiutama
# UC UnitsAvg DOMTime Period
Apr-13 24826
Mar-13 22729
Feb-13 17135
Jan-13 14741
Dec-12 14648
Nov-12 21058
Oct-12 29338
Sep-12 22643
Aug-12 19837
Jul-12 23546
Jun-12 20346
May-12 27755
Apr-12 22050
Mar-12 25452
Feb-12 21465
Jan-12 16667
Dec-11 13476
Nov-11 21671
Oct-11 24766
Sep-11 21961
Aug-11 21361
Jul-11 22357
Jun-11 22164
May-11 23957
Apr-11 21357
Clarus MarketMetrics® 2/2 05/04/2013
Information not guaranteed. © 2013 - 2014 Terradatum and its suppliers and licensors (www.terradatum.com/about/licensors.td).
Apr-2011 vs Apr-2013: The average months supply of inventory is down -64%
Intero Real Estate
Apr-2011 vs. Apr-2013
3 -64
Ronny Budiutama
1.01
Apr-2013
Months Supply of Inventory
ChangeApr-2011 %
-1.9
Clarus MarketMetrics® 05/04/2013
Information not guaranteed. © 2013 - 2014 Terradatum and its suppliers and licensors (www.terradatum.com/about/licensors.td).
1/2
MLS: SFMLS Bedrooms:
All
All
Construction Type:
All2 Year Monthly SqFt:
Bathrooms: Lot Size:All All Square Footage
Period:All
Cities:
Property Types: : Residential
San Francisco
Price:
Months Supply of Inventory
Apr-2011 vs Apr-2013: The average months supply of inventory is down -64%
Ronny Budiutama Intero Real Estate
During MonthLast Day of Month MSI
# Units For Sale # UC Units
UC Avg DOMTime Period
Apr-13 248 26263 1.1
Mar-13 227 29270 1.2
Feb-13 171 35271 1.6
Jan-13 147 41258 1.8
Dec-12 146 48223 1.5
Nov-12 210 58320 1.5
Oct-12 293 38380 1.3
Sep-12 226 43433 1.9
Aug-12 198 37372 1.9
Jul-12 235 46359 1.5
Jun-12 203 46388 1.9
May-12 277 55389 1.4
Apr-12 220 50451 2.0
Mar-12 254 52444 1.7
Feb-12 214 65442 2.1
Jan-12 166 67431 2.6
Dec-11 134 76388 2.9
Nov-11 216 71520 2.4
Oct-11 247 66683 2.8
Sep-11 219 61754 3.4
Aug-11 213 61660 3.1
Jul-11 223 57682 3.1
Jun-11 221 64671 3.0
May-11 239 57627 2.6
Apr-11 213 57635 3.0
Clarus MarketMetrics® 05/04/2013
Information not guaranteed. © 2013 - 2014 Terradatum and its suppliers and licensors (www.terradatum.com/about/licensors.td).
22/

Contenu connexe

Tendances

San Francisco Market Report February 2021
San Francisco Market Report February 2021San Francisco Market Report February 2021
San Francisco Market Report February 2021Ronny Budiutama
 
San Francisco Market Focus October 2014
San Francisco Market Focus October 2014San Francisco Market Focus October 2014
San Francisco Market Focus October 2014Ronny Budiutama
 
San Francisco Market Data December 2014
San Francisco Market Data December 2014San Francisco Market Data December 2014
San Francisco Market Data December 2014Ronny Budiutama
 
San Francisco Market Focus October 2016
San Francisco Market Focus October 2016San Francisco Market Focus October 2016
San Francisco Market Focus October 2016Ronny Budiutama
 
San Francisco Market Focus May 2013
San Francisco Market Focus May 2013San Francisco Market Focus May 2013
San Francisco Market Focus May 2013Ronny Budiutama
 
San Francisco Market Focus October 2013
San Francisco Market Focus October 2013San Francisco Market Focus October 2013
San Francisco Market Focus October 2013Ronny Budiutama
 
San Francisco Market Report September 2021
San Francisco Market Report September 2021San Francisco Market Report September 2021
San Francisco Market Report September 2021Ronny Budiutama
 
San Francisco Market Focus Sept 2017
San Francisco Market Focus Sept 2017San Francisco Market Focus Sept 2017
San Francisco Market Focus Sept 2017Ronny Budiutama
 
San Francisco Market Report October 2021
San Francisco Market Report October 2021San Francisco Market Report October 2021
San Francisco Market Report October 2021Ronny Budiutama
 
San Francisco Market Focus September 2015
San Francisco Market Focus September 2015San Francisco Market Focus September 2015
San Francisco Market Focus September 2015Ronny Budiutama
 
San Francisco Market Report August 2021
San Francisco Market Report August 2021San Francisco Market Report August 2021
San Francisco Market Report August 2021Ronny Budiutama
 
San Francisco Market Report For July 2021
San Francisco Market Report For July 2021San Francisco Market Report For July 2021
San Francisco Market Report For July 2021Ronny Budiutama
 
San Francisco Market Focus April 2015
San Francisco Market Focus April 2015San Francisco Market Focus April 2015
San Francisco Market Focus April 2015Ronny Budiutama
 
San Francisco Market Report December 2021
San Francisco Market Report December 2021San Francisco Market Report December 2021
San Francisco Market Report December 2021Ronny Budiutama
 
San Francisco Market Focus Report October 2018
San Francisco Market Focus Report October 2018San Francisco Market Focus Report October 2018
San Francisco Market Focus Report October 2018Ronny Budiutama
 
San Francisco Market Report November 2021
San Francisco Market Report November 2021San Francisco Market Report November 2021
San Francisco Market Report November 2021Ronny Budiutama
 
San Francisco Market Focus July 2015
San Francisco Market Focus July 2015San Francisco Market Focus July 2015
San Francisco Market Focus July 2015Ronny Budiutama
 
2014 Market Forecast - California Association of Realtors
2014 Market Forecast - California Association of Realtors2014 Market Forecast - California Association of Realtors
2014 Market Forecast - California Association of RealtorsRonny Budiutama
 
San Francisco Market Report January 2021
San Francisco Market Report January 2021San Francisco Market Report January 2021
San Francisco Market Report January 2021Ronny Budiutama
 
San Francisco Market Focus June 2015
San Francisco Market Focus June 2015San Francisco Market Focus June 2015
San Francisco Market Focus June 2015Ronny Budiutama
 

Tendances (20)

San Francisco Market Report February 2021
San Francisco Market Report February 2021San Francisco Market Report February 2021
San Francisco Market Report February 2021
 
San Francisco Market Focus October 2014
San Francisco Market Focus October 2014San Francisco Market Focus October 2014
San Francisco Market Focus October 2014
 
San Francisco Market Data December 2014
San Francisco Market Data December 2014San Francisco Market Data December 2014
San Francisco Market Data December 2014
 
San Francisco Market Focus October 2016
San Francisco Market Focus October 2016San Francisco Market Focus October 2016
San Francisco Market Focus October 2016
 
San Francisco Market Focus May 2013
San Francisco Market Focus May 2013San Francisco Market Focus May 2013
San Francisco Market Focus May 2013
 
San Francisco Market Focus October 2013
San Francisco Market Focus October 2013San Francisco Market Focus October 2013
San Francisco Market Focus October 2013
 
San Francisco Market Report September 2021
San Francisco Market Report September 2021San Francisco Market Report September 2021
San Francisco Market Report September 2021
 
San Francisco Market Focus Sept 2017
San Francisco Market Focus Sept 2017San Francisco Market Focus Sept 2017
San Francisco Market Focus Sept 2017
 
San Francisco Market Report October 2021
San Francisco Market Report October 2021San Francisco Market Report October 2021
San Francisco Market Report October 2021
 
San Francisco Market Focus September 2015
San Francisco Market Focus September 2015San Francisco Market Focus September 2015
San Francisco Market Focus September 2015
 
San Francisco Market Report August 2021
San Francisco Market Report August 2021San Francisco Market Report August 2021
San Francisco Market Report August 2021
 
San Francisco Market Report For July 2021
San Francisco Market Report For July 2021San Francisco Market Report For July 2021
San Francisco Market Report For July 2021
 
San Francisco Market Focus April 2015
San Francisco Market Focus April 2015San Francisco Market Focus April 2015
San Francisco Market Focus April 2015
 
San Francisco Market Report December 2021
San Francisco Market Report December 2021San Francisco Market Report December 2021
San Francisco Market Report December 2021
 
San Francisco Market Focus Report October 2018
San Francisco Market Focus Report October 2018San Francisco Market Focus Report October 2018
San Francisco Market Focus Report October 2018
 
San Francisco Market Report November 2021
San Francisco Market Report November 2021San Francisco Market Report November 2021
San Francisco Market Report November 2021
 
San Francisco Market Focus July 2015
San Francisco Market Focus July 2015San Francisco Market Focus July 2015
San Francisco Market Focus July 2015
 
2014 Market Forecast - California Association of Realtors
2014 Market Forecast - California Association of Realtors2014 Market Forecast - California Association of Realtors
2014 Market Forecast - California Association of Realtors
 
San Francisco Market Report January 2021
San Francisco Market Report January 2021San Francisco Market Report January 2021
San Francisco Market Report January 2021
 
San Francisco Market Focus June 2015
San Francisco Market Focus June 2015San Francisco Market Focus June 2015
San Francisco Market Focus June 2015
 

Similaire à San francisco residential apr 2011 apr 2013

San Francisco South Beach april 2011 april 2013
San Francisco South Beach april 2011   april 2013San Francisco South Beach april 2011   april 2013
San Francisco South Beach april 2011 april 2013Ronny Budiutama
 
Sherwood Forest Subdivision Baton Rouge Home Sales Q3 2011 vs Q3 2014
Sherwood Forest Subdivision Baton Rouge Home Sales Q3 2011 vs Q3 2014Sherwood Forest Subdivision Baton Rouge Home Sales Q3 2011 vs Q3 2014
Sherwood Forest Subdivision Baton Rouge Home Sales Q3 2011 vs Q3 2014Bill Cobb, Appraiser
 
Central City Louisiana Baton Rouge Existing and New Home Sales Prices June 20...
Central City Louisiana Baton Rouge Existing and New Home Sales Prices June 20...Central City Louisiana Baton Rouge Existing and New Home Sales Prices June 20...
Central City Louisiana Baton Rouge Existing and New Home Sales Prices June 20...Bill Cobb, Appraiser
 
Ascension Parish New Home Sales $150K to $300K 03 12 2013 to 03 12 2014 Zip C...
Ascension Parish New Home Sales $150K to $300K 03 12 2013 to 03 12 2014 Zip C...Ascension Parish New Home Sales $150K to $300K 03 12 2013 to 03 12 2014 Zip C...
Ascension Parish New Home Sales $150K to $300K 03 12 2013 to 03 12 2014 Zip C...Bill Cobb, Appraiser
 
Central City Louisiana Baton Rouge Home Sales February 2013 vs Feb 2014
Central City Louisiana Baton Rouge Home Sales February 2013 vs Feb 2014Central City Louisiana Baton Rouge Home Sales February 2013 vs Feb 2014
Central City Louisiana Baton Rouge Home Sales February 2013 vs Feb 2014Bill Cobb, Appraiser
 
Ascension Parish New Home Sales $175K to $245K 03 12 2013 to 03 12 2014 Zip C...
Ascension Parish New Home Sales $175K to $245K 03 12 2013 to 03 12 2014 Zip C...Ascension Parish New Home Sales $175K to $245K 03 12 2013 to 03 12 2014 Zip C...
Ascension Parish New Home Sales $175K to $245K 03 12 2013 to 03 12 2014 Zip C...Bill Cobb, Appraiser
 
Galveston County Condo Townhome Sales Report
Galveston County Condo Townhome Sales ReportGalveston County Condo Townhome Sales Report
Galveston County Condo Townhome Sales ReportJeff Bulman
 
East Baton Rouge Condo Townhome Sales in Zip Codes 70806 70808 70809 January ...
East Baton Rouge Condo Townhome Sales in Zip Codes 70806 70808 70809 January ...East Baton Rouge Condo Townhome Sales in Zip Codes 70806 70808 70809 January ...
East Baton Rouge Condo Townhome Sales in Zip Codes 70806 70808 70809 January ...Bill Cobb, Appraiser
 
Ascension Parish New Home Sales September 2014 Greater Baton Rouge
Ascension Parish New Home Sales September 2014 Greater Baton RougeAscension Parish New Home Sales September 2014 Greater Baton Rouge
Ascension Parish New Home Sales September 2014 Greater Baton RougeBill Cobb, Appraiser
 
Livingston Parish New Home Sales $130K to $240K 03 12 2013 to 03 14 2014 Zip ...
Livingston Parish New Home Sales $130K to $240K 03 12 2013 to 03 14 2014 Zip ...Livingston Parish New Home Sales $130K to $240K 03 12 2013 to 03 14 2014 Zip ...
Livingston Parish New Home Sales $130K to $240K 03 12 2013 to 03 14 2014 Zip ...Bill Cobb, Appraiser
 
Greenwood Estates Baton Rouge Real Estate Home Sales Q3 2011 vs Q3 2014 as of...
Greenwood Estates Baton Rouge Real Estate Home Sales Q3 2011 vs Q3 2014 as of...Greenwood Estates Baton Rouge Real Estate Home Sales Q3 2011 vs Q3 2014 as of...
Greenwood Estates Baton Rouge Real Estate Home Sales Q3 2011 vs Q3 2014 as of...Bill Cobb, Appraiser
 
Greater Baton Rouge Existing Homes Sold Stats For October 2014
Greater Baton Rouge Existing Homes Sold Stats For October 2014Greater Baton Rouge Existing Homes Sold Stats For October 2014
Greater Baton Rouge Existing Homes Sold Stats For October 2014Bill Cobb, Appraiser
 
Ascension Parish Existing Home Sales September 2014 Greater Baton Rouge
Ascension Parish Existing Home Sales September 2014 Greater Baton RougeAscension Parish Existing Home Sales September 2014 Greater Baton Rouge
Ascension Parish Existing Home Sales September 2014 Greater Baton RougeBill Cobb, Appraiser
 
Greater Baton Rouge Existing Home Sales Home Prices February 2013 vs Feb 2014
Greater Baton Rouge Existing Home Sales Home Prices February 2013 vs Feb 2014Greater Baton Rouge Existing Home Sales Home Prices February 2013 vs Feb 2014
Greater Baton Rouge Existing Home Sales Home Prices February 2013 vs Feb 2014Bill Cobb, Appraiser
 
Livingston Parish Louisiana Home Sales Prices June 2013 vs June 2014 Denham S...
Livingston Parish Louisiana Home Sales Prices June 2013 vs June 2014 Denham S...Livingston Parish Louisiana Home Sales Prices June 2013 vs June 2014 Denham S...
Livingston Parish Louisiana Home Sales Prices June 2013 vs June 2014 Denham S...Bill Cobb, Appraiser
 
Castaic California housing and real estate market
Castaic California housing and real estate marketCastaic California housing and real estate market
Castaic California housing and real estate marketConnor T. MacIVOR
 
East Baton Rouge Existing and New Home Sales and Prices June 2013 vs June 2014
East Baton Rouge Existing and New Home Sales and Prices June 2013 vs June 2014East Baton Rouge Existing and New Home Sales and Prices June 2013 vs June 2014
East Baton Rouge Existing and New Home Sales and Prices June 2013 vs June 2014Bill Cobb, Appraiser
 
Geismar Louisiana Housing Market Home Sales Prices $100K to $1,000,000 ALL Ho...
Geismar Louisiana Housing Market Home Sales Prices $100K to $1,000,000 ALL Ho...Geismar Louisiana Housing Market Home Sales Prices $100K to $1,000,000 ALL Ho...
Geismar Louisiana Housing Market Home Sales Prices $100K to $1,000,000 ALL Ho...Bill Cobb, Appraiser
 
Stevenson Ranch housing market reports February 2012
Stevenson Ranch housing market reports February 2012Stevenson Ranch housing market reports February 2012
Stevenson Ranch housing market reports February 2012Connor T. MacIVOR
 
Baton Rouge Home Sales For June 2013 2014
Baton Rouge Home Sales For June 2013 2014Baton Rouge Home Sales For June 2013 2014
Baton Rouge Home Sales For June 2013 2014Bill Cobb, Appraiser
 

Similaire à San francisco residential apr 2011 apr 2013 (20)

San Francisco South Beach april 2011 april 2013
San Francisco South Beach april 2011   april 2013San Francisco South Beach april 2011   april 2013
San Francisco South Beach april 2011 april 2013
 
Sherwood Forest Subdivision Baton Rouge Home Sales Q3 2011 vs Q3 2014
Sherwood Forest Subdivision Baton Rouge Home Sales Q3 2011 vs Q3 2014Sherwood Forest Subdivision Baton Rouge Home Sales Q3 2011 vs Q3 2014
Sherwood Forest Subdivision Baton Rouge Home Sales Q3 2011 vs Q3 2014
 
Central City Louisiana Baton Rouge Existing and New Home Sales Prices June 20...
Central City Louisiana Baton Rouge Existing and New Home Sales Prices June 20...Central City Louisiana Baton Rouge Existing and New Home Sales Prices June 20...
Central City Louisiana Baton Rouge Existing and New Home Sales Prices June 20...
 
Ascension Parish New Home Sales $150K to $300K 03 12 2013 to 03 12 2014 Zip C...
Ascension Parish New Home Sales $150K to $300K 03 12 2013 to 03 12 2014 Zip C...Ascension Parish New Home Sales $150K to $300K 03 12 2013 to 03 12 2014 Zip C...
Ascension Parish New Home Sales $150K to $300K 03 12 2013 to 03 12 2014 Zip C...
 
Central City Louisiana Baton Rouge Home Sales February 2013 vs Feb 2014
Central City Louisiana Baton Rouge Home Sales February 2013 vs Feb 2014Central City Louisiana Baton Rouge Home Sales February 2013 vs Feb 2014
Central City Louisiana Baton Rouge Home Sales February 2013 vs Feb 2014
 
Ascension Parish New Home Sales $175K to $245K 03 12 2013 to 03 12 2014 Zip C...
Ascension Parish New Home Sales $175K to $245K 03 12 2013 to 03 12 2014 Zip C...Ascension Parish New Home Sales $175K to $245K 03 12 2013 to 03 12 2014 Zip C...
Ascension Parish New Home Sales $175K to $245K 03 12 2013 to 03 12 2014 Zip C...
 
Galveston County Condo Townhome Sales Report
Galveston County Condo Townhome Sales ReportGalveston County Condo Townhome Sales Report
Galveston County Condo Townhome Sales Report
 
East Baton Rouge Condo Townhome Sales in Zip Codes 70806 70808 70809 January ...
East Baton Rouge Condo Townhome Sales in Zip Codes 70806 70808 70809 January ...East Baton Rouge Condo Townhome Sales in Zip Codes 70806 70808 70809 January ...
East Baton Rouge Condo Townhome Sales in Zip Codes 70806 70808 70809 January ...
 
Ascension Parish New Home Sales September 2014 Greater Baton Rouge
Ascension Parish New Home Sales September 2014 Greater Baton RougeAscension Parish New Home Sales September 2014 Greater Baton Rouge
Ascension Parish New Home Sales September 2014 Greater Baton Rouge
 
Livingston Parish New Home Sales $130K to $240K 03 12 2013 to 03 14 2014 Zip ...
Livingston Parish New Home Sales $130K to $240K 03 12 2013 to 03 14 2014 Zip ...Livingston Parish New Home Sales $130K to $240K 03 12 2013 to 03 14 2014 Zip ...
Livingston Parish New Home Sales $130K to $240K 03 12 2013 to 03 14 2014 Zip ...
 
Greenwood Estates Baton Rouge Real Estate Home Sales Q3 2011 vs Q3 2014 as of...
Greenwood Estates Baton Rouge Real Estate Home Sales Q3 2011 vs Q3 2014 as of...Greenwood Estates Baton Rouge Real Estate Home Sales Q3 2011 vs Q3 2014 as of...
Greenwood Estates Baton Rouge Real Estate Home Sales Q3 2011 vs Q3 2014 as of...
 
Greater Baton Rouge Existing Homes Sold Stats For October 2014
Greater Baton Rouge Existing Homes Sold Stats For October 2014Greater Baton Rouge Existing Homes Sold Stats For October 2014
Greater Baton Rouge Existing Homes Sold Stats For October 2014
 
Ascension Parish Existing Home Sales September 2014 Greater Baton Rouge
Ascension Parish Existing Home Sales September 2014 Greater Baton RougeAscension Parish Existing Home Sales September 2014 Greater Baton Rouge
Ascension Parish Existing Home Sales September 2014 Greater Baton Rouge
 
Greater Baton Rouge Existing Home Sales Home Prices February 2013 vs Feb 2014
Greater Baton Rouge Existing Home Sales Home Prices February 2013 vs Feb 2014Greater Baton Rouge Existing Home Sales Home Prices February 2013 vs Feb 2014
Greater Baton Rouge Existing Home Sales Home Prices February 2013 vs Feb 2014
 
Livingston Parish Louisiana Home Sales Prices June 2013 vs June 2014 Denham S...
Livingston Parish Louisiana Home Sales Prices June 2013 vs June 2014 Denham S...Livingston Parish Louisiana Home Sales Prices June 2013 vs June 2014 Denham S...
Livingston Parish Louisiana Home Sales Prices June 2013 vs June 2014 Denham S...
 
Castaic California housing and real estate market
Castaic California housing and real estate marketCastaic California housing and real estate market
Castaic California housing and real estate market
 
East Baton Rouge Existing and New Home Sales and Prices June 2013 vs June 2014
East Baton Rouge Existing and New Home Sales and Prices June 2013 vs June 2014East Baton Rouge Existing and New Home Sales and Prices June 2013 vs June 2014
East Baton Rouge Existing and New Home Sales and Prices June 2013 vs June 2014
 
Geismar Louisiana Housing Market Home Sales Prices $100K to $1,000,000 ALL Ho...
Geismar Louisiana Housing Market Home Sales Prices $100K to $1,000,000 ALL Ho...Geismar Louisiana Housing Market Home Sales Prices $100K to $1,000,000 ALL Ho...
Geismar Louisiana Housing Market Home Sales Prices $100K to $1,000,000 ALL Ho...
 
Stevenson Ranch housing market reports February 2012
Stevenson Ranch housing market reports February 2012Stevenson Ranch housing market reports February 2012
Stevenson Ranch housing market reports February 2012
 
Baton Rouge Home Sales For June 2013 2014
Baton Rouge Home Sales For June 2013 2014Baton Rouge Home Sales For June 2013 2014
Baton Rouge Home Sales For June 2013 2014
 

Plus de Ronny Budiutama

San Francisco January 2024 Market Report
San Francisco January 2024 Market ReportSan Francisco January 2024 Market Report
San Francisco January 2024 Market ReportRonny Budiutama
 
San Francisco December 2023 Market Report
San Francisco December 2023 Market ReportSan Francisco December 2023 Market Report
San Francisco December 2023 Market ReportRonny Budiutama
 
San Francisco November 2023 Market Report
San Francisco November 2023 Market ReportSan Francisco November 2023 Market Report
San Francisco November 2023 Market ReportRonny Budiutama
 
2023 Annual San Francisco Housing Market
2023 Annual San Francisco Housing Market2023 Annual San Francisco Housing Market
2023 Annual San Francisco Housing MarketRonny Budiutama
 
October 2023 Report: San Francisco Real Estate Market Insights
October 2023 Report: San Francisco Real Estate Market InsightsOctober 2023 Report: San Francisco Real Estate Market Insights
October 2023 Report: San Francisco Real Estate Market InsightsRonny Budiutama
 
CA Weekly MLS Market Data Report - August 2023
CA Weekly MLS Market Data Report - August 2023CA Weekly MLS Market Data Report - August 2023
CA Weekly MLS Market Data Report - August 2023Ronny Budiutama
 
San Francisco Market Report July 2023.pdf
San Francisco Market Report July 2023.pdfSan Francisco Market Report July 2023.pdf
San Francisco Market Report July 2023.pdfRonny Budiutama
 
San Francisco May 2023 Market Report.pdf
San Francisco May 2023 Market Report.pdfSan Francisco May 2023 Market Report.pdf
San Francisco May 2023 Market Report.pdfRonny Budiutama
 
San Francisco June 2023 Market Report.pdf
San Francisco June 2023 Market Report.pdfSan Francisco June 2023 Market Report.pdf
San Francisco June 2023 Market Report.pdfRonny Budiutama
 
San Francisco Market Report March 2023.pdf
San Francisco Market Report March 2023.pdfSan Francisco Market Report March 2023.pdf
San Francisco Market Report March 2023.pdfRonny Budiutama
 
San Francisco Market Report February 2023
San Francisco Market Report February 2023San Francisco Market Report February 2023
San Francisco Market Report February 2023Ronny Budiutama
 
San Francisco Market Report January 2023.pdf
San Francisco Market Report January 2023.pdfSan Francisco Market Report January 2023.pdf
San Francisco Market Report January 2023.pdfRonny Budiutama
 
Annual Report on the San Francisco County Housing Market.pdf
Annual Report on the San Francisco County Housing Market.pdfAnnual Report on the San Francisco County Housing Market.pdf
Annual Report on the San Francisco County Housing Market.pdfRonny Budiutama
 
San Francisco Market Report December 2022.pdf
San Francisco Market Report December 2022.pdfSan Francisco Market Report December 2022.pdf
San Francisco Market Report December 2022.pdfRonny Budiutama
 
San Francisco Market Report November 2022.pdf
San Francisco Market Report November 2022.pdfSan Francisco Market Report November 2022.pdf
San Francisco Market Report November 2022.pdfRonny Budiutama
 
San Francisco Market Report October 2022.pdf
San Francisco Market Report October 2022.pdfSan Francisco Market Report October 2022.pdf
San Francisco Market Report October 2022.pdfRonny Budiutama
 
San Francisco Market Report September 2022.pdf
San Francisco Market Report September 2022.pdfSan Francisco Market Report September 2022.pdf
San Francisco Market Report September 2022.pdfRonny Budiutama
 
San Francisco Market Report August 2022.pdf
San Francisco Market Report August 2022.pdfSan Francisco Market Report August 2022.pdf
San Francisco Market Report August 2022.pdfRonny Budiutama
 
San Francisco Market Report July 2022.pdf
San Francisco Market Report July 2022.pdfSan Francisco Market Report July 2022.pdf
San Francisco Market Report July 2022.pdfRonny Budiutama
 
San Francisco Market Report June 2022.pdf
San Francisco Market Report June 2022.pdfSan Francisco Market Report June 2022.pdf
San Francisco Market Report June 2022.pdfRonny Budiutama
 

Plus de Ronny Budiutama (20)

San Francisco January 2024 Market Report
San Francisco January 2024 Market ReportSan Francisco January 2024 Market Report
San Francisco January 2024 Market Report
 
San Francisco December 2023 Market Report
San Francisco December 2023 Market ReportSan Francisco December 2023 Market Report
San Francisco December 2023 Market Report
 
San Francisco November 2023 Market Report
San Francisco November 2023 Market ReportSan Francisco November 2023 Market Report
San Francisco November 2023 Market Report
 
2023 Annual San Francisco Housing Market
2023 Annual San Francisco Housing Market2023 Annual San Francisco Housing Market
2023 Annual San Francisco Housing Market
 
October 2023 Report: San Francisco Real Estate Market Insights
October 2023 Report: San Francisco Real Estate Market InsightsOctober 2023 Report: San Francisco Real Estate Market Insights
October 2023 Report: San Francisco Real Estate Market Insights
 
CA Weekly MLS Market Data Report - August 2023
CA Weekly MLS Market Data Report - August 2023CA Weekly MLS Market Data Report - August 2023
CA Weekly MLS Market Data Report - August 2023
 
San Francisco Market Report July 2023.pdf
San Francisco Market Report July 2023.pdfSan Francisco Market Report July 2023.pdf
San Francisco Market Report July 2023.pdf
 
San Francisco May 2023 Market Report.pdf
San Francisco May 2023 Market Report.pdfSan Francisco May 2023 Market Report.pdf
San Francisco May 2023 Market Report.pdf
 
San Francisco June 2023 Market Report.pdf
San Francisco June 2023 Market Report.pdfSan Francisco June 2023 Market Report.pdf
San Francisco June 2023 Market Report.pdf
 
San Francisco Market Report March 2023.pdf
San Francisco Market Report March 2023.pdfSan Francisco Market Report March 2023.pdf
San Francisco Market Report March 2023.pdf
 
San Francisco Market Report February 2023
San Francisco Market Report February 2023San Francisco Market Report February 2023
San Francisco Market Report February 2023
 
San Francisco Market Report January 2023.pdf
San Francisco Market Report January 2023.pdfSan Francisco Market Report January 2023.pdf
San Francisco Market Report January 2023.pdf
 
Annual Report on the San Francisco County Housing Market.pdf
Annual Report on the San Francisco County Housing Market.pdfAnnual Report on the San Francisco County Housing Market.pdf
Annual Report on the San Francisco County Housing Market.pdf
 
San Francisco Market Report December 2022.pdf
San Francisco Market Report December 2022.pdfSan Francisco Market Report December 2022.pdf
San Francisco Market Report December 2022.pdf
 
San Francisco Market Report November 2022.pdf
San Francisco Market Report November 2022.pdfSan Francisco Market Report November 2022.pdf
San Francisco Market Report November 2022.pdf
 
San Francisco Market Report October 2022.pdf
San Francisco Market Report October 2022.pdfSan Francisco Market Report October 2022.pdf
San Francisco Market Report October 2022.pdf
 
San Francisco Market Report September 2022.pdf
San Francisco Market Report September 2022.pdfSan Francisco Market Report September 2022.pdf
San Francisco Market Report September 2022.pdf
 
San Francisco Market Report August 2022.pdf
San Francisco Market Report August 2022.pdfSan Francisco Market Report August 2022.pdf
San Francisco Market Report August 2022.pdf
 
San Francisco Market Report July 2022.pdf
San Francisco Market Report July 2022.pdfSan Francisco Market Report July 2022.pdf
San Francisco Market Report July 2022.pdf
 
San Francisco Market Report June 2022.pdf
San Francisco Market Report June 2022.pdfSan Francisco Market Report June 2022.pdf
San Francisco Market Report June 2022.pdf
 

Dernier

Dynamic Netsoft A leader In Property management Software
Dynamic Netsoft A leader In Property management SoftwareDynamic Netsoft A leader In Property management Software
Dynamic Netsoft A leader In Property management SoftwareDynamic Netsoft
 
The Role of Mortgage Brokers in Retirement Housing: Key Considerations
The Role of Mortgage Brokers in Retirement Housing: Key ConsiderationsThe Role of Mortgage Brokers in Retirement Housing: Key Considerations
The Role of Mortgage Brokers in Retirement Housing: Key Considerationssunlite Mortgage
 
Rustomjee The Panorama At Pali Hill, Bandra West, Mumbai - Brochure.pdf
Rustomjee The Panorama At Pali Hill, Bandra West, Mumbai - Brochure.pdfRustomjee The Panorama At Pali Hill, Bandra West, Mumbai - Brochure.pdf
Rustomjee The Panorama At Pali Hill, Bandra West, Mumbai - Brochure.pdfmonikasharma630
 
Brigade Neopolis Kokapet, Hyderabad E- Brochure
Brigade Neopolis Kokapet, Hyderabad E- BrochureBrigade Neopolis Kokapet, Hyderabad E- Brochure
Brigade Neopolis Kokapet, Hyderabad E- Brochurefaheemali990101
 
Managed Farmland Brochures to get more in
Managed Farmland Brochures to get more inManaged Farmland Brochures to get more in
Managed Farmland Brochures to get more inknoxdigital1
 
Kolte Patil Universe Hinjewadi Pune Brochure.pdf
Kolte Patil Universe Hinjewadi Pune Brochure.pdfKolte Patil Universe Hinjewadi Pune Brochure.pdf
Kolte Patil Universe Hinjewadi Pune Brochure.pdfPrachiRudram
 
Ajmera Prive at Juhu, Mumbai E-Brochure.pdf
Ajmera Prive at Juhu, Mumbai  E-Brochure.pdfAjmera Prive at Juhu, Mumbai  E-Brochure.pdf
Ajmera Prive at Juhu, Mumbai E-Brochure.pdfManishSaxena95
 
Ebullient Investments Limited specializes in Building contractor
Ebullient Investments Limited specializes in Building contractorEbullient Investments Limited specializes in Building contractor
Ebullient Investments Limited specializes in Building contractorEbullient Investments Limited
 
8 Key Elements for Comfortable Farmland Living
8 Key Elements for Comfortable Farmland Living 8 Key Elements for Comfortable Farmland Living
8 Key Elements for Comfortable Farmland Living Farmland Bazaar
 
Anandtara Iris Residences Mundhwa Pune Brochure.pdf
Anandtara Iris Residences Mundhwa Pune Brochure.pdfAnandtara Iris Residences Mundhwa Pune Brochure.pdf
Anandtara Iris Residences Mundhwa Pune Brochure.pdfabbu831446
 
Prestige Rainbow Waters Raidurgam, Gachibowli Hyderabad E- Brochure.pdf
Prestige Rainbow Waters Raidurgam, Gachibowli Hyderabad E- Brochure.pdfPrestige Rainbow Waters Raidurgam, Gachibowli Hyderabad E- Brochure.pdf
Prestige Rainbow Waters Raidurgam, Gachibowli Hyderabad E- Brochure.pdffaheemali990101
 
Call Girls In Peeragarhi, Delhi↫8447779280↬Call Girls in Peeragarhi Delhi NCR
Call Girls In Peeragarhi, Delhi↫8447779280↬Call Girls in Peeragarhi Delhi NCRCall Girls In Peeragarhi, Delhi↫8447779280↬Call Girls in Peeragarhi Delhi NCR
Call Girls In Peeragarhi, Delhi↫8447779280↬Call Girls in Peeragarhi Delhi NCRasmaqueen5
 
Ryan Mahoney - How Property Technology Is Altering the Real Estate Market
Ryan Mahoney - How Property Technology Is Altering the Real Estate MarketRyan Mahoney - How Property Technology Is Altering the Real Estate Market
Ryan Mahoney - How Property Technology Is Altering the Real Estate MarketRyan Mahoney
 
MADHUGIRI FARM LAND BROCHURES (11)_compressed (1).pdf
MADHUGIRI FARM LAND BROCHURES (11)_compressed (1).pdfMADHUGIRI FARM LAND BROCHURES (11)_compressed (1).pdf
MADHUGIRI FARM LAND BROCHURES (11)_compressed (1).pdfknoxdigital1
 
Prestige Sector 94 at Noida E Brochure.pdf
Prestige Sector 94 at Noida E Brochure.pdfPrestige Sector 94 at Noida E Brochure.pdf
Prestige Sector 94 at Noida E Brochure.pdfsarak0han45400
 
DLF Plots Sriperumbudur in Chennai E Brochure Pdf
DLF Plots Sriperumbudur in Chennai E Brochure PdfDLF Plots Sriperumbudur in Chennai E Brochure Pdf
DLF Plots Sriperumbudur in Chennai E Brochure Pdfashiyadav24
 
LCAR Unit 22 - Leasing and Property Management - 14th Edition Revised.pptx
LCAR Unit 22 - Leasing and Property Management - 14th Edition Revised.pptxLCAR Unit 22 - Leasing and Property Management - 14th Edition Revised.pptx
LCAR Unit 22 - Leasing and Property Management - 14th Edition Revised.pptxTom Blefko
 
Everything you ever Wanted to Know about Florida Property Tax Exemptions.pdf
Everything you ever Wanted to Know about Florida Property Tax Exemptions.pdfEverything you ever Wanted to Know about Florida Property Tax Exemptions.pdf
Everything you ever Wanted to Know about Florida Property Tax Exemptions.pdfTim Wilmath
 
How to Navigate the Eviction Process in Pennsylvania: A Landlord's Guide
How to Navigate the Eviction Process in Pennsylvania: A Landlord's GuideHow to Navigate the Eviction Process in Pennsylvania: A Landlord's Guide
How to Navigate the Eviction Process in Pennsylvania: A Landlord's GuideezLandlordForms
 

Dernier (20)

Dynamic Netsoft A leader In Property management Software
Dynamic Netsoft A leader In Property management SoftwareDynamic Netsoft A leader In Property management Software
Dynamic Netsoft A leader In Property management Software
 
9953056974 Low Rate Call Girls In Saket, Delhi NCR
9953056974 Low Rate Call Girls In Saket, Delhi NCR9953056974 Low Rate Call Girls In Saket, Delhi NCR
9953056974 Low Rate Call Girls In Saket, Delhi NCR
 
The Role of Mortgage Brokers in Retirement Housing: Key Considerations
The Role of Mortgage Brokers in Retirement Housing: Key ConsiderationsThe Role of Mortgage Brokers in Retirement Housing: Key Considerations
The Role of Mortgage Brokers in Retirement Housing: Key Considerations
 
Rustomjee The Panorama At Pali Hill, Bandra West, Mumbai - Brochure.pdf
Rustomjee The Panorama At Pali Hill, Bandra West, Mumbai - Brochure.pdfRustomjee The Panorama At Pali Hill, Bandra West, Mumbai - Brochure.pdf
Rustomjee The Panorama At Pali Hill, Bandra West, Mumbai - Brochure.pdf
 
Brigade Neopolis Kokapet, Hyderabad E- Brochure
Brigade Neopolis Kokapet, Hyderabad E- BrochureBrigade Neopolis Kokapet, Hyderabad E- Brochure
Brigade Neopolis Kokapet, Hyderabad E- Brochure
 
Managed Farmland Brochures to get more in
Managed Farmland Brochures to get more inManaged Farmland Brochures to get more in
Managed Farmland Brochures to get more in
 
Kolte Patil Universe Hinjewadi Pune Brochure.pdf
Kolte Patil Universe Hinjewadi Pune Brochure.pdfKolte Patil Universe Hinjewadi Pune Brochure.pdf
Kolte Patil Universe Hinjewadi Pune Brochure.pdf
 
Ajmera Prive at Juhu, Mumbai E-Brochure.pdf
Ajmera Prive at Juhu, Mumbai  E-Brochure.pdfAjmera Prive at Juhu, Mumbai  E-Brochure.pdf
Ajmera Prive at Juhu, Mumbai E-Brochure.pdf
 
Ebullient Investments Limited specializes in Building contractor
Ebullient Investments Limited specializes in Building contractorEbullient Investments Limited specializes in Building contractor
Ebullient Investments Limited specializes in Building contractor
 
8 Key Elements for Comfortable Farmland Living
8 Key Elements for Comfortable Farmland Living 8 Key Elements for Comfortable Farmland Living
8 Key Elements for Comfortable Farmland Living
 
Anandtara Iris Residences Mundhwa Pune Brochure.pdf
Anandtara Iris Residences Mundhwa Pune Brochure.pdfAnandtara Iris Residences Mundhwa Pune Brochure.pdf
Anandtara Iris Residences Mundhwa Pune Brochure.pdf
 
Prestige Rainbow Waters Raidurgam, Gachibowli Hyderabad E- Brochure.pdf
Prestige Rainbow Waters Raidurgam, Gachibowli Hyderabad E- Brochure.pdfPrestige Rainbow Waters Raidurgam, Gachibowli Hyderabad E- Brochure.pdf
Prestige Rainbow Waters Raidurgam, Gachibowli Hyderabad E- Brochure.pdf
 
Call Girls In Peeragarhi, Delhi↫8447779280↬Call Girls in Peeragarhi Delhi NCR
Call Girls In Peeragarhi, Delhi↫8447779280↬Call Girls in Peeragarhi Delhi NCRCall Girls In Peeragarhi, Delhi↫8447779280↬Call Girls in Peeragarhi Delhi NCR
Call Girls In Peeragarhi, Delhi↫8447779280↬Call Girls in Peeragarhi Delhi NCR
 
Ryan Mahoney - How Property Technology Is Altering the Real Estate Market
Ryan Mahoney - How Property Technology Is Altering the Real Estate MarketRyan Mahoney - How Property Technology Is Altering the Real Estate Market
Ryan Mahoney - How Property Technology Is Altering the Real Estate Market
 
MADHUGIRI FARM LAND BROCHURES (11)_compressed (1).pdf
MADHUGIRI FARM LAND BROCHURES (11)_compressed (1).pdfMADHUGIRI FARM LAND BROCHURES (11)_compressed (1).pdf
MADHUGIRI FARM LAND BROCHURES (11)_compressed (1).pdf
 
Prestige Sector 94 at Noida E Brochure.pdf
Prestige Sector 94 at Noida E Brochure.pdfPrestige Sector 94 at Noida E Brochure.pdf
Prestige Sector 94 at Noida E Brochure.pdf
 
DLF Plots Sriperumbudur in Chennai E Brochure Pdf
DLF Plots Sriperumbudur in Chennai E Brochure PdfDLF Plots Sriperumbudur in Chennai E Brochure Pdf
DLF Plots Sriperumbudur in Chennai E Brochure Pdf
 
LCAR Unit 22 - Leasing and Property Management - 14th Edition Revised.pptx
LCAR Unit 22 - Leasing and Property Management - 14th Edition Revised.pptxLCAR Unit 22 - Leasing and Property Management - 14th Edition Revised.pptx
LCAR Unit 22 - Leasing and Property Management - 14th Edition Revised.pptx
 
Everything you ever Wanted to Know about Florida Property Tax Exemptions.pdf
Everything you ever Wanted to Know about Florida Property Tax Exemptions.pdfEverything you ever Wanted to Know about Florida Property Tax Exemptions.pdf
Everything you ever Wanted to Know about Florida Property Tax Exemptions.pdf
 
How to Navigate the Eviction Process in Pennsylvania: A Landlord's Guide
How to Navigate the Eviction Process in Pennsylvania: A Landlord's GuideHow to Navigate the Eviction Process in Pennsylvania: A Landlord's Guide
How to Navigate the Eviction Process in Pennsylvania: A Landlord's Guide
 

San francisco residential apr 2011 apr 2013

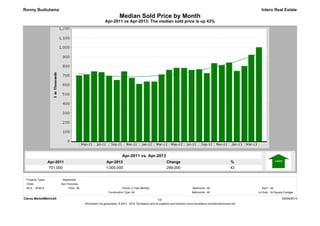
  • 1. Apr-2013 1,000,000 Apr-2011 701,000 % 43 Change 299,000 Apr-2011 vs Apr-2013: The median sold price is up 43% Median Sold Price by Month Intero Real Estate Apr-2011 vs. Apr-2013 Ronny Budiutama Clarus MarketMetrics® 05/04/2013 Information not guaranteed. © 2013 - 2014 Terradatum and its suppliers and licensors (www.terradatum.com/about/licensors.td). 1/2 MLS: SFMLS Bedrooms: All All Construction Type: All2 Year Monthly SqFt: Bathrooms: Lot Size:All All Square Footage Period:All Cities: Property Types: : Residential San Francisco Price:
  • 2. Median Sold Price by Month Apr-2011 vs Apr-2013: The median sold price is up 43% Intero Real EstateRonny Budiutama Sold Median Price Units Avg DOMTime Period Apr-13 1,000,000 205 32 Mar-13 920,000 205 38 Feb-13 800,500 130 40 Jan-13 748,000 161 47 Dec-12 837,500 207 58 Nov-12 810,000 270 42 Oct-12 830,000 256 45 Sep-12 725,000 179 46 Aug-12 766,500 240 50 Jul-12 759,000 216 47 Jun-12 780,000 268 59 May-12 781,000 237 47 Apr-12 760,000 221 54 Mar-12 711,500 223 65 Feb-12 635,000 182 63 Jan-12 635,000 130 81 Dec-11 610,000 231 63 Nov-11 675,000 233 57 Oct-11 743,000 201 54 Sep-11 652,325 211 65 Aug-11 696,060 210 65 Jul-11 735,000 205 62 Jun-11 743,450 265 59 May-11 709,500 222 63 Apr-11 701,000 197 67 Clarus MarketMetrics® 05/04/2013 Information not guaranteed. © 2013 - 2014 Terradatum and its suppliers and licensors (www.terradatum.com/about/licensors.td). 22/
  • 3. Apr-2011 vs Apr-2013: The median price of for sale properties is up 27% and the median price of sold properties is up 43% Intero Real Estate Apr-2011 vs. Apr-2013 699,000 27 Ronny Budiutama 887,500 Apr-2013 Median For Sale vs Median Sold ChangeApr-2011 % 188,500 Apr-2011 Apr-2013 % 701,000 43 Apr-2011 vs. Apr-2013 1,000,000 Change 299,000 Clarus MarketMetrics® 05/04/2013 Information not guaranteed. © 2013 - 2014 Terradatum and its suppliers and licensors (www.terradatum.com/about/licensors.td). 1/2 MLS: SFMLS Bedrooms: All All Construction Type: All2 Year Monthly SqFt: Bathrooms: Lot Size:All All Square Footage Period:All Cities: Property Types: : Residential San Francisco Price:
  • 4. Median For Sale vs Median Sold Apr-2011 vs Apr-2013: The median price of for sale properties is up 27% and the median price of sold properties is up 43% Intero Real EstateRonny Budiutama For SaleMedian SoldMedian For Sale # Properties # PropertiesSold Price Difference Time Period Apr-13 538 205887,500 1,000,000 112,500 Mar-13 521 205899,000 920,000 21,000 Feb-13 462 130850,000 800,500 -49,500 Jan-13 431 161808,000 748,000 -60,000 Dec-12 422 207837,000 837,500 500 Nov-12 563 270845,000 810,000 -35,000 Oct-12 726 256828,000 830,000 2,000 Sep-12 694 179850,000 725,000 -125,000 Aug-12 616 240799,000 766,500 -32,500 Jul-12 645 216789,000 759,000 -30,000 Jun-12 650 268799,000 780,000 -19,000 May-12 718 237750,000 781,000 31,000 Apr-12 712 221699,400 760,000 60,600 Mar-12 740 223699,000 711,500 12,500 Feb-12 694 182699,000 635,000 -64,000 Jan-12 639 130649,950 635,000 -14,950 Dec-11 641 231659,000 610,000 -49,000 Nov-11 834 233678,500 675,000 -3,500 Oct-11 1,014 201668,250 743,000 74,750 Sep-11 1,057 211675,000 652,325 -22,675 Aug-11 971 210650,000 696,060 46,060 Jul-11 1,001 205659,000 735,000 76,000 Jun-11 976 265678,000 743,450 65,450 May-11 914 222689,000 709,500 20,500 Apr-11 924 197699,000 701,000 2,000 Clarus MarketMetrics® Information not guaranteed. © 2013 - 2014 Terradatum and its suppliers and licensors (www.terradatum.com/about/licensors.td). 05/04/201322/
  • 5. Apr-2013 205 Apr-2011 197 % 4 Change 8 Apr-2011 vs Apr-2013: The number of Sold properties is up 4% Sold Properties by Month Intero Real Estate Apr-2011 vs. Apr-2013 Ronny Budiutama Clarus MarketMetrics® 05/04/2013 Information not guaranteed. © 2013 - 2014 Terradatum and its suppliers and licensors (www.terradatum.com/about/licensors.td). 1/2 MLS: SFMLS Bedrooms: All All Construction Type: All2 Year Monthly SqFt: Bathrooms: Lot Size:All All Square Footage Period:All Cities: Property Types: : Residential San Francisco Price:
  • 6. Sold Properties by Month Apr-2011 vs Apr-2013: The number of Sold properties is up 4% Intero Real EstateRonny Budiutama Time Period Full Market Units Median Price Avg DOM Bank Properties Units % Bank Median Price Non-Bank Properties Units % Non-Bank Median Price Apr-13 1,000,000205 32 16 7.8 580,500 189 92.2 1,050,000 Mar-13 920,000205 38 18 8.8 547,500 187 91.2 955,000 Feb-13 800,500130 40 20 15.4 508,500 110 84.6 876,000 Jan-13 748,000161 47 23 14.3 500,000 138 85.7 786,500 Dec-12 837,500207 58 25 12.1 488,000 182 87.9 909,000 Nov-12 810,000270 42 27 10.0 495,000 243 90.0 855,000 Oct-12 830,000256 45 27 10.5 495,000 229 89.5 912,000 Sep-12 725,000179 46 30 16.8 467,500 149 83.2 772,000 Aug-12 766,500240 50 32 13.3 485,000 208 86.7 810,750 Jul-12 759,000216 47 43 19.9 385,000 173 80.1 890,000 Jun-12 780,000268 59 55 20.5 500,000 213 79.5 840,000 May-12 781,000237 47 31 13.1 480,000 206 86.9 834,500 Apr-12 760,000221 54 38 17.2 437,000 183 82.8 801,000 Mar-12 711,500223 65 52 23.3 465,000 171 76.7 780,000 Feb-12 635,000182 63 41 22.5 460,000 141 77.5 700,000 Jan-12 635,000130 81 41 31.5 488,000 89 68.5 730,000 Dec-11 610,000231 63 47 20.3 471,000 184 79.7 685,500 Nov-11 675,000233 57 36 15.5 432,500 197 84.5 749,000 Oct-11 743,000201 54 34 16.9 458,500 167 83.1 792,000 Sep-11 652,325211 65 49 23.2 450,000 162 76.8 732,000 Aug-11 696,060210 65 45 21.4 430,000 165 78.6 750,000 Jul-11 735,000205 62 36 17.6 453,000 169 82.4 825,000 Jun-11 743,450265 59 44 16.6 459,500 221 83.4 765,000 May-11 709,500222 63 48 21.6 451,000 174 78.4 757,500 Apr-11 701,000197 67 42 21.3 434,000 155 78.7 825,000 Clarus MarketMetrics® 05/04/2013 Information not guaranteed. © 2013 - 2014 Terradatum and its suppliers and licensors (www.terradatum.com/about/licensors.td). 22/
  • 7. Apr-2013 248 Apr-2011 213 % 16 Change 35 Apr-2011 vs Apr-2013: The number of Under Contract properties is up 16% Under Contract Properties by Month Intero Real Estate Apr-2011 vs. Apr-2013 Ronny Budiutama Clarus MarketMetrics® 05/04/2013 Information not guaranteed. © 2013 - 2014 Terradatum and its suppliers and licensors (www.terradatum.com/about/licensors.td). 1/2 AllBathrooms: SqFt: All : Residential All Square FootageConstruction Type: Lot Size:SFMLS San Francisco Period: 2 Year Monthly Price: MLS: All AllAll Property Types: Bedrooms: Cities:
  • 8. Under Contract Properties by Month Apr-2011 vs Apr-2013: The number of Under Contract properties is up 16% Intero Real EstateRonny Budiutama Median Price UnitsUnits Median Price% Non-Bank Full Market % BankAvg DOMMedian Price Bank Properties Units Non-Bank Properties Time Period Apr-13 898,500248 26 925,00094.0233529,9006.015 Mar-13 849,000227 29 899,00093.4212500,0006.615 Feb-13 799,000171 35 875,00087.1149526,50012.922 Jan-13 779,000147 41 799,00087.8129552,75012.218 Dec-12 699,000146 48 764,90080.1117559,90019.929 Nov-12 767,000210 58 799,00087.1183469,90012.927 Oct-12 799,000293 38 809,00091.1267469,9258.926 Sep-12 799,000226 43 849,00088.5200454,50011.526 Aug-12 699,000198 37 749,00089.4177410,00010.621 Jul-12 729,000235 46 779,00086.4203494,45013.632 Jun-12 699,000203 46 799,00084.2171399,49915.832 May-12 738,000277 55 799,00081.2225446,25018.852 Apr-12 719,000220 50 799,00083.2183499,00016.837 Mar-12 722,450254 52 799,00080.7205425,00019.349 Feb-12 704,231214 65 775,00076.2163450,00023.851 Jan-12 649,000166 67 780,00072.9121420,00027.145 Dec-11 604,500134 76 677,00077.6104494,45022.430 Nov-11 614,000216 71 699,00076.4165429,00023.651 Oct-11 665,000247 66 775,00076.5189468,90023.558 Sep-11 700,000219 61 787,00084.9186488,00015.133 Aug-11 679,000213 61 731,50078.9168444,90021.145 Jul-11 649,888223 57 725,00078.5175434,77721.548 Jun-11 699,000221 64 762,00080.5178429,90019.543 May-11 725,000239 57 798,00083.7200449,00016.339 Apr-11 729,000213 57 793,50083.6178488,00016.435 Clarus MarketMetrics® 05/04/2013 Information not guaranteed. © 2013 - 2014 Terradatum and its suppliers and licensors (www.terradatum.com/about/licensors.td). 22/
  • 9. Apr-2013 268 Apr-2011 293 % -9 Change -25 Apr-2011 vs Apr-2013: The number of New properties is down -9% New Properties by Month Intero Real Estate Apr-2011 vs. Apr-2013 Ronny Budiutama Clarus MarketMetrics® 05/04/2013 Information not guaranteed. © 2013 - 2014 Terradatum and its suppliers and licensors (www.terradatum.com/about/licensors.td). 1/2 MLS: SFMLS Bedrooms: All All Construction Type: All2 Year Monthly SqFt: Bathrooms: Lot Size:All All Square Footage Period:All Cities: Property Types: : Residential San Francisco Price:
  • 10. New Properties by Month Apr-2011 vs Apr-2013: The number of New properties is down -9% Intero Real EstateRonny Budiutama Median Price UnitsUnits Median Price% Non-Bank Full Market % BankMedian Price Bank Properties Units Non-Bank Properties Time Period Apr-13 827,000268 12 4.5 499,950 256 95.5 848,500 Mar-13 899,000250 20 8.0 544,950 230 92.0 930,250 Feb-13 849,000204 12 5.9 671,950 192 94.1 862,500 Jan-13 773,500208 25 12.0 499,900 183 88.0 799,000 Dec-12 699,000102 22 21.6 543,450 80 78.4 749,000 Nov-12 799,000183 24 13.1 577,500 159 86.9 825,000 Oct-12 789,000293 32 10.9 501,700 261 89.1 799,000 Sep-12 850,000322 32 9.9 454,500 290 90.1 942,000 Aug-12 795,000257 27 10.5 449,900 230 89.5 825,000 Jul-12 699,000257 33 12.8 498,000 224 87.2 762,500 Jun-12 829,000261 30 11.5 450,000 231 88.5 874,000 May-12 829,000267 44 16.5 444,000 223 83.5 949,000 Apr-12 722,500268 48 17.9 486,400 220 82.1 804,500 Mar-12 722,450298 50 16.8 433,350 248 83.2 818,500 Feb-12 749,000263 51 19.4 424,900 212 80.6 834,500 Jan-12 675,000251 61 24.3 415,000 190 75.7 788,708 Dec-11 559,900121 47 38.8 474,900 74 61.2 644,000 Nov-11 678,000151 39 25.8 459,999 112 74.2 749,500 Oct-11 678,500260 52 20.0 402,375 208 80.0 727,500 Sep-11 735,000397 74 18.6 462,450 323 81.4 798,000 Aug-11 649,000289 58 20.1 468,900 231 79.9 715,000 Jul-11 692,000330 62 18.8 492,450 268 81.2 738,500 Jun-11 698,000349 78 22.3 430,550 271 77.7 775,000 May-11 699,000279 65 23.3 430,000 214 76.7 761,500 Apr-11 779,000293 43 14.7 475,000 250 85.3 849,499 Clarus MarketMetrics® 05/04/2013 Information not guaranteed. © 2013 - 2014 Terradatum and its suppliers and licensors (www.terradatum.com/about/licensors.td). 22/
  • 11. Apr-2013 538 Apr-2011 924 % -42 Change -386 Apr-2011 vs Apr-2013: The number of For Sale properties is down -42% For Sale Properties by Month Intero Real Estate Apr-2011 vs. Apr-2013 Ronny Budiutama Clarus MarketMetrics® 05/04/2013 Information not guaranteed. © 2013 - 2014 Terradatum and its suppliers and licensors (www.terradatum.com/about/licensors.td). 1/2 MLS: SFMLS Bedrooms: All All Construction Type: All2 Year Monthly SqFt: Bathrooms: Lot Size:All All Square Footage Period:All Cities: Property Types: : Residential San Francisco Price:
  • 12. For Sale Properties by Month Apr-2011 vs Apr-2013: The number of For Sale properties is down -42% Intero Real EstateRonny Budiutama Median Price UnitsUnits Median Price% Non-Bank Full Market % BankAvg DOMMedian Price Bank Properties Units Non-Bank Properties Time Period Apr-13 887,500538 52 40 7.4 579,000 498 92.6 899,500 Mar-13 899,000521 55 45 8.6 574,900 476 91.4 949,999 Feb-13 850,000462 63 52 11.3 539,450 410 88.7 926,500 Jan-13 808,000431 71 63 14.6 500,000 368 85.4 899,000 Dec-12 837,000422 80 73 17.3 525,000 349 82.7 949,000 Nov-12 845,000563 68 81 14.4 510,000 482 85.6 926,500 Oct-12 828,000726 60 93 12.8 495,000 633 87.2 899,000 Sep-12 850,000694 58 94 13.5 459,950 600 86.5 949,000 Aug-12 799,000616 63 92 14.9 450,000 524 85.1 879,000 Jul-12 789,000645 65 109 16.9 479,000 536 83.1 889,500 Jun-12 799,000650 67 122 18.8 450,000 528 81.2 927,000 May-12 750,000718 70 162 22.6 454,750 556 77.4 899,000 Apr-12 699,400712 71 166 23.3 468,944 546 76.7 830,000 Mar-12 699,000740 71 179 24.2 449,900 561 75.8 799,000 Feb-12 699,000694 81 195 28.1 450,000 499 71.9 799,000 Jan-12 649,950639 92 201 31.5 450,000 438 68.5 775,000 Dec-11 659,000641 109 191 29.8 470,000 450 70.2 749,000 Nov-11 678,500834 94 216 25.9 457,000 618 74.1 750,000 Oct-11 668,2501,014 81 259 25.5 455,000 755 74.5 749,000 Sep-11 675,0001,057 75 263 24.9 467,900 794 75.1 759,000 Aug-11 650,000971 80 257 26.5 459,000 714 73.5 749,000 Jul-11 659,0001,001 76 268 26.8 449,900 733 73.2 759,000 Jun-11 678,000976 77 265 27.2 435,000 711 72.8 786,000 May-11 689,000914 77 233 25.5 448,888 681 74.5 799,000 Apr-11 699,000924 74 223 24.1 449,950 701 75.9 799,000 Clarus MarketMetrics® 05/04/2013 Information not guaranteed. © 2013 - 2014 Terradatum and its suppliers and licensors (www.terradatum.com/about/licensors.td). 22/
  • 13. Apr-2013 27 Apr-2011 76 % -64 Change -49 Apr-2011 vs Apr-2013: The number of Expired properties is down -64% Expired Properties by Month Intero Real Estate Apr-2011 vs. Apr-2013 Ronny Budiutama 05/04/2013Clarus MarketMetrics® 1/2 MLS: SFMLS Bedrooms: All All Construction Type: All2 Year Monthly SqFt: Bathrooms: Lot Size:All All Square Footage Period:All Cities: Property Types: : Residential San Francisco Price:
  • 14. Expired Properties by Month Apr-2011 vs Apr-2013: The number of Expired properties is down -64% Intero Real EstateRonny Budiutama Median Price Units% BankAvg DOMUnits Median Price Bank Properties Units Non-Bank Properties % Non-Bank Median Price Full Market Apr-13 815,00027 79 8 29.6 579,000 19 70.4 850,000 Mar-13 749,50024 113 2 8.3 599,950 22 91.7 783,500 Feb-13 728,95020 98 5 25.0 475,000 15 75.0 849,000 Jan-13 724,50026 91 5 19.2 500,000 21 80.8 899,000 Dec-12 1,495,00053 82 6 11.3 449,000 47 88.7 1,750,000 Nov-12 1,200,00033 78 3 9.1 680,000 30 90.9 1,332,000 Oct-12 988,00053 116 10 18.9 513,500 43 81.1 1,239,000 Sep-12 918,00035 71 7 20.0 368,000 28 80.0 999,000 Aug-12 833,50046 85 9 19.6 499,000 37 80.4 1,059,000 Jul-12 1,360,00051 84 12 23.5 474,500 39 76.5 1,699,000 Jun-12 879,00059 72 14 23.7 512,050 45 76.3 1,095,000 May-12 678,50052 69 18 34.6 454,750 34 65.4 898,500 Apr-12 675,00041 81 11 26.8 487,000 30 73.2 789,000 Mar-12 639,47542 87 12 28.6 424,500 30 71.4 764,000 Feb-12 649,50038 122 15 39.5 484,950 23 60.5 949,000 Jan-12 599,45042 120 12 28.6 444,500 30 71.4 799,000 Dec-11 770,000119 113 21 17.6 490,000 98 82.4 849,500 Nov-11 669,00098 96 21 21.4 450,000 77 78.6 764,000 Oct-11 628,75084 101 24 28.6 449,500 60 71.4 723,000 Sep-11 668,50084 104 23 27.4 405,000 61 72.6 738,000 Aug-11 759,50098 92 23 23.5 448,888 75 76.5 799,950 Jul-11 699,47596 92 21 21.9 435,000 75 78.1 786,000 Jun-11 769,00084 109 16 19.0 404,500 68 81.0 849,500 May-11 784,00048 108 7 14.6 434,900 41 85.4 850,000 Apr-11 676,50076 113 20 26.3 425,000 56 73.7 786,500 Clarus MarketMetrics® 05/04/2013 Information not guaranteed. © 2013 - 2014 Terradatum and its suppliers and licensors (www.terradatum.com/about/licensors.td). 22/
  • 15. Apr-2011 vs Apr-2013: The number of for sale properties is down -42% and the number of sold properties is up 4% Intero Real Estate Apr-2011 vs. Apr-2013 924 -42 Ronny Budiutama 538 Apr-2013 Supply & Demand by Month ChangeApr-2011 % -386 Apr-2011 Apr-2013 % 197 4 Apr-2011 vs. Apr-2013 205 Change 8 Clarus MarketMetrics® 05/04/2013 Information not guaranteed. © 2013 - 2014 Terradatum and its suppliers and licensors (www.terradatum.com/about/licensors.td). 1/2 MLS: SFMLS Bedrooms: All All Construction Type: All2 Year Monthly SqFt: Bathrooms: Lot Size:All All Square Footage Period:All Cities: Property Types: : Residential San Francisco Price:
  • 16. Supply & Demand by Month Apr-2011 vs Apr-2013: The number of for sale properties is down -42% and the number of sold properties is up 4% Ronny Budiutama Intero Real Estate For Sale Sold # Properties Avg DOM Avg DOM # Properties Time Period Apr-13 52 32538 205 Mar-13 55 38521 205 Feb-13 63 40462 130 Jan-13 71 47431 161 Dec-12 80 58422 207 Nov-12 68 42563 270 Oct-12 60 45726 256 Sep-12 58 46694 179 Aug-12 63 50616 240 Jul-12 65 47645 216 Jun-12 67 59650 268 May-12 70 47718 237 Apr-12 71 54712 221 Mar-12 71 65740 223 Feb-12 81 63694 182 Jan-12 92 81639 130 Dec-11 109 63641 231 Nov-11 94 57834 233 Oct-11 81 541,014 201 Sep-11 75 651,057 211 Aug-11 80 65971 210 Jul-11 76 621,001 205 Jun-11 77 59976 265 May-11 77 63914 222 Apr-11 74 67924 197 Clarus MarketMetrics® 05/04/2013 Information not guaranteed. © 2013 - 2014 Terradatum and its suppliers and licensors (www.terradatum.com/about/licensors.td). 22/
  • 17. Apr-2013 26 Apr-2011 57 % -55 Change -31 Apr-2011 vs Apr-2013: The average days on market is down -55% The Average Days on Market by Month Intero Real Estate Apr-2011 vs. Apr-2013 Ronny Budiutama San Francisco All 2 Year Monthly Cities: Period:Price: Property Types: : Residential 05/04/20131/2Clarus MarketMetrics® All Square Footage Bedrooms: All AllSqFt: All Lot Size:Bathrooms:AllConstruction Type: MLS: SFMLS
  • 18. The Average Days on Market by Month Apr-2011 vs Apr-2013: The average days on market is down -55% Intero Real EstateRonny Budiutama # UC UnitsAvg DOMTime Period Apr-13 24826 Mar-13 22729 Feb-13 17135 Jan-13 14741 Dec-12 14648 Nov-12 21058 Oct-12 29338 Sep-12 22643 Aug-12 19837 Jul-12 23546 Jun-12 20346 May-12 27755 Apr-12 22050 Mar-12 25452 Feb-12 21465 Jan-12 16667 Dec-11 13476 Nov-11 21671 Oct-11 24766 Sep-11 21961 Aug-11 21361 Jul-11 22357 Jun-11 22164 May-11 23957 Apr-11 21357 Clarus MarketMetrics® 2/2 05/04/2013 Information not guaranteed. © 2013 - 2014 Terradatum and its suppliers and licensors (www.terradatum.com/about/licensors.td).
  • 19. Apr-2011 vs Apr-2013: The average months supply of inventory is down -64% Intero Real Estate Apr-2011 vs. Apr-2013 3 -64 Ronny Budiutama 1.01 Apr-2013 Months Supply of Inventory ChangeApr-2011 % -1.9 Clarus MarketMetrics® 05/04/2013 Information not guaranteed. © 2013 - 2014 Terradatum and its suppliers and licensors (www.terradatum.com/about/licensors.td). 1/2 MLS: SFMLS Bedrooms: All All Construction Type: All2 Year Monthly SqFt: Bathrooms: Lot Size:All All Square Footage Period:All Cities: Property Types: : Residential San Francisco Price:
  • 20. Months Supply of Inventory Apr-2011 vs Apr-2013: The average months supply of inventory is down -64% Ronny Budiutama Intero Real Estate During MonthLast Day of Month MSI # Units For Sale # UC Units UC Avg DOMTime Period Apr-13 248 26263 1.1 Mar-13 227 29270 1.2 Feb-13 171 35271 1.6 Jan-13 147 41258 1.8 Dec-12 146 48223 1.5 Nov-12 210 58320 1.5 Oct-12 293 38380 1.3 Sep-12 226 43433 1.9 Aug-12 198 37372 1.9 Jul-12 235 46359 1.5 Jun-12 203 46388 1.9 May-12 277 55389 1.4 Apr-12 220 50451 2.0 Mar-12 254 52444 1.7 Feb-12 214 65442 2.1 Jan-12 166 67431 2.6 Dec-11 134 76388 2.9 Nov-11 216 71520 2.4 Oct-11 247 66683 2.8 Sep-11 219 61754 3.4 Aug-11 213 61660 3.1 Jul-11 223 57682 3.1 Jun-11 221 64671 3.0 May-11 239 57627 2.6 Apr-11 213 57635 3.0 Clarus MarketMetrics® 05/04/2013 Information not guaranteed. © 2013 - 2014 Terradatum and its suppliers and licensors (www.terradatum.com/about/licensors.td). 22/