Options Trade Cheap Following Q2 Earnings - 2005
•
1 j'aime•464 vues

Actionable trade ideas for stock market investors and traders seeking alpha by overlaying their portfolios with options, other derivatives, ETFs, and disciplined and applied Game Theory for hedge fund managers and other active fund managers worldwide. Ryan Renicker, CFA

Recommandé
Contenu connexe
Tendances
Tendances (15)
Similaire à Options Trade Cheap Following Q2 Earnings - 2005
Similaire à Options Trade Cheap Following Q2 Earnings - 2005 (20)
Plus de RYAN RENICKER
Plus de RYAN RENICKER (20)
Dernier
Dernier (20)
Options Trade Cheap Following Q2 Earnings - 2005
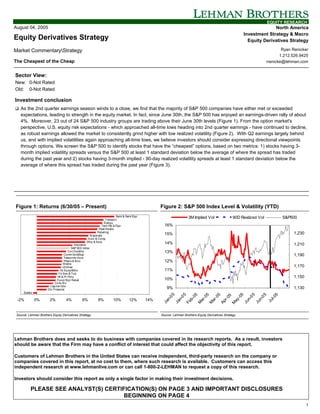
- 1. EQUITY RESEARCH August 04, 2005 North America Investment Strategy & Macro Equity Derivatives Strategy Equity Derivatives Strategy Market CommentaryStrategy Ryan Renicker 1.212.526.9425 The Cheapest of the Cheap rrenicke@lehman.com Sector View: New: 0-Not Rated Old: 0-Not Rated Investment conclusion ! As the 2nd quarter earnings season winds to a close, we find that the majority of S&P 500 companies have either met or exceeded expectations, leading to strength in the equity market. In fact, since June 30th, the S&P 500 has enjoyed an earnings-driven rally of about 4%. Moreover, 23 out of 24 S&P 500 industry groups are trading above their June 30th levels (Figure 1). From the option market's perspective, U.S. equity risk expectations - which approached all-time lows heading into 2nd quarter earnings - have continued to decline, as robust earnings allowed the market to consistently grind higher with low realized volatility (Figure 2). With Q2 earnings largely behind us, and with implied volatilities again approaching all-time lows, we believe investors should consider expressing directional viewpoints through options. We screen the S&P 500 to identify stocks that have the “cheapest” options, based on two metrics: 1) stocks having 3- month implied volatility spreads versus the S&P 500 at least 1 standard deviation below the average of where the spread has traded during the past year and 2) stocks having 3-month implied - 90-day realized volatility spreads at least 1 standard deviation below the average of where this spread has traded during the past year (Figure 3). Figure 1: Returns (6/30/05 – Present) Figure 2: S&P 500 Index Level & Volatility (YTD) Semi & Semi Eqp 3M Implied Vol 90D Realized Vol S&P500 Transptn Energy Tech Hw & Eqp 16% Real Estat e Retailing 1,230 M aterials 15% Auto & Comp Sf tw & Svcs Insurance 14% 1,210 S&P 500 Index Con Dur&Ap 13% Comm Svc&Sup 1,190 Telecomm Svcs Pharm & Biot 12% M edia Ut ilities 1,170 Hc Equip&Svc 11% Fd Bev & Tob Hh & Pr Pdts 1,150 Food/Stpl Retail 10% Cons Srv Capit al Gds Div Financial 9% 1,130 Banks 5 5 05 05 05 05 05 5 5 05 -0 l-0 -0 -0 n- n- n- n- b- -2% 0% 2% 4% 6% 8% 10% 12% 14% r- ay ar ar Ju Ja Ja Ju Ju Fe Ap M M M Source: Lehman Brothers Equity Derivatives Strategy. Source: Lehman Brothers Equity Derivatives Strategy. Lehman Brothers does and seeks to do business with companies covered in its research reports. As a result, investors should be aware that the Firm may have a conflict of interest that could affect the objectivity of this report. Customers of Lehman Brothers in the United States can receive independent, third-party research on the company or companies covered in this report, at no cost to them, where such research is available. Customers can access this independent research at www.lehmanlive.com or can call 1-800-2-LEHMAN to request a copy of this research. Investors should consider this report as only a single factor in making their investment decisions. PLEASE SEE ANALYST(S) CERTIFICATION(S) ON PAGE 3 AND IMPORTANT DISCLOSURES BEGINNING ON PAGE 4 1
- 2. EQUITY RESEARCH We screen the S&P 500 Index to identify stocks that we believe have the “cheapest” options. These stocks currently have 1) 3-month implied volatility spreads versus the S&P500 at least 1 standard deviation below the average of where the spread has traded during the past year, and 2) 3-month implied minus 90-day realized volatility spreads at least 1 standard deviation below the average of where this spread has traded during the past year. Figure 3: S&P 500 Stocks Passing Our “Cheapness” Screen Options "Cheap" Versus 90-Day Ticker Name GICS Industry Group Name Last Price S&P500 Realized BSC UN BEAR STEARNS COMPANIES INC DIVERS FINANC $ 103.97 Yes Yes CA UN COMPUTER ASSOCIATES INTL INC SOFTWARE & SERVICES $ 27.56 Yes Yes COF UN CAPITAL ONE FINANCIAL CORP DIVERS FINANC $ 83.15 Yes Yes CTXS UQ CITRIX SYSTEMS INC SOFTWARE & SERVICES $ 23.59 Yes Yes ET UN E*TRADE FINANCIAL CORP DIVERS FINANC $ 15.49 Yes Yes HLT UN HILTON HOTELS CORP HOTELS REST & LEIS $ 24.98 Yes Yes KEY UN KEYCORP BANKS $ 34.06 Yes Yes MXIM UQ MAXIM INTEGRATED PRODUCTS SEMICONDUCTORS & SEMICONDUCTOR $ 45.20 Yes Yes NWL UN NEWELL RUBBERMAID INC CONS DUR & APPAREL $ 25.06 Yes Yes PAYX UQ PAYCHEX INC SOFTWARE & SERVICES $ 34.76 Yes Yes QLGC UQ QLOGIC CORP TECH HARD & EQUIP $ 32.76 Yes Yes RAI UN REYNOLDS AMERICAN INC FOOD BEV & TOBACCO $ 83.52 Yes Yes SFA UN SCIENTIFIC-ATLANTA INC TECH HARD & EQUIP $ 37.23 Yes Yes TER UN TERADYNE INC SEMICONDUCTORS & SEMICONDUCTOR $ 15.25 Yes Yes THC UN TENET HEALTHCARE CORP H CARE EQUIP & SVC $ 12.92 Yes Yes X UN UNITED STATES STEEL CORP MATERIALS $ 42.65 Yes Yes YHOO UQ YAHOO! INC SOFTWARE & SERVICES $ 34.41 Yes Yes Source: Lehman Brothers Equity Derivatives Strategy. We believe investors should consider expressing directional views in these names through options. 2
- 3. EQUITY RESEARCH Options are not suitable for all investors and the risks of option trading should be weighed against the potential rewards. Supporting documents that form the basis of the recommendations are available on request. Please note that the trade ideas within this report in no way relate to the fundamental ratings applied to European stocks by Lehman Brothers' Equity Research. Analyst Certification: I, Ryan Renicker, hereby certify (1) that the views expressed in this research Industry Note accurately reflect my personal views about any or all of the subject securities or issuers referred to in this Industry Note and (2) no part of my compensation was, is or will be directly or indirectly related to the specific recommendations or views expressed in this Industry Note. 3
- 4. EQUITY RESEARCH Important Disclosures: The analysts responsible for preparing this report have received compensation based upon various factors including the Firm’s total revenues, a portion of which is generated by investment banking activities. Guide to Lehman Brothers Equity Research Rating System: Our coverage analysts use a relative rating system in which they rate stocks as 1-Overweight, 2- Equal weight or 3-Underweight (see definitions below) relative to other companies covered by the analyst or a team of analysts that are deemed to be in the same industry sector (the “sector coverage universe”). To see a list of the companies that comprise a particular sector coverage universe, please go to www.lehman.com/disclosures In addition to the stock rating, we provide sector views which rate the outlook for the sector coverage universe as 1-Positive, 2-Neutral or 3-Negative (see definitions below). A rating system using terms such as buy, hold and sell is not the equivalent of our rating system. Investors should carefully read the entire research report including the definitions of all ratings and not infer its contents from ratings alone. Stock Rating 1-Overweight - The stock is expected to outperform the unweighted expected total return of the sector coverage universe over a 12-month investment horizon. 2-Equal weight - The stock is expected to perform in line with the unweighted expected total return of the sector coverage universe over a 12- month investment horizon. 3-Underweight - The stock is expected to underperform the unweighted expected total return of the sector coverage universe over a 12- month investment horizon. RS-Rating Suspended - The rating and target price have been suspended temporarily to comply with applicable regulations and/or firm policies in certain circumstances including when Lehman Brothers is acting in an advisory capacity in a merger or strategic transaction involving the company. Sector View 1-Positive - sector coverage universe fundamentals/valuations are improving. 2-Neutral - sector coverage universe fundamentals/valuations are steady, neither improving nor deteriorating. 3-Negative - sector coverage universe fundamentals/valuations are deteriorating. Stock Ratings From February 2001 to August 5, 2002 (sector view did not exist): This is a guide to expected total return (price performance plus dividend) relative to the total return of the stocks’ local market (i.e. the market where the stock primarily trades) over the next 12 months. 1-Strong Buy - expected to outperform the market by 15 or more percentage points. 2-Buy - expected to outperform the market by 5-15 percentage points. 3-Market Perform - expected to perform in line with the market, plus or minus 5 percentage points. 4-Market Underperform - expected to underperform the market by 5-15 percentage points. 5-Sell - expected to underperform the market by 15 or more percentage points. Distribution of Ratings: Lehman Brothers Global Equity Research has 1734 companies under coverage. 41% have been assigned a 1-Overweight rating which, for purposes of mandatory regulatory disclosures, is classified as Buy rating, 33% of companies with this rating are investment banking clients of the Firm. 42% have been assigned a 2-Equal weight rating which, for purposes of mandatory regulatory disclosures, is classified as Hold rating, 7% of companies with this rating are investment banking clients of the Firm. 17% have been assigned a 3-Underweight rating which, for purposes of mandatory regulatory disclosures, is classified as Sell rating, 85% of companies with this rating are investment banking clients of the Firm. This material has been prepared and/or issued by Lehman Brothers Inc., member SIPC, and/or one of its affiliates (“Lehman Brothers”) and has been approved by Lehman Brothers International (Europe), authorized and regulated by the Financial Services Authority, in connection with its distribution in the European Economic Area. This material is distributed in Japan by Lehman Brothers Japan Inc., and in Hong Kong by Lehman Brothers Asia Limited. This material is distributed in Australia by Lehman Brothers Australia Pty Limited, and in Singapore by Lehman Brothers Inc., Singapore Branch. This material is distributed in Korea by Lehman Brothers International (Europe) Seoul Branch. This document is for information purposes only and it should not be regarded as an offer to sell or as a solicitation of an offer to buy the securities or other instruments mentioned in it. No part of this document may be reproduced in any manner without the written permission of Lehman Brothers. With the exception of disclosures relating to Lehman Brothers, this research report is based on current public information that Lehman Brothers considers reliable, but we make no representation that it is accurate or complete, and it should not be relied on as such. In the case of any disclosure to the effect that Lehman Brothers Inc. or its affiliates beneficially own 1% or more of any class of common equity securities of the subject company, the computation of beneficial ownership of securities is based upon the methodology used to compute ownership under Section 13(d) of the United States' Securities Exchange Act of 1934. In the case of any disclosure to the effect that Lehman Brothers Inc. and/or its affiliates hold a short position of at least 1% of the outstanding share capital of a particular company, such disclosure relates solely to the ordinary share capital of the company. Accordingly, while such calculation represents Lehman Brothers’ holdings net of any long position in the ordinary share capital of the company, such calculation excludes any rights or obligations that Lehman Brothers may otherwise have, or which may accrue in the future, with respect to such ordinary share capital. Similarly such calculation does not include any shares held or owned by Lehman Brothers where such shares are held under a wider agreement or 4
- 5. EQUITY RESEARCH arrangement (be it with a client or a counterparty) concerning the shares of such company (e.g. prime broking and/or stock lending activity). Any such disclosure represents the position of Lehman Brothers as of the last business day of the calendar month preceding the date of this report. This material is provided with the understanding that Lehman Brothers is not acting in a fiduciary capacity. Opinions expressed herein reflect the opinion of Lehman Brothers and are subject to change without notice. The products mentioned in this document may not be eligible for sale in some states or countries, and they may not be suitable for all types of investors. If an investor has any doubts about product suitability, he should consult his Lehman Brothers representative. The value of and the income produced by products may fluctuate, so that an investor may get back less than he invested. Value and income may be adversely affected by exchange rates, interest rates, or other factors. Past performance is not necessarily indicative of future results. If a product is income producing, part of the capital invested may be used to pay that income. © 2005 Lehman Brothers. All rights reserved. Additional information is available on request. Please contact a Lehman Brothers entity in your home jurisdiction. Lehman Brothers policy for managing conflicts of interest in connection with investment research is available at www.lehman.com/researchconflictspolicy. Ratings, earnings per share forecasts and price targets contained in the Firm's equity research reports covering U.S. companies are available at www.lehman.com/disclosures. Complete disclosure information on companies covered by Lehman Brothers Equity Research is available at www.lehman.com/disclosures. 5