SlideShare une entreprise Scribd logo
1  sur  6
Télécharger pour lire hors ligne
TREB Member Inquiries: 
                                                                                                                                                        (416) 443‐8152 
                                                                                                                                                                         
                                                                                                                                                 Media/Public Inquiries: 
 Second Quarter 2012                                                                                                                                    (416) 443‐8158  

Economic Indicators                                                     Better Supplied Rental Market in Q2                                                         Total TorontoMLS
                                         i                              Toronto, July 18, 2012 — Greater Toronto REALTORS® reported 4,771 leased 
Real GDP Growth
                                                                        condominium apartments through the TorontoMLS system in the second 
                                                                                                                                                                   Apartment Rentals1,3
       Q1 2012                                               1.9%      quarter of 2012, representing a three per cent increase over the second 
                                                                        quarter of 2011.  The number of apartments listed for rent in the second 
Toronto Employment Growthi i
                                                                        quarter grew at a faster pace compared to rental transactions – up 15 per cent 
      June 2012      0.2%                                              year‐over‐year. 
Toronto Unemployment Rate                                               “Strong condominium apartment completions over the past year resulted in 
      June 2012      8.6%                                              many investor‐held units being listed for rent in the second quarter.  While 
                                                                        prospective renters did benefit from more choice compared to last year, 
                                                                                                                                                                    4,771         4,629
Inflation (Yr./Yr. CPI Growth)i i                                       market conditions remained tight enough to prompt annual average rent 
        May 2012           1.2%                                        increases above the rate of inflation,” said Toronto Real Estate Board President 
                                                                        (TREB) Ann Hannah. 
Bank of Canada Overnight Ratei i i                                      The average two bedroom apartment rent in the second quarter was $2,088.  
      June 2012         1.0%                                           This represented an increase of four per cent in comparison to the same period 
                                                                        in 2011.                                                                                   Q2 2012       Q2 2011
                          iii
Prime Rate                                                              “There have not been a lot of rental buildings completed over the past few 
      June 2012                                              3.0%      years.  Investor‐held condominium apartments have filled a void for renters 
                                                                        looking for units with modern finishes and amenities located in popular 
Fixed 5‐Year Mortgage Ratei i i                                         neighbourhoods.  With this in mind, it is not surprising that the vacancy rate for 
       June 2012  5.24%                                                condo apartments has been low and average rents have been increasing at a                      TorontoMLS
S o u r c e s: S t a t ist ic s C a n a d a ; B a n k o f C a n a d a   healthy pace,” said Jason Mercer, TREB’s Senior Manager of Market Analysis.             Avg. 2‐Bdrm. Apt. Rent1,3
 Rental Market Summary: Second Quarter 2012
 Apartments1,2,3
                                      All Bedroom Types                       Bachelor           One‐Bedroom          Two‐Bedroom         Three‐Bedroom
                                       Listed   Leased                    Leased Avg. Rent     Leased Avg. Rent     Leased Avg. Rent     Leased Avg. Rent
    Q2 2012                             8,893                  4,771       143      $1,285     2,552     $1,556     1,950     $2,088      126      $2,625
    Q2 2011                             7,710                  4,629       130      $1,246     2,480     $1,514     1,897     $2,016      122      $2,346
    Yr./Yr. % Chg.                      15%                     3%         10%        3%        3%         3%        3%         4%        3%        12%            $2,088        $2,016
 Townhouses1,2,3
                                      All Bedroom Types                       Bachelor           One‐Bedroom          Two‐Bedroom         Three‐Bedroom
                                       Listed   Leased                    Leased Avg. Rent     Leased Avg. Rent     Leased Avg. Rent     Leased Avg. Rent
    Q2 2012                                  804                367         0          ‐         31      $1,416      110      $1,677      226      $1,911
                                                                                                                                                                   Q2 2012       Q2 2011
    Q2 2011                                  604                318         2       $1,225       32      $1,432      103      $1,809      181      $1,814
    Yr./Yr. % Chg.                           33%                15%         ‐          ‐        ‐3%       ‐1%        7%        ‐7%        25%        5%
Toronto Real Estate Board 

SUMMARY OF RENTAL TRANSACTIONS                                                                                                                         Industrial Leasing 
                                                                                                                                             APARTMENTS, SECOND QUARTER 2012
                                                                                                                                                               ALL TREB AREAS
                                        All Apartments                           Bachelor                           One‐Bedroom                     Two‐Bedroom                        Three‐Bedroom
                                             1                  2            2                       3               2                   3            2                     3
                              Total Listed       Total Leased       Leased            Avg. Lease Rate       Leased         Avg. Lease Rate   Leased       Avg. Lease Rate       Leased2       Avg. Lease Rate3
TREB Total                       8,893               4,771           143                    $1,285           2,552             $1,556         1,950           $2,088             126              $2,625
Halton Region                     209                    39           0                       ‐               15               $1,351          23             $1,627               1              $2,800
 Burlington                       32                      3           0                       ‐                1               $1,200           2             $1,583               0                 ‐
 Halton Hills                      0                      0           0                       ‐                0                  ‐             0                ‐                 0                 ‐
 Milton                           21                      6           0                       ‐                3               $1,275           3             $1,583               0                 ‐
 Oakville                         156                    30           0                       ‐               11               $1,385          18             $1,639               1              $2,800
Peel Region                      1,178                   557          4                     $1,088            232              $1,392         301             $1,672              20              $1,887
 Brampton                         88                     42           1                      $900             14               $1,271         26              $1,478               1              $1,650
 Caledon                           0                      0           0                        ‐               0                  ‐            0                 ‐                 0                 ‐
 Mississauga                     1,090                   515          3                     $1,150            218              $1,400         275             $1,690              19              $1,899
City of Toronto                  6,674               3,732           139                    $1,291           2,058             $1,596         1,445           $2,220              90              $2,888

! TURN PAGE FOR CITY OF TORONTO 
TABLES OR CLICK HERE:

York Region                       782                    414          0                       ‐               236              $1,396         165             $1,820              13              $2,103
 Aurora                            7                      5           0                       ‐                0                  ‐            5              $1,660               0                 ‐
 E. Gwillimbury                    0                      0           0                       ‐                0                  ‐            0                 ‐                 0                 ‐
 Georgina                          1                      0           0                       ‐                0                  ‐            0                 ‐                 0                 ‐
 King                              0                      0           0                       ‐                0                  ‐            0                 ‐                 0                 ‐
 Markham                          339                    177          0                       ‐               98               $1,370         74              $1,807               5              $1,786
 Newmarket                         4                      2           0                       ‐                1               $1,550          1              $1,495               0                 ‐
 Richmond Hill                    144                    85           0                       ‐               48               $1,385         31              $1,747               6              $2,319
 Vaughan                          287                    145          0                       ‐               89               $1,429         54              $1,900               2              $2,250
 Whitchurch‐Stouffville            0                      0           0                       ‐                0                  ‐            0                 ‐                 0                 ‐
Durham Region                      44                    27           0                       ‐               11               $1,267          14             $1,457               2              $1,475
 Ajax                               2                     1           0                       ‐                0                  ‐             1             $1,450               0                 ‐
 Brock                              0                     0           0                       ‐                0                  ‐             0                ‐                 0                 ‐
 Clarington                         6                     6           0                       ‐                3               $1,063           3             $1,250               0                 ‐
 Oshawa                             2                     0           0                       ‐                0                  ‐             0                ‐                 0                 ‐
 Pickering                         33                    19           0                       ‐                8               $1,344           9             $1,550               2              $1,475
 Scugog                             0                     0           0                       ‐                0                  ‐             0                ‐                 0                 ‐
 Uxbridge                           0                     0           0                       ‐                0                  ‐             0                ‐                 0                 ‐
 Whitby                             1                     1           0                       ‐                0                  ‐             1             $1,250               0                 ‐
Dufferin County                    4                     2            0                       ‐                0                  ‐            2              $1,675               0                   ‐
 Orangeville                       4                     2            0                       ‐                0                  ‐            2              $1,675               0                   ‐
Simcoe County                      2                     0            0                       ‐                0                  ‐            0                  ‐                0                   ‐
  Adjala‐Tosorontio                0                     0            0                       ‐                0                  ‐            0                  ‐                0                   ‐
  Bradford West Gwillimbury        2                     0            0                       ‐                0                  ‐            0                  ‐                0                   ‐
  Essa                             0                     0            0                       ‐                0                  ‐            0                  ‐                0                   ‐
  Innisfil                         0                     0            0                       ‐                0                  ‐            0                  ‐                0                   ‐
  New Tecumseth                    0                     0            0                       ‐                0                  ‐            0                  ‐                0                   ‐

                                                                                                         Page 3 
                                                                                                                         Rental Market Report, Second Quarter 2012                                         2 
Toronto Real Estate Board 

SUMMARY OF RENTAL TRANSACTIONS                                                                                                                         Industrial Leasing 
                                                                                                                                           APARTMENTS, SECOND QUARTER 2012
                                                                                                                                       CITY OF TORONTO MUNICIPAL BREAKDOWN
                                  All Apartments                           Bachelor                           One‐Bedroom                        Two‐Bedroom                        Three‐Bedroom
                                       1                  2            2                       3               2                   3               2                     3
                        Total Listed       Total Leased       Leased            Avg. Lease Rate       Leased         Avg. Lease Rate      Leased       Avg. Lease Rate       Leased2       Avg. Lease Rate3
TREB Total                 8,893               4,771           143                    $1,285           2,552             $1,556            1,950           $2,088             126              $2,625
City of Toronto Total      6,674               3,732           139                    $1,291           2,058             $1,596            1,445           $2,220              90              $2,888
Toronto West                947                    443          4                     $1,200            216              $1,454            209             $1,933              14              $2,182
 Toronto W01                96                     47           0                        ‐              27               $1,500            20              $2,278               0                 ‐
 Toronto W02                 8                      7           0                        ‐               4               $1,536             3              $1,957               0                 ‐
 Toronto W03                21                      3           0                        ‐               2               $1,200             0                 ‐                 1              $1,750
 Toronto W04                15                      7           0                        ‐               2               $1,150             5              $1,341               0                 ‐
 Toronto W05                121                    59           0                        ‐              47               $1,382            11              $1,723               1              $1,425
 Toronto W06                402                    195          4                     $1,200            88               $1,529            99              $2,091               4              $3,575
 Toronto W07                10                      4           0                        ‐               1               $1,550             2              $2,325               1              $2,100
 Toronto W08                172                    79           0                        ‐              36               $1,422            40              $1,815               3              $1,792
 Toronto W09                34                     13           0                        ‐               0                  ‐              12              $1,527               1              $1,400
 Toronto W10                68                     29           0                        ‐               9               $1,167            17              $1,426               3              $1,400
Toronto Central            5,215               3,032           131                    $1,305           1,729             $1,634            1,107           $2,348              65              $3,237
 Toronto C01               2,160               1,350           78                     $1,350            795              $1,739             453            $2,603              24              $4,321
 Toronto C02                214                 105             6                     $1,418            50               $1,939             45             $3,918               4              $5,975
 Toronto C03                15                   5              0                        ‐               2               $1,625              3             $2,397               0                 ‐
 Toronto C04                41                  15              1                     $1,050             4               $1,838              7             $2,486               3              $1,757
 Toronto C06                38                  16              0                        ‐              11               $1,378              5             $1,560               0                 ‐
 Toronto C07                314                 166             0                        ‐              82               $1,432             69             $1,869              15              $2,056
 Toronto C08                547                 363            24                     $1,304            233              $1,654             106            $2,279               0                 ‐
 Toronto C09                60                  32              0                        ‐              15               $1,780             16             $2,475               1              $2,300
 Toronto C10                137                 86              1                      $950             50               $1,736             35             $2,646               0                 ‐
 Toronto C11                18                  10              0                        ‐               4               $1,293              5             $1,570               1              $1,300
 Toronto C12                29                  16              0                        ‐               7               $1,814              9             $2,929               0                 ‐
 Toronto C13                140                 55              0                        ‐              15               $1,298             39             $1,711               1              $1,625
 Toronto C14                940                 469             6                     $1,205            249              $1,469             202            $1,930              12              $2,789
 Toronto C15                562                 344            15                     $1,103            212              $1,415             113            $1,927               4              $1,994
Toronto East                512                    257          4                     $923              113              $1,288            129             $1,588              11              $1,723
 Toronto E01                 6                      4           0                       ‐                3               $1,577             1              $1,725               0                 ‐
 Toronto E02                10                      5           0                       ‐                0                  ‐               5              $2,370               0                 ‐
 Toronto E03                26                     13           3                     $900               3               $1,417             7              $2,321               0                 ‐
 Toronto E04                34                     17           0                       ‐                7               $1,196             8              $1,391               2              $1,275
 Toronto E05                58                     29           0                       ‐               10               $1,406            16              $1,626               3              $1,983
 Toronto E06                 2                      0           0                       ‐                0                  ‐               0                 ‐                 0                 ‐
 Toronto E07                78                     43           0                       ‐               13               $1,259            28              $1,438               2              $1,750
 Toronto E08                15                      3           0                       ‐                1               $1,600             2              $1,400               0                 ‐
 Toronto E09                247                    120          1                     $990              66               $1,286            50              $1,575               3              $1,800
 Toronto E10                 5                      1           0                       ‐                0                  ‐               1              $1,450               0                 ‐
 Toronto E11                31                     22           0                       ‐               10               $1,126            11              $1,327               1              $1,550


                                                                                                   Page 3 
                                                                                                                   Rental Market Report, Second Quarter 2012                                            3 
Toronto Real Estate Board 

SUMMARY OF RENTAL TRANSACTIONS                                                                                                                         Industrial Leasing 
                                                                                                                                            TOWNHOUSES, SECOND QUARTER 2012
                                                                                                                                                              ALL TREB AREAS
                                        All Apartments                           Bachelor                         One‐Bedroom                      Two‐Bedroom                        Three‐Bedroom
                                             1                  2            2                      3               2                   3            2                     3
                              Total Listed       Total Leased       Leased            Avg. Lease Rate      Leased         Avg. Lease Rate   Leased       Avg. Lease Rate       Leased2       Avg. Lease Rate3
TREB Total                        804                    367          0                      ‐               31               $1,416         110             $1,677             226              $1,911
Halton Region                      91                    36           0                      ‐               0                   ‐            7              $1,496              29              $1,902
 Burlington                        18                     5           0                      ‐               0                   ‐            2              $1,325               3              $1,692
 Halton Hills                       2                     1           0                      ‐               0                   ‐            1              $1,220               0                 ‐
 Milton                            19                     6           0                      ‐               0                   ‐            0                 ‐                 6              $1,642
 Oakville                          52                    24           0                      ‐               0                   ‐            4              $1,650              20              $2,012
Peel Region                       271                    137          0                      ‐               12               $1,094          31             $1,495              94              $1,712
 Brampton                         16                      8           0                      ‐                3                $967            0                ‐                 5              $1,610
 Caledon                           0                      0           0                      ‐                0                  ‐             0                ‐                 0                 ‐
 Mississauga                      255                    129          0                      ‐                9               $1,136          31             $1,495              89              $1,718
City of Toronto                   289                    124          0                      ‐               17               $1,664          51             $1,916              56              $2,333

! TURN PAGE FOR CITY OF TORONTO 
TABLES OR CLICK HERE:

York Region                       128                    57           0                      ‐               2                $1,234          14             $1,488              41              $1,868
 Aurora                            2                      2           0                      ‐               0                   ‐             1             $1,400               1              $2,500
 E. Gwillimbury                    0                      0           0                      ‐               0                   ‐             0                ‐                 0                 ‐
 Georgina                          1                      1           0                      ‐               0                   ‐             0                ‐                 1              $2,200
 King                              0                      0           0                      ‐               0                   ‐             0                ‐                 0                 ‐
 Markham                          81                     37           0                      ‐               2                $1,234          11             $1,507              24              $1,838
 Newmarket                         0                      0           0                      ‐               0                   ‐             0                ‐                 0                 ‐
 Richmond Hill                    22                      8           0                      ‐               0                   ‐             2             $1,425               6              $1,727
 Vaughan                          22                      9           0                      ‐               0                   ‐             0                ‐                 9              $1,932
 Whitchurch‐Stouffville            0                      0           0                      ‐               0                   ‐             0                ‐                 0                 ‐
Durham Region                      24                    12           0                      ‐               0                   ‐            6              $1,290               6              $1,425
 Ajax                               4                     1           0                      ‐               0                   ‐            0                 ‐                 1              $1,450
 Brock                              0                     0           0                      ‐               0                   ‐            0                 ‐                 0                 ‐
 Clarington                         6                     2           0                      ‐               0                   ‐            1              $1,500               1              $1,425
 Oshawa                             0                     0           0                      ‐               0                   ‐            0                 ‐                 0                 ‐
 Pickering                          4                     3           0                      ‐               0                   ‐            1              $1,400               2              $1,388
 Scugog                             0                     0           0                      ‐               0                   ‐            0                 ‐                 0                 ‐
 Uxbridge                           0                     0           0                      ‐               0                   ‐            0                 ‐                 0                 ‐
 Whitby                            10                     6           0                      ‐               0                   ‐            4              $1,210               2              $1,450
Dufferin County                    1                     1            0                      ‐               0                   ‐            1              $1,395               0                   ‐
 Orangeville                       1                     1            0                      ‐               0                   ‐            1              $1,395               0                   ‐
Simcoe County                      0                     0            0                      ‐               0                   ‐            0                  ‐                0                   ‐
  Adjala‐Tosorontio                0                     0            0                      ‐               0                   ‐            0                  ‐                0                   ‐
  Bradford West Gwillimbury        0                     0            0                      ‐               0                   ‐            0                  ‐                0                   ‐
  Essa                             0                     0            0                      ‐               0                   ‐            0                  ‐                0                   ‐
  Innisfil                         0                     0            0                      ‐               0                   ‐            0                  ‐                0                   ‐
  New Tecumseth                    0                     0            0                      ‐               0                   ‐            0                  ‐                0                   ‐

                                                                                                        Page 3 
                                                                                                                        Rental Market Report, Second Quarter 2012                                         4 
Toronto Real Estate Board 

SUMMARY OF RENTAL TRANSACTIONS                                                                                                                        Industrial Leasing 
                                                                                                                                         TOWNHOUSES, SECOND QUARTER 2012
                                                                                                                                      CITY OF TORONTO MUNICIPAL BREAKDOWN
                                  All Apartments                           Bachelor                         One‐Bedroom                         Two‐Bedroom                        Three‐Bedroom
                                       1                  2            2                      3               2                   3               2                     3
                        Total Listed       Total Leased       Leased            Avg. Lease Rate      Leased         Avg. Lease Rate      Leased       Avg. Lease Rate       Leased2       Avg. Lease Rate3
TREB Total                  804                    367          0                      ‐               31               $1,416            110             $1,677             226              $1,911
City of Toronto Total       289                    124          0                      ‐               17               $1,664             51             $1,916              56              $2,333
Toronto West                 51                    18           0                      ‐                3               $1,275             9              $1,417               6              $1,775
 Toronto W01                 10                     4           0                      ‐                3               $1,275             0                 ‐                 1              $2,500
 Toronto W02                  4                     2           0                      ‐                0                  ‐               1              $1,850               1              $1,550
 Toronto W03                  2                     0           0                      ‐                0                  ‐               0                 ‐                 0                 ‐
 Toronto W04                  5                     1           0                      ‐                0                  ‐               0                 ‐                 1              $1,400
 Toronto W05                 22                    10           0                      ‐                0                  ‐               8              $1,363               2              $1,675
 Toronto W06                  4                     0           0                      ‐                0                  ‐               0                 ‐                 0                 ‐
 Toronto W07                  0                     0           0                      ‐                0                  ‐               0                 ‐                 0                 ‐
 Toronto W08                  1                     1           0                      ‐                0                  ‐               0                 ‐                 1              $1,850
 Toronto W09                  3                     0           0                      ‐                0                  ‐               0                 ‐                 0                 ‐
 Toronto W10                  0                     0           0                      ‐                0                  ‐               0                 ‐                 0                 ‐
Toronto Central             178                    84           0                      ‐               14               $1,748             36             $2,100              34              $2,735
 Toronto C01                56                     34           0                      ‐                8               $1,959             17             $2,278               9              $3,377
 Toronto C02                 2                      0           0                      ‐                0                  ‐                0                ‐                 0                 ‐
 Toronto C03                 0                      0           0                      ‐                0                  ‐                0                ‐                 0                 ‐
 Toronto C04                 0                      0           0                      ‐                0                  ‐                0                ‐                 0                 ‐
 Toronto C06                 1                      1           0                      ‐                0                  ‐                0                ‐                 1              $1,700
 Toronto C07                14                      5           0                      ‐                0                  ‐                4             $1,739               1              $1,550
 Toronto C08                16                      9           0                      ‐                2               $1,738              2             $1,725               5              $3,397
 Toronto C09                 2                      1           0                      ‐                0                  ‐                1             $3,100               0                 ‐
 Toronto C10                 4                      2           0                      ‐                0                  ‐                2             $1,950               0                 ‐
 Toronto C11                 1                      1           0                      ‐                0                  ‐                1             $1,650               0                 ‐
 Toronto C12                 4                      1           0                      ‐                0                  ‐                0                ‐                 1              $3,200
 Toronto C13                 0                      0           0                      ‐                0                  ‐                0                ‐                 0                 ‐
 Toronto C14                40                     20           0                      ‐                4               $1,330              9             $1,981               7              $2,884
 Toronto C15                38                     10           0                      ‐                0                  ‐                0                ‐                10              $1,899
Toronto East                 60                    22           0                      ‐                0                  ‐               6              $1,563              16              $1,686
 Toronto E01                  6                     1           0                      ‐                0                  ‐               1              $1,600               0                 ‐
 Toronto E02                  6                     2           0                      ‐                0                  ‐               1              $2,000               1              $2,750
 Toronto E03                  0                     0           0                      ‐                0                  ‐               0                 ‐                 0                 ‐
 Toronto E04                 10                     3           0                      ‐                0                  ‐               1              $1,300               2              $1,550
 Toronto E05                 15                     6           0                      ‐                0                  ‐               0                 ‐                 6              $1,583
 Toronto E06                  0                     0           0                      ‐                0                  ‐               0                 ‐                 0                 ‐
 Toronto E07                  7                     4           0                      ‐                0                  ‐               0                 ‐                 4              $1,681
 Toronto E08                  1                     1           0                      ‐                0                  ‐               0                 ‐                 1              $1,600
 Toronto E09                 10                     2           0                      ‐                0                  ‐               2              $1,613               0                 ‐
 Toronto E10                  1                     0           0                      ‐                0                  ‐               0                 ‐                 0                 ‐
 Toronto E11                  4                     3           0                      ‐                0                  ‐               1              $1,250               2              $1,650


                                                                                                  Page 3 
                                                                                                                  Rental Market Report, Second Quarter 2012                                            5 
Toronto Real Estate Board 

            Share of GTA Condo                                                                                                                                     Industrial Leasing 
           Apartments In Rental


                         23.6%
              19.9%


                                    18.4%
   12.8%


                                               12.0%


Halton       Peel Toronto York Durham
Source: CMHC, 2011 Fall Rental Market Survey


           GTA Condo  Apartment 
               Vacancy Rate

                       1.3%


                                  0.8%
                                                       NOTES
                                                       1
                                                        Refers to the total number of rental units that were available during the reporting period.
                                                       2
                                                        Refers to firm lease transactions entered in the TorontoMLS system between the first and last day of the reporting period.
                                                       3
                                                        Refers to the average lease rate for firm lease transactions entered in the TorontoMLS system between the first and last day of the reporting period.
 0.3%
             0.3%                                      4                   
                                                        Statistics Canada, Quarter‐over‐quarter annualized growth rate.
                                                       5                   
                                                        Statistics Canada, Year‐over‐year growth rate.
                                                       6
                                                       Bank of Canada, rates for most recently completed month.
Halton       Peel Toronto York Durham
Source: CMHC, 2011 Fall Rental Market Survey                                                 Page 3 
                                                                                                             Rental Market Report, Second Quarter 2012                                                      6 

Contenu connexe

Tendances

Toronto real estate statistics august 2011
Toronto real estate statistics august 2011Toronto real estate statistics august 2011
Toronto real estate statistics august 2011John Helfrich
 
Greater Boston Real Estate Market Data, September 2012
Greater Boston Real Estate Market Data, September 2012Greater Boston Real Estate Market Data, September 2012
Greater Boston Real Estate Market Data, September 2012Unit Realty Group
 
Residential property market overview 2Q 2012
Residential property market overview 2Q 2012Residential property market overview 2Q 2012
Residential property market overview 2Q 2012Surabhi Arora, MRICS
 
K bank fx & rates strategies views on thailand’s bond market in q3
K bank fx & rates strategies   views on thailand’s bond market in q3K bank fx & rates strategies   views on thailand’s bond market in q3
K bank fx & rates strategies views on thailand’s bond market in q3KBank Fx Dealing Room
 
Kessan 1708682945115077
Kessan 1708682945115077Kessan 1708682945115077
Kessan 1708682945115077yoshikawa0521
 
January 2013's Monthly Indicators report
January 2013's Monthly Indicators reportJanuary 2013's Monthly Indicators report
January 2013's Monthly Indicators reportUnit Realty Group
 
December 2012, European Leveraged Loan Market Analysis
December 2012, European Leveraged Loan Market Analysis December 2012, European Leveraged Loan Market Analysis
December 2012, European Leveraged Loan Market Analysis Leveraged Commentary & Data
 
C&W - MONTREAL INDUSTRIAL MARKETBEAT - Q4 2012
C&W - MONTREAL  INDUSTRIAL  MARKETBEAT - Q4 2012 C&W - MONTREAL  INDUSTRIAL  MARKETBEAT - Q4 2012
C&W - MONTREAL INDUSTRIAL MARKETBEAT - Q4 2012 Guy Masse
 
Metro Boston Monthly Indicators Report, October 2012
Metro Boston Monthly Indicators Report, October 2012 Metro Boston Monthly Indicators Report, October 2012
Metro Boston Monthly Indicators Report, October 2012 Unit Realty Group
 
Japanese investment in vietnam - SY TAN TRAN LONG HAU IP
Japanese investment in vietnam - SY TAN TRAN  LONG HAU IPJapanese investment in vietnam - SY TAN TRAN  LONG HAU IP
Japanese investment in vietnam - SY TAN TRAN LONG HAU IPTrần Tấn Sỹ (Mr. See)
 

Tendances (14)

Toronto real estate statistics august 2011
Toronto real estate statistics august 2011Toronto real estate statistics august 2011
Toronto real estate statistics august 2011
 
Market Watch for January 2013
Market Watch for January 2013Market Watch for January 2013
Market Watch for January 2013
 
Greater Boston Real Estate Market Data, September 2012
Greater Boston Real Estate Market Data, September 2012Greater Boston Real Estate Market Data, September 2012
Greater Boston Real Estate Market Data, September 2012
 
Residential property market overview 2Q 2012
Residential property market overview 2Q 2012Residential property market overview 2Q 2012
Residential property market overview 2Q 2012
 
K bank fx & rates strategies views on thailand’s bond market in q3
K bank fx & rates strategies   views on thailand’s bond market in q3K bank fx & rates strategies   views on thailand’s bond market in q3
K bank fx & rates strategies views on thailand’s bond market in q3
 
Kessan 1708682945115077
Kessan 1708682945115077Kessan 1708682945115077
Kessan 1708682945115077
 
January 2013's Monthly Indicators report
January 2013's Monthly Indicators reportJanuary 2013's Monthly Indicators report
January 2013's Monthly Indicators report
 
December 2012, European Leveraged Loan Market Analysis
December 2012, European Leveraged Loan Market Analysis December 2012, European Leveraged Loan Market Analysis
December 2012, European Leveraged Loan Market Analysis
 
Vietnam Market Overview 3 Q12
Vietnam Market Overview 3 Q12Vietnam Market Overview 3 Q12
Vietnam Market Overview 3 Q12
 
Business environment for 22.05.2012-en
Business environment for 22.05.2012-enBusiness environment for 22.05.2012-en
Business environment for 22.05.2012-en
 
C&W - MONTREAL INDUSTRIAL MARKETBEAT - Q4 2012
C&W - MONTREAL  INDUSTRIAL  MARKETBEAT - Q4 2012 C&W - MONTREAL  INDUSTRIAL  MARKETBEAT - Q4 2012
C&W - MONTREAL INDUSTRIAL MARKETBEAT - Q4 2012
 
Metro Boston Monthly Indicators Report, October 2012
Metro Boston Monthly Indicators Report, October 2012 Metro Boston Monthly Indicators Report, October 2012
Metro Boston Monthly Indicators Report, October 2012
 
Japanese investment in vietnam - SY TAN TRAN LONG HAU IP
Japanese investment in vietnam - SY TAN TRAN  LONG HAU IPJapanese investment in vietnam - SY TAN TRAN  LONG HAU IP
Japanese investment in vietnam - SY TAN TRAN LONG HAU IP
 
Food FDI investment trend
Food FDI investment trendFood FDI investment trend
Food FDI investment trend
 

En vedette

En vedette (14)

Toronto Real Estate Board: June 2010
Toronto Real Estate Board: June 2010 Toronto Real Estate Board: June 2010
Toronto Real Estate Board: June 2010
 
Toronto Area Housing Market Charts January 2012
Toronto Area Housing Market Charts January 2012Toronto Area Housing Market Charts January 2012
Toronto Area Housing Market Charts January 2012
 
Toronto Real Estate Board Housing Market Charts for January_2011
Toronto Real Estate Board Housing Market Charts for January_2011Toronto Real Estate Board Housing Market Charts for January_2011
Toronto Real Estate Board Housing Market Charts for January_2011
 
Toronto Area Housing Market Charts October
Toronto Area Housing Market Charts OctoberToronto Area Housing Market Charts October
Toronto Area Housing Market Charts October
 
Preparing to Engage the International Buyer
Preparing to Engage the International BuyerPreparing to Engage the International Buyer
Preparing to Engage the International Buyer
 
Greater Toronto REALTORS Condo Report for Q2, 2012
Greater Toronto REALTORS Condo Report for Q2, 2012Greater Toronto REALTORS Condo Report for Q2, 2012
Greater Toronto REALTORS Condo Report for Q2, 2012
 
Toronto Area Housing Market Charts, August 2011
Toronto Area Housing Market Charts, August 2011Toronto Area Housing Market Charts, August 2011
Toronto Area Housing Market Charts, August 2011
 
Toronto: Third Quarter Condo Report 2012
Toronto: Third Quarter Condo Report 2012Toronto: Third Quarter Condo Report 2012
Toronto: Third Quarter Condo Report 2012
 
Toronto Real Estate Board: June 2010
Toronto Real Estate Board: June 2010 Toronto Real Estate Board: June 2010
Toronto Real Estate Board: June 2010
 
The Consent Agreement and the Real Estate and Business Brokers Act 2002
The Consent Agreement and the Real Estate and Business Brokers Act 2002The Consent Agreement and the Real Estate and Business Brokers Act 2002
The Consent Agreement and the Real Estate and Business Brokers Act 2002
 
Toronto Real Estate Board Housing Market Charts July 2010
Toronto Real Estate Board Housing Market Charts July 2010Toronto Real Estate Board Housing Market Charts July 2010
Toronto Real Estate Board Housing Market Charts July 2010
 
Toronto Real Estate Board Housing Market Charts
Toronto Real Estate Board Housing Market ChartsToronto Real Estate Board Housing Market Charts
Toronto Real Estate Board Housing Market Charts
 
A Social Media Primer 2010
A Social Media Primer 2010A Social Media Primer 2010
A Social Media Primer 2010
 
Toronto Real Estate Board January Housing Charts 2010
Toronto Real Estate Board January Housing Charts 2010Toronto Real Estate Board January Housing Charts 2010
Toronto Real Estate Board January Housing Charts 2010
 

Similaire à Greater Toronto REALTORS Rental Report for Q2, 2012

Rental Market Report Q4 2012
Rental Market Report Q4 2012Rental Market Report Q4 2012
Rental Market Report Q4 2012Chaba Tamasi
 
TREB Condo Report Q4 2012
TREB Condo Report Q4 2012TREB Condo Report Q4 2012
TREB Condo Report Q4 2012Chaba Tamasi
 
Condo Report OCT 2012
Condo Report OCT 2012Condo Report OCT 2012
Condo Report OCT 2012Chaba Tamasi
 
TREB Market Watch October 2012
TREB Market Watch October 2012TREB Market Watch October 2012
TREB Market Watch October 2012realestatesnatch
 
TREB Market Watch Report November 2012
TREB Market Watch Report November 2012TREB Market Watch Report November 2012
TREB Market Watch Report November 2012realestatesnatch
 
TREB Market Watch May 2012
TREB Market Watch May 2012TREB Market Watch May 2012
TREB Market Watch May 2012realestatesnatch
 
Toronto Real Estate Market Update june 2012
Toronto Real Estate Market Update june 2012Toronto Real Estate Market Update june 2012
Toronto Real Estate Market Update june 2012jefftoleary
 
Toronto real estate statistics july 2011
Toronto real estate statistics july 2011Toronto real estate statistics july 2011
Toronto real estate statistics july 2011John Helfrich
 
Market Watch - January 2013
Market Watch - January 2013Market Watch - January 2013
Market Watch - January 2013Cameron Thornton
 
Toronto Real Estate Board Market Watch Jan 2013
Toronto Real Estate Board Market Watch Jan 2013Toronto Real Estate Board Market Watch Jan 2013
Toronto Real Estate Board Market Watch Jan 2013jefftoleary
 
Market Watch: August 2012
Market Watch: August 2012Market Watch: August 2012
Market Watch: August 2012lauragolbeck
 
Toronto real estate statistics December 2011
Toronto real estate statistics December 2011Toronto real estate statistics December 2011
Toronto real estate statistics December 2011John Helfrich
 
Toronto condo market statistical report Q4 2011
Toronto condo market statistical report Q4 2011Toronto condo market statistical report Q4 2011
Toronto condo market statistical report Q4 2011John Helfrich
 

Similaire à Greater Toronto REALTORS Rental Report for Q2, 2012 (20)

Rental Market Report Q4 2012
Rental Market Report Q4 2012Rental Market Report Q4 2012
Rental Market Report Q4 2012
 
TREB Condo Report Q4 2012
TREB Condo Report Q4 2012TREB Condo Report Q4 2012
TREB Condo Report Q4 2012
 
Condo Report OCT 2012
Condo Report OCT 2012Condo Report OCT 2012
Condo Report OCT 2012
 
Toronto Market Watch for February 2012
Toronto Market Watch for February 2012Toronto Market Watch for February 2012
Toronto Market Watch for February 2012
 
Market Watch March 2012
Market Watch March 2012Market Watch March 2012
Market Watch March 2012
 
TREB Market Watch October 2012
TREB Market Watch October 2012TREB Market Watch October 2012
TREB Market Watch October 2012
 
TREB Market Watch Report November 2012
TREB Market Watch Report November 2012TREB Market Watch Report November 2012
TREB Market Watch Report November 2012
 
Mw1209
Mw1209Mw1209
Mw1209
 
TREB Market Watch May 2012
TREB Market Watch May 2012TREB Market Watch May 2012
TREB Market Watch May 2012
 
Toronto Area REALTORS Releases Market Watch for May 2012
Toronto Area REALTORS Releases Market Watch for May 2012Toronto Area REALTORS Releases Market Watch for May 2012
Toronto Area REALTORS Releases Market Watch for May 2012
 
Toronto Real Estate Market Update june 2012
Toronto Real Estate Market Update june 2012Toronto Real Estate Market Update june 2012
Toronto Real Estate Market Update june 2012
 
Toronto real estate statistics july 2011
Toronto real estate statistics july 2011Toronto real estate statistics july 2011
Toronto real estate statistics july 2011
 
Cw12 q3
Cw12 q3Cw12 q3
Cw12 q3
 
Commercial Real Estate Market Watch for Toronto: September 2012
Commercial Real Estate Market Watch for Toronto: September 2012Commercial Real Estate Market Watch for Toronto: September 2012
Commercial Real Estate Market Watch for Toronto: September 2012
 
Market Watch - January 2013
Market Watch - January 2013Market Watch - January 2013
Market Watch - January 2013
 
Toronto Real Estate Board Market Watch Jan 2013
Toronto Real Estate Board Market Watch Jan 2013Toronto Real Estate Board Market Watch Jan 2013
Toronto Real Estate Board Market Watch Jan 2013
 
Market Watch August 2012
Market Watch August 2012Market Watch August 2012
Market Watch August 2012
 
Market Watch: August 2012
Market Watch: August 2012Market Watch: August 2012
Market Watch: August 2012
 
Toronto real estate statistics December 2011
Toronto real estate statistics December 2011Toronto real estate statistics December 2011
Toronto real estate statistics December 2011
 
Toronto condo market statistical report Q4 2011
Toronto condo market statistical report Q4 2011Toronto condo market statistical report Q4 2011
Toronto condo market statistical report Q4 2011
 

Plus de Richard Silver, Certified International REALTOR®

Plus de Richard Silver, Certified International REALTOR® (20)

The Indian Diaspora in Canada
The Indian Diaspora in CanadaThe Indian Diaspora in Canada
The Indian Diaspora in Canada
 
Canadian Foreign Buyer Mortgage Requirements
Canadian Foreign Buyer Mortgage RequirementsCanadian Foreign Buyer Mortgage Requirements
Canadian Foreign Buyer Mortgage Requirements
 
FIABCI USA International Symposium : Gateway Cities 2017
 FIABCI USA International Symposium : Gateway Cities 2017 FIABCI USA International Symposium : Gateway Cities 2017
FIABCI USA International Symposium : Gateway Cities 2017
 
Torontoism Team at Sotheby's International Realty Canada
Torontoism Team at Sotheby's International Realty CanadaTorontoism Team at Sotheby's International Realty Canada
Torontoism Team at Sotheby's International Realty Canada
 
Emerge Presentation 2016
Emerge Presentation 2016Emerge Presentation 2016
Emerge Presentation 2016
 
Accessing the Asian Market
Accessing the Asian MarketAccessing the Asian Market
Accessing the Asian Market
 
Becoming Paperless for Real Estate:
Becoming Paperless for Real Estate: Becoming Paperless for Real Estate:
Becoming Paperless for Real Estate:
 
Becoming Paperless
Becoming PaperlessBecoming Paperless
Becoming Paperless
 
Asia Trip 2015
Asia Trip 2015 Asia Trip 2015
Asia Trip 2015
 
10 things international buyers should know
10 things international buyers should know10 things international buyers should know
10 things international buyers should know
 
Becoming paperless for Ontario REALTORS
Becoming paperless for Ontario REALTORSBecoming paperless for Ontario REALTORS
Becoming paperless for Ontario REALTORS
 
Gander 2015 Presentation
Gander 2015 PresentationGander 2015 Presentation
Gander 2015 Presentation
 
RETechTalk 2015 Apps.
RETechTalk 2015 Apps.RETechTalk 2015 Apps.
RETechTalk 2015 Apps.
 
Top Tier Trends Across Canada
Top Tier Trends Across CanadaTop Tier Trends Across Canada
Top Tier Trends Across Canada
 
Toronto Housing Market Charts for February 2013
Toronto Housing Market Charts for February 2013Toronto Housing Market Charts for February 2013
Toronto Housing Market Charts for February 2013
 
Toronto Central Community Market Charts for the 4th Quarter 2012
Toronto Central Community Market Charts for the 4th Quarter 2012Toronto Central Community Market Charts for the 4th Quarter 2012
Toronto Central Community Market Charts for the 4th Quarter 2012
 
Casey House Celebrates 25 Years!!
Casey House Celebrates 25 Years!! Casey House Celebrates 25 Years!!
Casey House Celebrates 25 Years!!
 
N. Barry Lyons on the Toronto Condo Market for 2013
N. Barry Lyons on the Toronto Condo Market for 2013N. Barry Lyons on the Toronto Condo Market for 2013
N. Barry Lyons on the Toronto Condo Market for 2013
 
Yorkville Hazelton Heritage Conservation District
Yorkville Hazelton Heritage Conservation DistrictYorkville Hazelton Heritage Conservation District
Yorkville Hazelton Heritage Conservation District
 
Market Watch December 2012
Market Watch December 2012Market Watch December 2012
Market Watch December 2012
 

Dernier

LCAR Unit 22 - Leasing and Property Management - 14th Edition Revised.pptx
LCAR Unit 22 - Leasing and Property Management - 14th Edition Revised.pptxLCAR Unit 22 - Leasing and Property Management - 14th Edition Revised.pptx
LCAR Unit 22 - Leasing and Property Management - 14th Edition Revised.pptxTom Blefko
 
A Brief History of Intangibles in Ad Valorem Taxation.pdf
A Brief History of Intangibles in Ad Valorem Taxation.pdfA Brief History of Intangibles in Ad Valorem Taxation.pdf
A Brief History of Intangibles in Ad Valorem Taxation.pdfTim Wilmath
 
Cashpay_Call Girls In Gaur City Mall Noida ❤️8860477959 Escorts Service In 24...
Cashpay_Call Girls In Gaur City Mall Noida ❤️8860477959 Escorts Service In 24...Cashpay_Call Girls In Gaur City Mall Noida ❤️8860477959 Escorts Service In 24...
Cashpay_Call Girls In Gaur City Mall Noida ❤️8860477959 Escorts Service In 24...lizamodels9
 
Purva Palm Hills Devanahalli, Bangalore E- Brochure.pdf
Purva Palm Hills Devanahalli, Bangalore E- Brochure.pdfPurva Palm Hills Devanahalli, Bangalore E- Brochure.pdf
Purva Palm Hills Devanahalli, Bangalore E- Brochure.pdffaheemali990101
 
Covid 19 and Market Impact during the Pandemic
Covid 19 and Market Impact during the PandemicCovid 19 and Market Impact during the Pandemic
Covid 19 and Market Impact during the PandemicTim Wilmath
 
SSPL The Strand Abodes Kharadi Pune Brochure.pdf
SSPL The Strand Abodes Kharadi Pune Brochure.pdfSSPL The Strand Abodes Kharadi Pune Brochure.pdf
SSPL The Strand Abodes Kharadi Pune Brochure.pdfabbu831446
 
83770-87607 ۞Call Girls In Near The Park Hotel (Cp) Delhi
83770-87607 ۞Call Girls In Near The Park Hotel (Cp) Delhi83770-87607 ۞Call Girls In Near The Park Hotel (Cp) Delhi
83770-87607 ۞Call Girls In Near The Park Hotel (Cp) Delhidollysharma2066
 
8 Key Elements for Comfortable Farmland Living
8 Key Elements for Comfortable Farmland Living 8 Key Elements for Comfortable Farmland Living
8 Key Elements for Comfortable Farmland Living Farmland Bazaar
 
Call Girls In Vasundhara Ghaziabad ❤️8860477959 Low Rate Escorts Service In 2...
Call Girls In Vasundhara Ghaziabad ❤️8860477959 Low Rate Escorts Service In 2...Call Girls In Vasundhara Ghaziabad ❤️8860477959 Low Rate Escorts Service In 2...
Call Girls In Vasundhara Ghaziabad ❤️8860477959 Low Rate Escorts Service In 2...lizamodels9
 
Nanke Area Estate commercial ( Dir. Kat Kuo)
Nanke Area Estate commercial ( Dir. Kat Kuo)Nanke Area Estate commercial ( Dir. Kat Kuo)
Nanke Area Estate commercial ( Dir. Kat Kuo)jessica288382
 
Experion Elements Sector 45 Noida_Brochure.pdf.pdf
Experion Elements Sector 45 Noida_Brochure.pdf.pdfExperion Elements Sector 45 Noida_Brochure.pdf.pdf
Experion Elements Sector 45 Noida_Brochure.pdf.pdfkratirudram
 
Partner With the Golden Life Community for Single Women Over 55
Partner With the Golden Life Community for Single Women Over 55Partner With the Golden Life Community for Single Women Over 55
Partner With the Golden Life Community for Single Women Over 55Ron Surz
 
SVN Live 4.22.24 Weekly Property Broadcast
SVN Live 4.22.24 Weekly Property BroadcastSVN Live 4.22.24 Weekly Property Broadcast
SVN Live 4.22.24 Weekly Property BroadcastSVN International Corp.
 
Prestige Sector 94 at Noida E Brochure.pdf
Prestige Sector 94 at Noida E Brochure.pdfPrestige Sector 94 at Noida E Brochure.pdf
Prestige Sector 94 at Noida E Brochure.pdfsarak0han45400
 
Managed Farmland Brochures to get more in
Managed Farmland Brochures to get more inManaged Farmland Brochures to get more in
Managed Farmland Brochures to get more inknoxdigital1
 
Call Girls in Nehru Place Delhi 💯Call Us 🔝8264348440🔝
Call Girls in Nehru Place Delhi 💯Call Us 🔝8264348440🔝Call Girls in Nehru Place Delhi 💯Call Us 🔝8264348440🔝
Call Girls in Nehru Place Delhi 💯Call Us 🔝8264348440🔝soniya singh
 
Dynamic Netsoft A leader In Property management Software
Dynamic Netsoft A leader In Property management SoftwareDynamic Netsoft A leader In Property management Software
Dynamic Netsoft A leader In Property management SoftwareDynamic Netsoft
 
Ryan Mahoney - How Property Technology Is Altering the Real Estate Market
Ryan Mahoney - How Property Technology Is Altering the Real Estate MarketRyan Mahoney - How Property Technology Is Altering the Real Estate Market
Ryan Mahoney - How Property Technology Is Altering the Real Estate MarketRyan Mahoney
 

Dernier (20)

LCAR Unit 22 - Leasing and Property Management - 14th Edition Revised.pptx
LCAR Unit 22 - Leasing and Property Management - 14th Edition Revised.pptxLCAR Unit 22 - Leasing and Property Management - 14th Edition Revised.pptx
LCAR Unit 22 - Leasing and Property Management - 14th Edition Revised.pptx
 
A Brief History of Intangibles in Ad Valorem Taxation.pdf
A Brief History of Intangibles in Ad Valorem Taxation.pdfA Brief History of Intangibles in Ad Valorem Taxation.pdf
A Brief History of Intangibles in Ad Valorem Taxation.pdf
 
Cashpay_Call Girls In Gaur City Mall Noida ❤️8860477959 Escorts Service In 24...
Cashpay_Call Girls In Gaur City Mall Noida ❤️8860477959 Escorts Service In 24...Cashpay_Call Girls In Gaur City Mall Noida ❤️8860477959 Escorts Service In 24...
Cashpay_Call Girls In Gaur City Mall Noida ❤️8860477959 Escorts Service In 24...
 
Purva Palm Hills Devanahalli, Bangalore E- Brochure.pdf
Purva Palm Hills Devanahalli, Bangalore E- Brochure.pdfPurva Palm Hills Devanahalli, Bangalore E- Brochure.pdf
Purva Palm Hills Devanahalli, Bangalore E- Brochure.pdf
 
Covid 19 and Market Impact during the Pandemic
Covid 19 and Market Impact during the PandemicCovid 19 and Market Impact during the Pandemic
Covid 19 and Market Impact during the Pandemic
 
young call girls in Lajpat Nagar,🔝 9953056974 🔝 escort Service
young call girls in Lajpat Nagar,🔝 9953056974 🔝 escort Serviceyoung call girls in Lajpat Nagar,🔝 9953056974 🔝 escort Service
young call girls in Lajpat Nagar,🔝 9953056974 🔝 escort Service
 
SSPL The Strand Abodes Kharadi Pune Brochure.pdf
SSPL The Strand Abodes Kharadi Pune Brochure.pdfSSPL The Strand Abodes Kharadi Pune Brochure.pdf
SSPL The Strand Abodes Kharadi Pune Brochure.pdf
 
Hot call girls in Moti Bagh🔝 9953056974 🔝 escort Service
Hot call girls in Moti Bagh🔝 9953056974 🔝 escort ServiceHot call girls in Moti Bagh🔝 9953056974 🔝 escort Service
Hot call girls in Moti Bagh🔝 9953056974 🔝 escort Service
 
83770-87607 ۞Call Girls In Near The Park Hotel (Cp) Delhi
83770-87607 ۞Call Girls In Near The Park Hotel (Cp) Delhi83770-87607 ۞Call Girls In Near The Park Hotel (Cp) Delhi
83770-87607 ۞Call Girls In Near The Park Hotel (Cp) Delhi
 
8 Key Elements for Comfortable Farmland Living
8 Key Elements for Comfortable Farmland Living 8 Key Elements for Comfortable Farmland Living
8 Key Elements for Comfortable Farmland Living
 
Call Girls In Vasundhara Ghaziabad ❤️8860477959 Low Rate Escorts Service In 2...
Call Girls In Vasundhara Ghaziabad ❤️8860477959 Low Rate Escorts Service In 2...Call Girls In Vasundhara Ghaziabad ❤️8860477959 Low Rate Escorts Service In 2...
Call Girls In Vasundhara Ghaziabad ❤️8860477959 Low Rate Escorts Service In 2...
 
Nanke Area Estate commercial ( Dir. Kat Kuo)
Nanke Area Estate commercial ( Dir. Kat Kuo)Nanke Area Estate commercial ( Dir. Kat Kuo)
Nanke Area Estate commercial ( Dir. Kat Kuo)
 
Experion Elements Sector 45 Noida_Brochure.pdf.pdf
Experion Elements Sector 45 Noida_Brochure.pdf.pdfExperion Elements Sector 45 Noida_Brochure.pdf.pdf
Experion Elements Sector 45 Noida_Brochure.pdf.pdf
 
Partner With the Golden Life Community for Single Women Over 55
Partner With the Golden Life Community for Single Women Over 55Partner With the Golden Life Community for Single Women Over 55
Partner With the Golden Life Community for Single Women Over 55
 
SVN Live 4.22.24 Weekly Property Broadcast
SVN Live 4.22.24 Weekly Property BroadcastSVN Live 4.22.24 Weekly Property Broadcast
SVN Live 4.22.24 Weekly Property Broadcast
 
Prestige Sector 94 at Noida E Brochure.pdf
Prestige Sector 94 at Noida E Brochure.pdfPrestige Sector 94 at Noida E Brochure.pdf
Prestige Sector 94 at Noida E Brochure.pdf
 
Managed Farmland Brochures to get more in
Managed Farmland Brochures to get more inManaged Farmland Brochures to get more in
Managed Farmland Brochures to get more in
 
Call Girls in Nehru Place Delhi 💯Call Us 🔝8264348440🔝
Call Girls in Nehru Place Delhi 💯Call Us 🔝8264348440🔝Call Girls in Nehru Place Delhi 💯Call Us 🔝8264348440🔝
Call Girls in Nehru Place Delhi 💯Call Us 🔝8264348440🔝
 
Dynamic Netsoft A leader In Property management Software
Dynamic Netsoft A leader In Property management SoftwareDynamic Netsoft A leader In Property management Software
Dynamic Netsoft A leader In Property management Software
 
Ryan Mahoney - How Property Technology Is Altering the Real Estate Market
Ryan Mahoney - How Property Technology Is Altering the Real Estate MarketRyan Mahoney - How Property Technology Is Altering the Real Estate Market
Ryan Mahoney - How Property Technology Is Altering the Real Estate Market
 

Greater Toronto REALTORS Rental Report for Q2, 2012

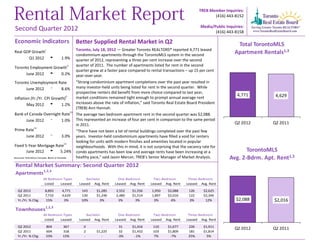
  • 1. TREB Member Inquiries:  (416) 443‐8152    Media/Public Inquiries:  Second Quarter 2012 (416) 443‐8158   Economic Indicators Better Supplied Rental Market in Q2  Total TorontoMLS i Toronto, July 18, 2012 — Greater Toronto REALTORS® reported 4,771 leased  Real GDP Growth condominium apartments through the TorontoMLS system in the second  Apartment Rentals1,3 Q1 2012  1.9% quarter of 2012, representing a three per cent increase over the second  quarter of 2011.  The number of apartments listed for rent in the second  Toronto Employment Growthi i quarter grew at a faster pace compared to rental transactions – up 15 per cent  June 2012  0.2% year‐over‐year.  Toronto Unemployment Rate “Strong condominium apartment completions over the past year resulted in  June 2012  8.6% many investor‐held units being listed for rent in the second quarter.  While  prospective renters did benefit from more choice compared to last year,  4,771 4,629 Inflation (Yr./Yr. CPI Growth)i i market conditions remained tight enough to prompt annual average rent  May 2012  1.2% increases above the rate of inflation,” said Toronto Real Estate Board President  (TREB) Ann Hannah.  Bank of Canada Overnight Ratei i i The average two bedroom apartment rent in the second quarter was $2,088.   June 2012  1.0% This represented an increase of four per cent in comparison to the same period  in 2011.  Q2 2012 Q2 2011 iii Prime Rate “There have not been a lot of rental buildings completed over the past few  June 2012  3.0% years.  Investor‐held condominium apartments have filled a void for renters  looking for units with modern finishes and amenities located in popular  Fixed 5‐Year Mortgage Ratei i i neighbourhoods.  With this in mind, it is not surprising that the vacancy rate for  June 2012  5.24% condo apartments has been low and average rents have been increasing at a  TorontoMLS S o u r c e s: S t a t ist ic s C a n a d a ; B a n k o f C a n a d a healthy pace,” said Jason Mercer, TREB’s Senior Manager of Market Analysis.  Avg. 2‐Bdrm. Apt. Rent1,3 Rental Market Summary: Second Quarter 2012 Apartments1,2,3 All Bedroom Types Bachelor One‐Bedroom Two‐Bedroom Three‐Bedroom Listed Leased Leased Avg. Rent Leased Avg. Rent Leased Avg. Rent Leased Avg. Rent Q2 2012 8,893 4,771 143 $1,285 2,552 $1,556 1,950 $2,088 126 $2,625 Q2 2011 7,710 4,629 130 $1,246 2,480 $1,514 1,897 $2,016 122 $2,346 Yr./Yr. % Chg. 15% 3% 10% 3% 3% 3% 3% 4% 3% 12% $2,088 $2,016 Townhouses1,2,3 All Bedroom Types Bachelor One‐Bedroom Two‐Bedroom Three‐Bedroom Listed Leased Leased Avg. Rent Leased Avg. Rent Leased Avg. Rent Leased Avg. Rent Q2 2012 804 367 0 ‐ 31 $1,416 110 $1,677 226 $1,911 Q2 2012 Q2 2011 Q2 2011 604 318 2 $1,225 32 $1,432 103 $1,809 181 $1,814 Yr./Yr. % Chg. 33% 15% ‐ ‐ ‐3% ‐1% 7% ‐7% 25% 5%
  • 2. Toronto Real Estate Board  SUMMARY OF RENTAL TRANSACTIONS Industrial Leasing  APARTMENTS, SECOND QUARTER 2012 ALL TREB AREAS All Apartments Bachelor One‐Bedroom Two‐Bedroom Three‐Bedroom 1 2 2 3 2 3 2 3 Total Listed Total Leased Leased Avg. Lease Rate Leased Avg. Lease Rate Leased Avg. Lease Rate Leased2 Avg. Lease Rate3 TREB Total 8,893 4,771 143 $1,285 2,552 $1,556 1,950 $2,088 126 $2,625 Halton Region 209 39 0 ‐ 15 $1,351 23 $1,627 1 $2,800 Burlington 32 3 0 ‐ 1 $1,200 2 $1,583 0 ‐ Halton Hills 0 0 0 ‐ 0 ‐ 0 ‐ 0 ‐ Milton 21 6 0 ‐ 3 $1,275 3 $1,583 0 ‐ Oakville 156 30 0 ‐ 11 $1,385 18 $1,639 1 $2,800 Peel Region 1,178 557 4 $1,088 232 $1,392 301 $1,672 20 $1,887 Brampton 88 42 1 $900 14 $1,271 26 $1,478 1 $1,650 Caledon 0 0 0 ‐ 0 ‐ 0 ‐ 0 ‐ Mississauga 1,090 515 3 $1,150 218 $1,400 275 $1,690 19 $1,899 City of Toronto 6,674 3,732 139 $1,291 2,058 $1,596 1,445 $2,220 90 $2,888 ! TURN PAGE FOR CITY OF TORONTO  TABLES OR CLICK HERE: York Region 782 414 0 ‐ 236 $1,396 165 $1,820 13 $2,103 Aurora 7 5 0 ‐ 0 ‐ 5 $1,660 0 ‐ E. Gwillimbury 0 0 0 ‐ 0 ‐ 0 ‐ 0 ‐ Georgina 1 0 0 ‐ 0 ‐ 0 ‐ 0 ‐ King 0 0 0 ‐ 0 ‐ 0 ‐ 0 ‐ Markham 339 177 0 ‐ 98 $1,370 74 $1,807 5 $1,786 Newmarket 4 2 0 ‐ 1 $1,550 1 $1,495 0 ‐ Richmond Hill 144 85 0 ‐ 48 $1,385 31 $1,747 6 $2,319 Vaughan 287 145 0 ‐ 89 $1,429 54 $1,900 2 $2,250 Whitchurch‐Stouffville 0 0 0 ‐ 0 ‐ 0 ‐ 0 ‐ Durham Region 44 27 0 ‐ 11 $1,267 14 $1,457 2 $1,475 Ajax 2 1 0 ‐ 0 ‐ 1 $1,450 0 ‐ Brock 0 0 0 ‐ 0 ‐ 0 ‐ 0 ‐ Clarington 6 6 0 ‐ 3 $1,063 3 $1,250 0 ‐ Oshawa 2 0 0 ‐ 0 ‐ 0 ‐ 0 ‐ Pickering 33 19 0 ‐ 8 $1,344 9 $1,550 2 $1,475 Scugog 0 0 0 ‐ 0 ‐ 0 ‐ 0 ‐ Uxbridge 0 0 0 ‐ 0 ‐ 0 ‐ 0 ‐ Whitby 1 1 0 ‐ 0 ‐ 1 $1,250 0 ‐ Dufferin County 4 2 0 ‐ 0 ‐ 2 $1,675 0 ‐ Orangeville 4 2 0 ‐ 0 ‐ 2 $1,675 0 ‐ Simcoe County 2 0 0 ‐ 0 ‐ 0 ‐ 0 ‐ Adjala‐Tosorontio 0 0 0 ‐ 0 ‐ 0 ‐ 0 ‐ Bradford West Gwillimbury 2 0 0 ‐ 0 ‐ 0 ‐ 0 ‐ Essa 0 0 0 ‐ 0 ‐ 0 ‐ 0 ‐ Innisfil 0 0 0 ‐ 0 ‐ 0 ‐ 0 ‐ New Tecumseth 0 0 0 ‐ 0 ‐ 0 ‐ 0 ‐ Page 3  Rental Market Report, Second Quarter 2012 2 
  • 3. Toronto Real Estate Board  SUMMARY OF RENTAL TRANSACTIONS Industrial Leasing  APARTMENTS, SECOND QUARTER 2012 CITY OF TORONTO MUNICIPAL BREAKDOWN All Apartments Bachelor One‐Bedroom Two‐Bedroom Three‐Bedroom 1 2 2 3 2 3 2 3 Total Listed Total Leased Leased Avg. Lease Rate Leased Avg. Lease Rate Leased Avg. Lease Rate Leased2 Avg. Lease Rate3 TREB Total 8,893 4,771 143 $1,285 2,552 $1,556 1,950 $2,088 126 $2,625 City of Toronto Total 6,674 3,732 139 $1,291 2,058 $1,596 1,445 $2,220 90 $2,888 Toronto West 947 443 4 $1,200 216 $1,454 209 $1,933 14 $2,182 Toronto W01 96 47 0 ‐ 27 $1,500 20 $2,278 0 ‐ Toronto W02 8 7 0 ‐ 4 $1,536 3 $1,957 0 ‐ Toronto W03 21 3 0 ‐ 2 $1,200 0 ‐ 1 $1,750 Toronto W04 15 7 0 ‐ 2 $1,150 5 $1,341 0 ‐ Toronto W05 121 59 0 ‐ 47 $1,382 11 $1,723 1 $1,425 Toronto W06 402 195 4 $1,200 88 $1,529 99 $2,091 4 $3,575 Toronto W07 10 4 0 ‐ 1 $1,550 2 $2,325 1 $2,100 Toronto W08 172 79 0 ‐ 36 $1,422 40 $1,815 3 $1,792 Toronto W09 34 13 0 ‐ 0 ‐ 12 $1,527 1 $1,400 Toronto W10 68 29 0 ‐ 9 $1,167 17 $1,426 3 $1,400 Toronto Central 5,215 3,032 131 $1,305 1,729 $1,634 1,107 $2,348 65 $3,237 Toronto C01 2,160 1,350 78 $1,350 795 $1,739 453 $2,603 24 $4,321 Toronto C02 214 105 6 $1,418 50 $1,939 45 $3,918 4 $5,975 Toronto C03 15 5 0 ‐ 2 $1,625 3 $2,397 0 ‐ Toronto C04 41 15 1 $1,050 4 $1,838 7 $2,486 3 $1,757 Toronto C06 38 16 0 ‐ 11 $1,378 5 $1,560 0 ‐ Toronto C07 314 166 0 ‐ 82 $1,432 69 $1,869 15 $2,056 Toronto C08 547 363 24 $1,304 233 $1,654 106 $2,279 0 ‐ Toronto C09 60 32 0 ‐ 15 $1,780 16 $2,475 1 $2,300 Toronto C10 137 86 1 $950 50 $1,736 35 $2,646 0 ‐ Toronto C11 18 10 0 ‐ 4 $1,293 5 $1,570 1 $1,300 Toronto C12 29 16 0 ‐ 7 $1,814 9 $2,929 0 ‐ Toronto C13 140 55 0 ‐ 15 $1,298 39 $1,711 1 $1,625 Toronto C14 940 469 6 $1,205 249 $1,469 202 $1,930 12 $2,789 Toronto C15 562 344 15 $1,103 212 $1,415 113 $1,927 4 $1,994 Toronto East 512 257 4 $923 113 $1,288 129 $1,588 11 $1,723 Toronto E01 6 4 0 ‐ 3 $1,577 1 $1,725 0 ‐ Toronto E02 10 5 0 ‐ 0 ‐ 5 $2,370 0 ‐ Toronto E03 26 13 3 $900 3 $1,417 7 $2,321 0 ‐ Toronto E04 34 17 0 ‐ 7 $1,196 8 $1,391 2 $1,275 Toronto E05 58 29 0 ‐ 10 $1,406 16 $1,626 3 $1,983 Toronto E06 2 0 0 ‐ 0 ‐ 0 ‐ 0 ‐ Toronto E07 78 43 0 ‐ 13 $1,259 28 $1,438 2 $1,750 Toronto E08 15 3 0 ‐ 1 $1,600 2 $1,400 0 ‐ Toronto E09 247 120 1 $990 66 $1,286 50 $1,575 3 $1,800 Toronto E10 5 1 0 ‐ 0 ‐ 1 $1,450 0 ‐ Toronto E11 31 22 0 ‐ 10 $1,126 11 $1,327 1 $1,550 Page 3  Rental Market Report, Second Quarter 2012 3 
  • 4. Toronto Real Estate Board  SUMMARY OF RENTAL TRANSACTIONS Industrial Leasing  TOWNHOUSES, SECOND QUARTER 2012 ALL TREB AREAS All Apartments Bachelor One‐Bedroom Two‐Bedroom Three‐Bedroom 1 2 2 3 2 3 2 3 Total Listed Total Leased Leased Avg. Lease Rate Leased Avg. Lease Rate Leased Avg. Lease Rate Leased2 Avg. Lease Rate3 TREB Total 804 367 0 ‐ 31 $1,416 110 $1,677 226 $1,911 Halton Region 91 36 0 ‐ 0 ‐ 7 $1,496 29 $1,902 Burlington 18 5 0 ‐ 0 ‐ 2 $1,325 3 $1,692 Halton Hills 2 1 0 ‐ 0 ‐ 1 $1,220 0 ‐ Milton 19 6 0 ‐ 0 ‐ 0 ‐ 6 $1,642 Oakville 52 24 0 ‐ 0 ‐ 4 $1,650 20 $2,012 Peel Region 271 137 0 ‐ 12 $1,094 31 $1,495 94 $1,712 Brampton 16 8 0 ‐ 3 $967 0 ‐ 5 $1,610 Caledon 0 0 0 ‐ 0 ‐ 0 ‐ 0 ‐ Mississauga 255 129 0 ‐ 9 $1,136 31 $1,495 89 $1,718 City of Toronto 289 124 0 ‐ 17 $1,664 51 $1,916 56 $2,333 ! TURN PAGE FOR CITY OF TORONTO  TABLES OR CLICK HERE: York Region 128 57 0 ‐ 2 $1,234 14 $1,488 41 $1,868 Aurora 2 2 0 ‐ 0 ‐ 1 $1,400 1 $2,500 E. Gwillimbury 0 0 0 ‐ 0 ‐ 0 ‐ 0 ‐ Georgina 1 1 0 ‐ 0 ‐ 0 ‐ 1 $2,200 King 0 0 0 ‐ 0 ‐ 0 ‐ 0 ‐ Markham 81 37 0 ‐ 2 $1,234 11 $1,507 24 $1,838 Newmarket 0 0 0 ‐ 0 ‐ 0 ‐ 0 ‐ Richmond Hill 22 8 0 ‐ 0 ‐ 2 $1,425 6 $1,727 Vaughan 22 9 0 ‐ 0 ‐ 0 ‐ 9 $1,932 Whitchurch‐Stouffville 0 0 0 ‐ 0 ‐ 0 ‐ 0 ‐ Durham Region 24 12 0 ‐ 0 ‐ 6 $1,290 6 $1,425 Ajax 4 1 0 ‐ 0 ‐ 0 ‐ 1 $1,450 Brock 0 0 0 ‐ 0 ‐ 0 ‐ 0 ‐ Clarington 6 2 0 ‐ 0 ‐ 1 $1,500 1 $1,425 Oshawa 0 0 0 ‐ 0 ‐ 0 ‐ 0 ‐ Pickering 4 3 0 ‐ 0 ‐ 1 $1,400 2 $1,388 Scugog 0 0 0 ‐ 0 ‐ 0 ‐ 0 ‐ Uxbridge 0 0 0 ‐ 0 ‐ 0 ‐ 0 ‐ Whitby 10 6 0 ‐ 0 ‐ 4 $1,210 2 $1,450 Dufferin County 1 1 0 ‐ 0 ‐ 1 $1,395 0 ‐ Orangeville 1 1 0 ‐ 0 ‐ 1 $1,395 0 ‐ Simcoe County 0 0 0 ‐ 0 ‐ 0 ‐ 0 ‐ Adjala‐Tosorontio 0 0 0 ‐ 0 ‐ 0 ‐ 0 ‐ Bradford West Gwillimbury 0 0 0 ‐ 0 ‐ 0 ‐ 0 ‐ Essa 0 0 0 ‐ 0 ‐ 0 ‐ 0 ‐ Innisfil 0 0 0 ‐ 0 ‐ 0 ‐ 0 ‐ New Tecumseth 0 0 0 ‐ 0 ‐ 0 ‐ 0 ‐ Page 3  Rental Market Report, Second Quarter 2012 4 
  • 5. Toronto Real Estate Board  SUMMARY OF RENTAL TRANSACTIONS Industrial Leasing  TOWNHOUSES, SECOND QUARTER 2012 CITY OF TORONTO MUNICIPAL BREAKDOWN All Apartments Bachelor One‐Bedroom Two‐Bedroom Three‐Bedroom 1 2 2 3 2 3 2 3 Total Listed Total Leased Leased Avg. Lease Rate Leased Avg. Lease Rate Leased Avg. Lease Rate Leased2 Avg. Lease Rate3 TREB Total 804 367 0 ‐ 31 $1,416 110 $1,677 226 $1,911 City of Toronto Total 289 124 0 ‐ 17 $1,664 51 $1,916 56 $2,333 Toronto West 51 18 0 ‐ 3 $1,275 9 $1,417 6 $1,775 Toronto W01 10 4 0 ‐ 3 $1,275 0 ‐ 1 $2,500 Toronto W02 4 2 0 ‐ 0 ‐ 1 $1,850 1 $1,550 Toronto W03 2 0 0 ‐ 0 ‐ 0 ‐ 0 ‐ Toronto W04 5 1 0 ‐ 0 ‐ 0 ‐ 1 $1,400 Toronto W05 22 10 0 ‐ 0 ‐ 8 $1,363 2 $1,675 Toronto W06 4 0 0 ‐ 0 ‐ 0 ‐ 0 ‐ Toronto W07 0 0 0 ‐ 0 ‐ 0 ‐ 0 ‐ Toronto W08 1 1 0 ‐ 0 ‐ 0 ‐ 1 $1,850 Toronto W09 3 0 0 ‐ 0 ‐ 0 ‐ 0 ‐ Toronto W10 0 0 0 ‐ 0 ‐ 0 ‐ 0 ‐ Toronto Central 178 84 0 ‐ 14 $1,748 36 $2,100 34 $2,735 Toronto C01 56 34 0 ‐ 8 $1,959 17 $2,278 9 $3,377 Toronto C02 2 0 0 ‐ 0 ‐ 0 ‐ 0 ‐ Toronto C03 0 0 0 ‐ 0 ‐ 0 ‐ 0 ‐ Toronto C04 0 0 0 ‐ 0 ‐ 0 ‐ 0 ‐ Toronto C06 1 1 0 ‐ 0 ‐ 0 ‐ 1 $1,700 Toronto C07 14 5 0 ‐ 0 ‐ 4 $1,739 1 $1,550 Toronto C08 16 9 0 ‐ 2 $1,738 2 $1,725 5 $3,397 Toronto C09 2 1 0 ‐ 0 ‐ 1 $3,100 0 ‐ Toronto C10 4 2 0 ‐ 0 ‐ 2 $1,950 0 ‐ Toronto C11 1 1 0 ‐ 0 ‐ 1 $1,650 0 ‐ Toronto C12 4 1 0 ‐ 0 ‐ 0 ‐ 1 $3,200 Toronto C13 0 0 0 ‐ 0 ‐ 0 ‐ 0 ‐ Toronto C14 40 20 0 ‐ 4 $1,330 9 $1,981 7 $2,884 Toronto C15 38 10 0 ‐ 0 ‐ 0 ‐ 10 $1,899 Toronto East 60 22 0 ‐ 0 ‐ 6 $1,563 16 $1,686 Toronto E01 6 1 0 ‐ 0 ‐ 1 $1,600 0 ‐ Toronto E02 6 2 0 ‐ 0 ‐ 1 $2,000 1 $2,750 Toronto E03 0 0 0 ‐ 0 ‐ 0 ‐ 0 ‐ Toronto E04 10 3 0 ‐ 0 ‐ 1 $1,300 2 $1,550 Toronto E05 15 6 0 ‐ 0 ‐ 0 ‐ 6 $1,583 Toronto E06 0 0 0 ‐ 0 ‐ 0 ‐ 0 ‐ Toronto E07 7 4 0 ‐ 0 ‐ 0 ‐ 4 $1,681 Toronto E08 1 1 0 ‐ 0 ‐ 0 ‐ 1 $1,600 Toronto E09 10 2 0 ‐ 0 ‐ 2 $1,613 0 ‐ Toronto E10 1 0 0 ‐ 0 ‐ 0 ‐ 0 ‐ Toronto E11 4 3 0 ‐ 0 ‐ 1 $1,250 2 $1,650 Page 3  Rental Market Report, Second Quarter 2012 5 
  • 6. Toronto Real Estate Board  Share of GTA Condo  Industrial Leasing  Apartments In Rental 23.6% 19.9% 18.4% 12.8% 12.0% Halton Peel Toronto York Durham Source: CMHC, 2011 Fall Rental Market Survey GTA Condo  Apartment  Vacancy Rate 1.3% 0.8% NOTES 1 Refers to the total number of rental units that were available during the reporting period. 2 Refers to firm lease transactions entered in the TorontoMLS system between the first and last day of the reporting period. 3 Refers to the average lease rate for firm lease transactions entered in the TorontoMLS system between the first and last day of the reporting period. 0.3% 0.3% 4   Statistics Canada, Quarter‐over‐quarter annualized growth rate. 5   Statistics Canada, Year‐over‐year growth rate. 6 Bank of Canada, rates for most recently completed month. Halton Peel Toronto York Durham Source: CMHC, 2011 Fall Rental Market Survey Page 3  Rental Market Report, Second Quarter 2012 6