Market Watch December 2012
•
0 j'aime•399 vues

Here is the most recent Market watch for the Toronto Real Estate Board for December 2012.

Recommandé
Contenu connexe
Tendances
Tendances (13)
En vedette
En vedette (20)
Similaire à Market Watch December 2012
Similaire à Market Watch December 2012 (20)
Plus de Richard Silver, Certified International REALTOR®
Plus de Richard Silver, Certified International REALTOR® (20)
Dernier
Dernier (20)
Market Watch December 2012
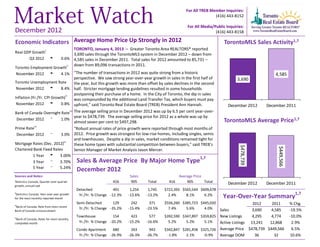
- 1. For All TREB Member Inquiries: (416) 443-8152 For All Media/Public Inquiries: December 2012 (416) 443-8158 Economic Indicators Average Home Price Up Strongly in 2012 TorontoMLS Sales Activity1,7 TORONTO, January 4, 2013 – Greater Toronto Area REALTORS® reported Real GDP Growthi 3,690 sales through the TorontoMLS system in December 2012 – down from Q3 2012 t 0.6% 4,585 sales in December 2011. Total sales for 2012 amounted to 85,731 – down from 89,096 transactions in 2011. Toronto Employment Growthi i November 2012 t 4.1% “The number of transactions in 2012 was quite strong from a historic 4,585 perspective. We saw strong year-over-year growth in sales in the first half of 3,690 Toronto Unemployment Rate the year, but this growth was more than offset by sales declines in the second November 2012 u 8.4% half. Stricter mortgage lending guidelines resulted in some households ii postponing their purchase of a home. In the City of Toronto, the dip in sales Inflation (Yr./Yr. CPI Growth) was compounded by the additional Land Transfer Tax, which buyers must pay November 2012 u 0.8% upfront,” said Toronto Real Estate Board (TREB) President Ann Hannah. December 2012 December 2011 Bank of Canada Overnight Rate The average selling price in December 2012 was up by 6.5 per cent year-over- iii year to $478,739. The average selling price for 2012 as a whole was up by December 2012 q 1.0% TorontoMLS Average Price1,7 almost seven per cent to $497,298. iv Prime Rate “Robust annual rates of price growth were reported through most months of December 2012 q 3.0% 2012. Price growth was strongest for low-rise homes, including singles, semis and townhouses. Despite a dip in sales, market conditions remained tight for iv Mortgage Rates (Dec. 2012) these home types with substantial competition between buyers,” said TREB’s $478,739 $449,566 Chartered Bank Fixed Rates Senior Manager of Market Analysis Jason Mercer. 1 Year u 3.00% 1,7 3 Year q 3.70% Sales & Average Price By Major Home Type 5 Year q 5.24% December 2012 Sources and Notes: Sales Average Price i Statistics Canada, Quarter-over-quarter 416 905 Total 416 905 Total December 2012 December 2011 growth, annualized Detached 491 1,254 1,745 $722,393 $565,544 $609,678 ii Statistics Canada, Year-over-year growth 1,7 for the most recently reported month Yr./Yr. % Change -12.3% -13.6% -13.2% 2.4% 8.1% 6.2% Year-Over-Year Summary Semi-Detached 129 242 371 $556,260 $385,723 $445,020 2012 2011 % Chg. iii Bank of Canada, Rate from most recent Yr./Yr. % Change -35.2% -15.4% -23.5% 7.4% 5.6% 4.0% Sales 3,690 4,585 -19.5% Bank of Canada announcement iv Townhouse 154 423 577 $392,590 $347,897 $359,825 New Listings 4,295 4,774 -10.0% Bank of Canada, Rates for most recently completed month Yr./Yr. % Change -20.2% -15.2% -16.6% 5.2% 5.2% 5.1% Active Listings 13,241 12,868 2.9% Condo Apartment 680 263 943 $342,847 $281,458 $325,726 Average Price $478,739 $449,566 6.5% Yr./Yr. % Change -26.9% -26.3% -26.7% -1.8% 2.1% -0.9% Average DOM 36 32 10.6%
- 2. Toronto Real Estate Board SALES BY PRICE RANGE AND HOUSE TYPE1,7 DECEMBER 2012 Price Range Detached Semi-Detached Att/Row/Twnhouse Condo Townhouse Condo Apt Link Co-op Apt Det Condo Co-ownership Apt Total $0 to $99,999 2 0 0 1 15 0 0 0 0 18 $100,000 to $199,999 28 7 2 34 136 0 2 0 0 209 $200,000 to $299,999 142 32 39 113 326 3 2 1 2 660 $300,000 to $399,999 279 126 110 106 280 14 0 0 1 916 $400,000 to $499,999 355 121 70 34 103 15 0 1 0 699 $500,000 to $599,999 294 44 29 12 40 7 0 0 0 426 $600,000 to $699,999 207 17 14 4 19 2 1 0 0 264 $700,000 to $799,999 142 14 3 1 7 2 0 0 0 169 $800,000 to $899,999 83 5 2 0 2 0 1 0 0 93 $900,000 to $999,999 57 2 0 2 4 0 0 0 0 65 $1,000,000 to $1,249,999 55 1 0 0 4 0 0 0 0 60 $1,250,000 to $1,499,999 42 1 0 1 3 0 0 0 0 47 $1,500,000 to $1,749,999 21 0 0 0 0 0 0 0 0 21 $1,750,000 to $1,999,999 15 0 0 0 1 0 0 0 0 16 $2,000,000 + 23 1 0 0 3 0 0 0 0 27 Total Sales 1,745 371 269 308 943 43 6 2 3 3,690 Share of Total Sales 47.3% 10.1% 7.3% 8.3% 25.6% 1.2% 0.2% 0.1% 0.1% - Average Price $609,678 $445,020 $402,903 $322,202 $325,726 $440,412 $370,625 $380,000 $285,667 $478,739 SALES BY PRICE RANGE AND HOUSE TYPE1,7 YEAR-TO-DATE, 2012 Price Range Detached Semi-Detached Att/Row/Twnhouse Condo Townhouse Condo Apt Link Co-op Apt Det Condo Co-ownership Apt Total $0 to $99,999 41 3 8 25 224 0 9 0 8 318 $100,000 to $199,999 617 164 60 716 2,566 13 44 0 13 4,193 $200,000 to $299,999 3,078 661 1,116 2,253 6,542 339 26 22 43 14,080 $300,000 to $399,999 6,478 2,967 2,245 2,462 5,990 292 21 33 13 20,501 $400,000 to $499,999 8,059 3,156 1,855 773 2,401 379 11 10 7 16,651 $500,000 to $599,999 7,149 1,194 778 239 909 308 9 6 0 10,592 $600,000 to $699,999 5,080 547 368 135 439 72 2 4 0 6,647 $700,000 to $799,999 3,433 315 108 87 190 11 3 1 0 4,148 $800,000 to $899,999 2,222 169 77 31 116 0 1 1 0 2,617 $900,000 to $999,999 1,257 85 29 13 63 0 0 0 0 1,447 $1,000,000 to $1,249,999 1,575 74 30 16 114 2 2 1 0 1,814 $1,250,000 to $1,499,999 1,001 43 10 5 46 0 1 0 0 1,106 $1,500,000 to $1,749,999 526 23 10 3 33 0 0 1 0 596 $1,750,000 to $1,999,999 297 9 2 0 15 0 0 0 0 323 $2,000,000 + 658 9 2 1 28 0 0 0 0 698 Total Sales 41,471 9,419 6,698 6,759 19,676 1,416 129 79 84 85,731 Share of Total Sales 48.4% 11.0% 7.8% 7.9% 23.0% 1.7% 0.2% 0.1% 0.1% - Average Price $625,859 $459,943 $421,413 $329,042 $336,522 $414,559 $300,006 $404,730 $249,324 $497,298 Page 3 July 2010 Market Watch, December 2012 2
- 3. Toronto Real Estate Board ALL HOME TYPES, DECEMBER 2012 SUMMARY OF EXISTING HOME TRANSACTIONS ALL TREB AREAS Number of Sales Dollar Volume1 Average Price1 Median Price1 New Listings2 SNLR (Trend) 8 Active Listings3 Mos. Inv. (Trend)9 Avg. SP/LP 4 Avg. DOM5 TREB Total 3,690 $1,766,546,971 $478,739 $405,000 4,295 53.9% 13,241 2.5 97% 36 Halton Region 253 $132,806,363 $524,926 $465,000 252 57.1% 932 2.5 97% 34 Burlington 47 $21,804,600 $463,928 $455,000 42 58.8% 153 2.7 98% 32 Halton Hills 29 $12,486,987 $430,586 $408,000 51 65.2% 158 2.4 97% 44 Milton 80 $37,093,301 $463,666 $430,950 71 56.5% 199 1.9 98% 32 Oakville 97 $61,421,475 $633,211 $535,000 88 54.3% 422 2.9 97% 34 Peel Region 785 $337,389,704 $429,796 $385,000 1,089 53.1% 2,855 2.4 97% 32 Brampton 361 $144,554,670 $400,428 $374,500 510 52.4% 1,200 2.3 97% 32 Caledon 31 $18,100,590 $583,890 $550,000 34 52.0% 209 3.9 96% 47 Mississauga 393 $174,734,444 $444,617 $393,000 545 53.7% 1,446 2.4 97% 32 City of Toronto 1,470 $726,367,202 $494,127 $404,250 1,679 51.0% 5,291 2.7 97% 37 ! TURN PAGE FOR CITY OF TORONTO TABLES OR CLICK HERE: York Region 661 $395,300,777 $598,034 $522,500 715 53.4% 2,460 2.5 96% 38 Aurora 35 $21,501,688 $614,334 $475,000 28 61.5% 117 2.1 93% 53 E. Gwillimbury 12 $5,743,000 $478,583 $380,500 17 56.6% 83 3.3 96% 45 Georgina 37 $11,651,500 $314,905 $290,000 43 64.0% 138 3.1 97% 53 King 9 $10,635,000 $1,181,667 $818,000 21 45.9% 125 6.0 92% 99 Markham 164 $97,813,499 $596,424 $547,250 191 52.4% 617 2.4 96% 32 Newmarket 57 $26,540,057 $465,615 $437,000 36 69.6% 123 1.4 97% 38 Richmond Hill 135 $90,797,976 $672,578 $574,000 145 49.0% 478 2.5 96% 36 Vaughan 186 $115,324,057 $620,022 $560,000 189 51.2% 626 2.5 97% 32 Whitchurch-Stouffville 26 $15,294,000 $588,231 $485,500 45 50.2% 153 3.4 96% 47 Durham Region 410 $134,181,175 $327,271 $300,000 455 64.4% 1,162 2.0 97% 32 Ajax 70 $24,501,805 $350,026 $323,300 80 66.4% 155 1.5 98% 28 Brock 7 $2,168,500 $309,786 $270,000 17 45.4% 93 7.5 96% 70 Clarington 64 $19,494,200 $304,597 $277,500 80 67.5% 178 2.1 97% 28 Oshawa 108 $27,221,513 $252,051 $236,750 115 66.4% 254 1.8 97% 32 Pickering 53 $21,550,117 $406,606 $359,000 53 61.9% 137 1.9 98% 32 Scugog 12 $4,843,500 $403,625 $339,250 8 53.9% 74 4.5 94% 62 Uxbridge 13 $5,363,000 $412,538 $395,000 22 54.3% 84 4.3 96% 59 Whitby 83 $29,038,540 $349,862 $320,000 80 65.9% 187 1.6 98% 28 Dufferin County 22 $7,814,350 $355,198 $338,000 19 72.8% 81 2.3 98% 42 Orangeville 22 $7,814,350 $355,198 $338,000 19 72.8% 81 2.3 98% 42 Simcoe County 89 $32,687,400 $367,274 $349,000 86 59.6% 460 3.7 96% 47 Adjala-Tosorontio 9 $4,039,000 $448,778 $407,000 6 49.7% 56 6.4 96% 49 Bradford West Gwillimbury 27 $12,226,500 $452,833 $430,000 20 62.6% 96 2.4 96% 35 Essa 7 $1,831,500 $261,643 $235,000 7 56.4% 56 4.7 96% 56 Innisfil 23 $7,719,500 $335,630 $321,000 23 56.1% 130 4.4 96% 49 New Tecumseth 23 $6,870,900 $298,735 $285,000 30 66.0% 122 3.1 97% 55 Page 3 July 2010 Market Watch, December 2012 3
- 4. Toronto Real Estate Board ALL HOME TYPES, DECEMBER 2012 SUMMARY OF EXISTING HOME TRANSACTIONS CITY OF TORONTO MUNICIPAL BREAKDOWN 1 1 1 2 8 3 4 5 Number of Sales Dollar Volume Average Price Median Price New Listings SNLR (Trend) Active Listings Mos. Inv. (Trend)9 Avg. SP/LP Avg. DOM TREB Total 3,690 $1,766,546,971 $478,739 $405,000 4,295 53.9% 13,241 2.5 97% 36 City of Toronto Total 1,470 $726,367,202 $494,127 $404,250 1,679 51.0% 5,291 2.7 97% 37 Toronto West 384 $169,638,031 $441,766 $397,450 433 54.1% 1,341 2.7 97% 36 Toronto W01 19 $10,955,475 $576,604 $429,000 20 50.3% 65 2.6 96% 31 Toronto W02 38 $21,229,500 $558,671 $539,500 29 64.3% 78 1.4 100% 20 Toronto W03 40 $16,782,566 $419,564 $397,450 31 65.1% 88 1.8 98% 25 Toronto W04 42 $16,169,500 $384,988 $362,500 40 57.3% 128 2.6 97% 40 Toronto W05 50 $14,063,450 $281,269 $274,000 62 56.1% 182 2.9 97% 47 Toronto W06 56 $24,410,610 $435,904 $441,000 82 41.6% 318 4.0 97% 43 Toronto W07 6 $3,323,000 $553,833 $584,500 8 68.1% 28 1.3 98% 28 Toronto W08 84 $45,903,300 $546,468 $491,450 67 54.7% 218 2.7 97% 33 Toronto W09 19 $7,304,630 $384,454 $460,000 25 54.3% 76 2.9 96% 62 Toronto W10 30 $9,496,000 $316,533 $372,500 69 52.7% 160 2.9 96% 27 Toronto Central 650 $378,859,814 $582,861 $410,000 788 46.2% 2,763 3.1 97% 40 Toronto C01 167 $78,879,340 $472,331 $394,500 268 41.4% 926 3.8 98% 39 Toronto C02 26 $16,717,899 $642,996 $556,250 34 44.5% 182 3.9 97% 40 Toronto C03 20 $23,811,999 $1,190,600 $687,500 20 56.9% 73 2.3 95% 28 Toronto C04 35 $34,668,018 $990,515 $1,020,000 48 52.1% 145 2.5 96% 40 Toronto C06 22 $14,237,465 $647,158 $650,995 24 51.6% 64 2.7 98% 45 Toronto C07 48 $23,510,590 $489,804 $379,400 56 45.1% 210 3.1 97% 41 Toronto C08 73 $30,620,175 $419,454 $353,000 71 47.5% 237 2.9 97% 33 Toronto C09 13 $13,956,000 $1,073,538 $620,000 12 54.9% 38 2.7 94% 43 Toronto C10 27 $15,605,400 $577,978 $500,000 18 57.9% 64 1.9 100% 33 Toronto C11 18 $10,589,550 $588,308 $247,500 18 55.7% 72 2.4 97% 43 Toronto C12 11 $17,786,000 $1,616,909 $1,286,000 29 41.2% 117 4.6 96% 46 Toronto C13 33 $17,467,300 $529,312 $415,000 35 56.5% 101 2.1 99% 32 Toronto C14 81 $45,814,188 $565,607 $388,500 95 41.9% 332 3.3 96% 48 Toronto C15 76 $35,195,890 $463,104 $375,620 60 46.9% 202 3.0 98% 41 Toronto East 436 $177,869,357 $407,957 $395,000 458 57.1% 1,187 2.1 98% 33 Toronto E01 26 $13,284,800 $510,954 $445,500 29 60.1% 85 1.6 99% 28 Toronto E02 32 $21,250,400 $664,075 $628,500 20 60.4% 49 1.4 99% 21 Toronto E03 55 $28,108,750 $511,068 $535,000 37 59.1% 87 1.6 100% 28 Toronto E04 63 $20,477,299 $325,036 $365,000 65 57.3% 166 2.2 98% 32 Toronto E05 42 $15,380,050 $366,192 $309,500 33 59.2% 101 1.8 97% 35 Toronto E06 14 $6,430,800 $459,343 $407,000 16 53.6% 34 1.8 97% 31 Toronto E07 42 $15,002,100 $357,193 $362,000 64 52.9% 158 2.7 97% 44 Toronto E08 27 $10,047,000 $372,111 $425,000 26 55.5% 103 2.6 97% 43 Toronto E09 65 $21,062,140 $324,033 $328,000 61 56.1% 161 2.6 97% 35 Toronto E10 32 $13,366,468 $417,702 $402,500 41 59.1% 97 2.1 97% 32 Toronto E11 38 $13,459,550 $354,199 $351,000 66 54.8% 146 2.5 97% 32 Page 3 July 2010 Market Watch, December 2012 4
- 5. Toronto Real Estate Board ALL HOME TYPES, YEAR-TO-DATE 2012 SUMMARY OF EXISTING HOME TRANSACTIONS ALL TREB AREAS Number of Sales Dollar Volume1 Average Price1 Median Price1 New Listings2 Avg. SP/LP 4 Avg. DOM5 TREB Total 85,731 $42,633,873,338 $497,298 $420,000 158,927 99% 25 Halton Region 5,620 $3,155,959,032 $561,559 $470,000 9,836 98% 26 Burlington 848 $403,647,510 $475,999 $410,000 1,441 98% 28 Halton Hills 870 $400,528,513 $460,378 $429,000 1,335 98% 29 Milton 1,710 $791,067,530 $462,613 $427,950 3,024 99% 20 Oakville 2,192 $1,560,715,479 $712,005 $593,000 4,036 97% 28 Peel Region 18,561 $8,133,605,930 $438,209 $397,000 34,987 98% 24 Brampton 7,956 $3,215,338,667 $404,140 $383,000 15,175 98% 23 Caledon 800 $446,927,366 $558,659 $490,000 1,538 97% 33 Mississauga 9,805 $4,471,339,897 $456,027 $407,007 18,274 98% 24 City of Toronto 32,658 $17,571,726,493 $538,053 $425,000 64,091 99% 25 ! TURN PAGE FOR CITY OF TORONTO TABLES OR CLICK HERE: York Region 15,683 $9,303,848,054 $593,244 $535,000 29,354 98% 24 Aurora 878 $497,622,599 $566,768 $495,000 1,428 98% 22 E. Gwillimbury 310 $156,985,159 $506,404 $432,150 548 97% 33 Georgina 846 $266,860,678 $315,438 $295,000 1,321 98% 37 King 274 $236,412,079 $862,818 $722,750 597 95% 51 Markham 4,252 $2,574,856,078 $605,564 $550,793 8,107 99% 22 Newmarket 1,478 $663,813,704 $449,130 $425,000 2,124 99% 20 Richmond Hill 3,058 $2,034,092,280 $665,171 $595,500 6,237 98% 21 Vaughan 3,874 $2,444,571,111 $631,020 $575,000 7,572 98% 23 Whitchurch-Stouffville 713 $428,634,366 $601,170 $520,000 1,420 97% 31 Durham Region 10,549 $3,544,369,563 $335,991 $312,000 16,385 98% 27 Ajax 1,947 $717,102,941 $368,312 $350,000 2,932 99% 22 Brock 206 $57,569,096 $279,462 $237,500 454 96% 80 Clarington 1,705 $500,537,467 $293,570 $274,500 2,526 98% 29 Oshawa 2,563 $663,453,560 $258,858 $244,000 3,859 98% 26 Pickering 1,428 $568,842,307 $398,349 $369,950 2,308 98% 24 Scugog 308 $116,194,898 $377,256 $333,000 571 97% 46 Uxbridge 319 $151,829,511 $475,955 $439,000 587 97% 49 Whitby 2,073 $768,839,783 $370,883 $349,000 3,148 99% 21 Dufferin County 615 $211,144,215 $343,324 $320,000 845 98% 38 Orangeville 615 $211,144,215 $343,324 $320,000 845 98% 38 Simcoe County 2,045 $713,220,051 $348,763 $320,000 3,429 97% 46 Adjala-Tosorontio 149 $63,968,950 $429,322 $395,000 300 96% 71 Bradford West Gwillimbury 535 $221,532,924 $414,080 $390,000 854 98% 29 Essa 275 $81,195,250 $295,255 $260,000 488 98% 55 Innisfil 529 $169,723,779 $320,839 $300,000 943 97% 51 New Tecumseth 557 $176,799,148 $317,413 $292,000 844 97% 46 Page 3 July 2010 Market Watch, December 2012 5
- 6. Toronto Real Estate Board ALL HOME TYPES, YEAR-TO-DATE 2012 SUMMARY OF EXISTING HOME TRANSACTIONS CITY OF TORONTO MUNICIPAL BREAKDOWN 1 1 1 2 4 5 Number of Sales Dollar Volume Average Price Median Price New Listings Avg. SP/LP Avg. DOM TREB Total 85,731 $42,633,873,338 $497,298 $420,000 158,927 99% 25 City of Toronto Total 32,658 $17,571,726,493 $538,053 $425,000 64,091 99% 25 Toronto West 8,493 $4,009,148,019 $472,053 $415,000 15,701 100% 26 Toronto W01 583 $345,343,453 $592,356 $530,000 1,159 102% 20 Toronto W02 876 $525,718,972 $600,136 $561,000 1,362 103% 17 Toronto W03 725 $284,618,911 $392,578 $385,900 1,113 100% 22 Toronto W04 828 $310,901,629 $375,485 $367,000 1,445 98% 28 Toronto W05 1,070 $365,209,512 $341,317 $362,750 1,908 98% 32 Toronto W06 1,203 $545,530,978 $453,475 $425,000 2,892 99% 31 Toronto W07 311 $213,395,031 $686,158 $635,000 457 101% 17 Toronto W08 1,549 $949,213,865 $612,791 $515,000 2,834 99% 26 Toronto W09 485 $202,722,471 $417,984 $438,000 893 99% 29 Toronto W10 863 $266,493,197 $308,799 $340,000 1,638 98% 26 Toronto Central 14,644 $9,440,072,009 $644,638 $450,000 31,721 99% 26 Toronto C01 3,843 $1,753,047,608 $456,166 $392,500 9,288 99% 28 Toronto C02 719 $714,403,382 $993,607 $790,000 1,615 99% 27 Toronto C03 517 $499,336,239 $965,834 $641,230 909 99% 21 Toronto C04 954 $1,030,101,740 $1,079,771 $1,001,000 1,831 100% 21 Toronto C06 327 $199,921,768 $611,382 $623,000 634 100% 27 Toronto C07 1,128 $646,181,070 $572,856 $427,495 2,502 99% 25 Toronto C08 1,523 $665,292,226 $436,830 $382,000 3,206 99% 26 Toronto C09 294 $367,102,497 $1,248,648 $882,500 536 98% 24 Toronto C10 673 $442,953,450 $658,177 $550,000 1,163 101% 19 Toronto C11 438 $282,399,863 $644,749 $360,000 786 100% 24 Toronto C12 384 $677,908,164 $1,765,386 $1,499,500 931 97% 33 Toronto C13 798 $454,810,185 $569,938 $446,500 1,413 101% 23 Toronto C14 1,602 $937,682,830 $585,320 $422,000 3,827 99% 26 Toronto C15 1,444 $768,930,987 $532,501 $420,000 3,080 99% 26 Toronto East 9,521 $4,122,506,465 $432,991 $412,000 16,669 100% 22 Toronto E01 871 $499,357,322 $573,315 $550,000 1,449 103% 15 Toronto E02 751 $499,967,054 $665,735 $595,000 1,243 101% 14 Toronto E03 1,050 $558,889,154 $532,275 $515,258 1,778 102% 17 Toronto E04 1,132 $394,117,531 $348,160 $375,000 1,976 99% 24 Toronto E05 974 $393,323,925 $403,823 $355,000 1,645 100% 22 Toronto E06 379 $190,453,707 $502,516 $433,000 707 100% 17 Toronto E07 914 $336,617,746 $368,291 $343,500 1,729 100% 28 Toronto E08 628 $256,403,814 $408,286 $399,950 1,132 98% 26 Toronto E09 1,227 $396,773,202 $323,369 $319,000 2,189 99% 28 Toronto E10 669 $292,741,469 $437,581 $430,000 1,132 99% 22 Toronto E11 926 $303,861,541 $328,144 $319,500 1,689 98% 25 Page 3 July 2010 Market Watch, December 2012 6
- 7. Toronto Real Estate Board DETACHED HOUSES, DECEMBER 2012 Industrial Leasing SUMMARY OF EXISTING HOME TRANSACTIONS ALL TREB AREAS Sales1 Dollar Volume1 Average Price1 Median Price1 New Listings2 Active Listings3 Avg. SP/LP 4 Avg. DOM5 TREB Total 1,745 - $1,063,887,603 - $609,678 - $518,000 - 1,921 - 6,342 - 97% - 35 - Halton Region 151 $93,937,563 $622,103 $536,000 160 683 97% 38 Burlington 21 $12,290,700 $585,271 $546,000 26 110 98% 34 Halton Hills 23 $10,920,587 $474,808 $469,000 41 138 97% 46 Milton 44 $23,770,101 $540,230 $490,000 31 140 97% 39 Oakville 63 - $46,956,175 - $745,336 - $635,000 - 62 - 295 - 97% - 35 - Peel Region 338 $192,551,347 $569,679 $510,000 486 1,432 97% 33 Brampton 192 $91,096,369 $474,460 $460,000 303 764 97% 32 Caledon 26 $16,372,490 $629,711 $577,500 29 193 96% 52 Mississauga 120 - $85,082,488 - $709,021 - $581,250 - 154 - 475 - 97% - 31 - City of Toronto 491 $354,695,096 $722,393 $562,000 453 1,301 97% 30 ! TURN PAGE FOR CITY OF TORONTO TABLES OR CLICK HERE: - - - - - - - - York Region 388 $284,081,072 $732,168 $670,500 421 1,549 96% 39 Aurora 20 $15,884,188 $794,209 $651,000 16 83 91% 63 E. Gwillimbury 11 $5,473,000 $497,545 $381,000 17 79 96% 43 Georgina 32 $10,401,500 $325,047 $295,000 40 135 97% 59 King 9 $10,635,000 $1,181,667 $818,000 19 108 92% 99 Markham 85 $65,397,399 $769,381 $718,000 81 277 96% 32 Newmarket 34 $18,204,157 $535,416 $526,250 23 98 97% 40 Richmond Hill 77 $66,626,888 $865,284 $768,888 92 293 96% 36 Vaughan 98 $77,680,940 $792,663 $688,250 107 354 97% 31 Whitchurch-Stouffville 22 - $13,778,000 - $626,273 - $527,500 - 26 - 122 - 96% - 46 - Durham Region 285 $102,849,875 $360,877 $335,000 317 907 97% 35 Ajax 46 $17,778,205 $386,483 $369,500 51 100 98% 29 Brock 7 $2,168,500 $309,786 $270,000 17 91 96% 70 Clarington 45 $15,158,450 $336,854 $307,000 58 145 97% 32 Oshawa 78 $21,457,313 $275,094 $254,500 76 187 97% 33 Pickering 27 $13,699,617 $507,393 $440,000 30 94 98% 39 Scugog 12 $4,843,500 $403,625 $339,250 8 72 94% 62 Uxbridge 10 $4,777,000 $477,700 $450,000 19 74 96% 49 Whitby 60 - $22,967,290 - $382,788 - $357,500 - 58 - 144 - 98% - 31 - Dufferin County 13 $5,643,750 $434,135 $375,000 13 65 98% 59 Orangeville 13 - $5,643,750 - $434,135 - $375,000 - 13 - 65 - 98% - 59 - Simcoe County 79 $30,128,900 $381,378 $366,000 71 405 96% 47 Adjala-Tosorontio 9 $4,039,000 $448,778 $407,000 6 56 96% 49 Bradford West Gwillimbury 24 $11,287,000 $470,292 $440,000 14 83 96% 35 Essa 6 $1,606,500 $267,750 $260,750 7 51 96% 65 Innisfil 22 $7,534,500 $342,477 $322,000 23 129 96% 51 New Tecumseth 18 $5,661,900 $314,550 $326,500 21 86 97% 50 Page 3 July 2010 Market Watch, December 2012 7
- 8. Toronto Real Estate Board DETACHED HOUSES, DECEMBER 2012 Industrial Leasing SUMMARY OF EXISTING HOME TRANSACTIONS CITY OF TORONTO MUNICIPAL BREAKDOWN Sales1 Dollar Volume1 Average Price1 Median Price1 New Listings2 Active Listings3 Avg. SP/LP 4 Avg. DOM5 TREB Total 1,745 $1,063,887,603 $609,678 $518,000 1,921 6,342 97% 35 City of Toronto Total 491 $354,695,096 $722,393 $562,000 453 1,301 97% 30 Toronto West 157 $95,341,666 $607,272 $529,900 142 361 97% 28 Toronto W01 5 $5,161,000 $1,032,200 $999,000 3 9 94% 33 Toronto W02 10 $7,438,000 $743,800 $731,000 8 28 99% 20 Toronto W03 26 $11,794,566 $453,637 $431,000 21 43 99% 24 Toronto W04 21 $9,986,500 $475,548 $443,000 17 55 97% 37 Toronto W05 6 $3,160,500 $526,750 $483,250 18 36 98% 31 Toronto W06 20 $9,990,700 $499,535 $497,500 16 40 98% 29 Toronto W07 5 $2,938,000 $587,600 $590,000 6 23 98% 27 Toronto W08 40 $32,439,400 $810,985 $680,950 20 61 98% 21 Toronto W09 10 $6,076,500 $607,650 $571,250 10 26 97% 49 Toronto W10 14 $6,356,500 $454,036 $428,250 23 40 97% 26 Toronto Central 134 $156,509,331 $1,167,980 $950,000 127 512 97% 33 Toronto C01 3 $2,566,000 $855,333 $843,000 1 8 97% 32 Toronto C02 6 $6,057,500 $1,009,583 $932,500 2 15 96% 26 Toronto C03 13 $17,457,000 $1,342,846 $737,500 12 41 95% 27 Toronto C04 22 $27,099,018 $1,231,774 $1,169,000 29 89 96% 40 Toronto C06 14 $11,511,675 $822,263 $765,338 11 32 98% 37 Toronto C07 11 $10,353,000 $941,182 $770,000 20 76 96% 31 Toronto C08 - - - - - 4 - - Toronto C09 4 $9,137,000 $2,284,250 $2,169,000 3 18 92% 16 Toronto C10 3 $3,648,000 $1,216,000 $1,140,000 1 9 98% 45 Toronto C11 6 $8,097,000 $1,349,500 $1,355,000 1 13 97% 32 Toronto C12 6 $13,973,000 $2,328,833 $2,263,500 17 81 97% 45 Toronto C13 10 $9,827,000 $982,700 $784,500 8 30 101% 24 Toronto C14 19 $23,075,088 $1,214,478 $1,090,088 11 60 96% 36 Toronto C15 17 $13,708,050 $806,356 $750,000 11 36 99% 32 Toronto East 200 $102,844,099 $514,220 $460,000 184 428 98% 30 Toronto E01 5 $2,715,000 $543,000 $419,000 6 18 103% 9 Toronto E02 13 $10,971,000 $843,923 $763,000 9 23 100% 18 Toronto E03 31 $18,599,500 $599,984 $585,000 21 54 99% 31 Toronto E04 27 $11,037,899 $408,811 $399,999 30 66 98% 18 Toronto E05 10 $5,829,800 $582,980 $534,900 8 24 97% 33 Toronto E06 14 $6,430,800 $459,343 $407,000 15 30 97% 31 Toronto E07 15 $7,369,200 $491,280 $490,000 10 29 98% 49 Toronto E08 15 $7,889,000 $525,933 $458,000 13 38 98% 28 Toronto E09 33 $13,975,500 $423,500 $416,800 23 40 97% 30 Toronto E10 20 $10,403,900 $520,195 $475,750 24 63 97% 33 Toronto E11 17 $7,622,500 $448,382 $425,000 25 43 97% 39 Page 3 July 2010 Market Watch, December 2012 8
- 9. Toronto Real Estate Board SEMI-DETACHED HOUSES, DECEMBER 2012 Industrial Leasing SUMMARY OF EXISTING HOME TRANSACTIONS ALL TREB AREAS Sales1 Dollar Volume1 Average Price1 Median Price1 New Listings2 Active Listings3 Avg. SP/LP 4 Avg. DOM5 TREB Total 371 - $165,102,468 - $445,020 - $415,000 - 373 - 713 - 98% - 27 - Halton Region 16 $6,195,100 $387,194 $391,000 17 31 99% 22 Burlington 2 $766,400 $383,200 $383,200 2 5 99% 8 Halton Hills 3 $977,000 $325,667 $334,000 2 4 98% 28 Milton 9 $3,631,700 $403,522 $396,000 10 10 99% 23 Oakville 2- $820,000 - $410,000 - $410,000 - 3- 12 - 99% - 25 - Peel Region 147 $56,692,851 $385,666 $387,000 184 322 97% 26 Brampton 80 $28,319,651 $353,996 $348,500 100 181 98% 27 Caledon - - - - - 3 - - Mississauga 67 - $28,373,200 - $423,481 - $424,800 - 84 - 138 - 97% - 24 - City of Toronto 129 $71,757,517 $556,260 $510,500 95 214 99% 25 ! TURN PAGE FOR CITY OF TORONTO TABLES OR CLICK HERE: - - - - - - - - York Region 53 $24,136,700 $455,409 $466,500 45 91 98% 36 Aurora 2 $743,500 $371,750 $371,750 3 4 97% 31 E. Gwillimbury - - - - - 2 - - Georgina 1 $240,000 $240,000 $240,000 - - 98% 10 King - - - - - - - - Markham 7 $3,450,700 $492,957 $517,000 14 21 99% 27 Newmarket 11 $4,154,500 $377,682 $385,000 3 7 97% 42 Richmond Hill 6 $2,968,500 $494,750 $499,500 2 10 97% 39 Vaughan 23 $11,388,500 $495,152 $485,000 20 39 98% 34 Whitchurch-Stouffville 3- $1,191,000 - $397,000 - $386,000 - 3- 8- 98% - 57 - Durham Region 24 $5,863,300 $244,304 $229,750 27 40 99% 25 Ajax 3 $989,000 $329,667 $333,000 7 8 99% 12 Brock - - - - - - - - Clarington 2 $451,000 $225,500 $225,500 1 2 99% 21 Oshawa 12 $2,415,900 $201,325 $197,000 14 23 98% 25 Pickering 5 $1,506,000 $301,200 $307,500 3 3 98% 37 Scugog - - - - - - - - Uxbridge - - - - - 1 - - Whitby 2- $501,400 - $250,700 - $250,700 - 2- 3- 100% - 13 - Dufferin County 2 $457,000 $228,500 $228,500 1 3 96% 36 Orangeville 2 - $457,000 - $228,500 - $228,500 - 1 - 3 - 96% - 36 - Simcoe County - - - - 4 12 - - Adjala-Tosorontio - - - - - - - - Bradford West Gwillimbury - - - - 2 3 - - Essa - - - - - 1 - - Innisfil - - - - - - - - New Tecumseth - - - - 2 8 - - Page 3 July 2010 Market Watch, December 2012 9
- 10. Toronto Real Estate Board SEMI-DETACHED HOUSES, DECEMBER 2012 Industrial Leasing SUMMARY OF EXISTING HOME TRANSACTIONS CITY OF TORONTO MUNICIPAL BREAKDOWN Sales1 Dollar Volume1 Average Price1 Median Price1 New Listings2 Active Listings3 Avg. SP/LP 4 Avg. DOM5 TREB Total 371 $165,102,468 $445,020 $415,000 373 713 98% 27 City of Toronto Total 129 $71,757,517 $556,260 $510,500 95 214 99% 25 Toronto West 34 $17,448,400 $513,188 $484,500 37 89 100% 25 Toronto W01 1 $745,000 $745,000 $745,000 2 4 99% 1 Toronto W02 10 $6,687,500 $668,750 $625,000 12 13 103% 17 Toronto W03 7 $2,959,500 $422,786 $392,500 7 22 98% 24 Toronto W04 5 $2,198,000 $439,600 $400,000 4 8 98% 43 Toronto W05 10 $4,295,400 $429,540 $386,000 8 24 98% 29 Toronto W06 1 $563,000 $563,000 $563,000 1 11 99% 5 Toronto W07 - - - - - 1 - - Toronto W08 - - - - - - - - Toronto W09 - - - - 2 2 - - Toronto W10 - - - - 1 4 - - Toronto Central 34 $24,381,299 $717,097 $587,750 27 67 98% 30 Toronto C01 7 $5,861,500 $837,357 $748,000 8 15 98% 19 Toronto C02 2 $1,072,000 $536,000 $536,000 2 10 95% 113 Toronto C03 3 $4,606,999 $1,535,666 $999,999 5 8 94% 41 Toronto C04 1 $750,000 $750,000 $750,000 - - 94% 33 Toronto C06 - - - - - 1 - - Toronto C07 4 $2,069,000 $517,250 $507,500 1 4 98% 23 Toronto C08 1 $570,000 $570,000 $570,000 1 4 102% 60 Toronto C09 - - - - - 1 - - Toronto C10 6 $4,295,500 $715,917 $708,750 4 2 106% 8 Toronto C11 - - - - - - - - Toronto C12 - - - - - - - - Toronto C13 1 $458,000 $458,000 $458,000 1 6 99% 12 Toronto C14 - - - - - - - - Toronto C15 9 $4,698,300 $522,033 $545,000 5 16 97% 31 Toronto East 61 $29,927,818 $490,620 $450,000 31 58 99% 23 Toronto E01 15 $8,234,400 $548,960 $522,500 9 18 98% 26 Toronto E02 9 $5,668,000 $629,778 $653,000 2 4 97% 23 Toronto E03 15 $7,795,250 $519,683 $525,000 10 8 103% 15 Toronto E04 5 $1,963,500 $392,700 $377,500 1 4 97% 27 Toronto E05 3 $1,329,000 $443,000 $425,000 - 3 98% 10 Toronto E06 - - - - - 1 - - Toronto E07 3 $1,248,000 $416,000 $410,000 2 6 97% 22 Toronto E08 - - - - - - - - Toronto E09 1 $332,500 $332,500 $332,500 - 1 95% 12 Toronto E10 3 $928,668 $309,556 $287,500 1 2 97% 40 Toronto E11 7 $2,428,500 $346,929 $323,000 6 11 96% 28 Page 3 July 2010 Market Watch, December 2012 10
- 11. Toronto Real Estate Board CONDOMINIUM TOWNHOUSES, DECEMBER 2012 Industrial Leasing SUMMARY OF EXISTING HOME TRANSACTIONS ALL TREB AREAS Sales1 Dollar Volume1 Average Price1 Median Price1 New Listings2 Active Listings3 Avg. SP/LP 4 Avg. DOM5 TREB Total 308 - $99,238,138 - $322,202 - $310,000 - 298 - 738 - 98% - 32 - Halton Region 14 $4,812,100 $343,721 $314,200 17 44 98% 37 Burlington 5 $2,164,300 $432,860 $390,000 3 9 99% 48 Halton Hills 3 $589,400 $196,467 $197,000 2 4 99% 44 Milton 1 $224,000 $224,000 $224,000 6 9 93% 18 Oakville 5- $1,834,400 - $366,880 - $329,900 - 6- 22 - 98% - 24 - Peel Region 111 $34,912,468 $314,527 $313,100 93 208 97% 34 Brampton 29 $7,572,400 $261,117 $242,000 29 54 98% 37 Caledon 2 $592,100 $296,050 $296,050 - - 94% 28 Mississauga 80 - $26,747,968 - $334,350 - $338,250 - 64 - 154 - 97% - 33 - City of Toronto 109 $37,716,620 $346,024 $305,000 121 321 98% 37 ! TURN PAGE FOR CITY OF TORONTO TABLES OR CLICK HERE: - - - - - - - - York Region 38 $14,355,700 $377,782 $357,750 25 89 98% 26 Aurora 4 $1,327,000 $331,750 $325,750 3 8 99% 37 E. Gwillimbury - - - - - - - - Georgina - - - - - - - - King - - - - - - - - Markham 17 $6,043,300 $355,488 $330,000 11 41 98% 27 Newmarket 1 $315,000 $315,000 $315,000 2 5 101% 12 Richmond Hill 7 $2,676,500 $382,357 $374,000 6 22 98% 23 Vaughan 9 $3,993,900 $443,767 $447,000 3 12 99% 24 Whitchurch-Stouffville - - - - - - - - - - 1- - - - - Durham Region 30 $6,159,650 $205,322 $201,750 36 69 98% 19 Ajax 4 $1,004,600 $251,150 $248,050 4 13 97% 24 Brock - - - - - 2 - - Clarington 2 $462,000 $231,000 $231,000 3 4 99% 13 Oshawa 11 $1,680,900 $152,809 $161,000 14 23 98% 23 Pickering 7 $1,852,400 $264,629 $245,000 9 17 98% 17 Scugog - - - - - - - - Uxbridge 1 $155,000 $155,000 $155,000 3 5 97% 10 Whitby 5- $1,004,750 - $200,950 - $210,000 - 3- 5- 98% - 13 - Dufferin County 5 $1,056,600 $211,320 $208,000 4 5 99% 14 Orangeville 5 - $1,056,600 - $211,320 - $208,000 - 4 - 5 - 99% - 14 - Simcoe County 1 $225,000 $225,000 $225,000 2 2 100% 15 Adjala-Tosorontio - - - - - - - - Bradford West Gwillimbury 1 $225,000 $225,000 $225,000 1 - 100% 15 Essa - - - - - - - - Innisfil - - - - - - - - New Tecumseth - - - - 1 2 - - Page 3 July 2010 Market Watch, December 2012 11
- 12. Toronto Real Estate Board CONDOMINIUM TOWNHOUSES, DECEMBER 2012 Industrial Leasing SUMMARY OF EXISTING HOME TRANSACTIONS CITY OF TORONTO MUNICIPAL BREAKDOWN Sales1 Dollar Volume1 Average Price1 Median Price1 New Listings2 Active Listings3 Avg. SP/LP 4 Avg. DOM5 TREB Total 308 $99,238,138 $322,202 $310,000 298 738 98% 32 City of Toronto Total 109 $37,716,620 $346,024 $305,000 121 321 98% 37 Toronto West 32 $10,633,100 $332,284 $308,000 34 100 97% 45 Toronto W01 - - - - 1 6 - - Toronto W02 6 $2,307,600 $384,600 $381,900 4 9 98% 15 Toronto W03 1 $250,000 $250,000 $250,000 1 7 96% 4 Toronto W04 3 $970,000 $323,333 $325,000 - 9 97% 42 Toronto W05 12 $2,810,000 $234,167 $230,500 8 27 96% 66 Toronto W06 2 $1,343,000 $671,500 $671,500 7 14 97% 38 Toronto W07 - - - - - - - - Toronto W08 4 $1,504,000 $376,000 $378,500 3 8 98% 43 Toronto W09 1 $460,000 $460,000 $460,000 2 4 100% 75 Toronto W10 3 $988,500 $329,500 $270,000 8 16 95% 32 Toronto Central 40 $17,716,080 $442,902 $394,500 36 100 98% 34 Toronto C01 8 $4,645,000 $580,625 $450,000 8 22 99% 22 Toronto C02 1 $573,000 $573,000 $573,000 1 7 115% 8 Toronto C03 - - - - - 7 - - Toronto C04 1 $619,000 $619,000 $619,000 - - 100% 52 Toronto C06 1 $479,400 $479,400 $479,400 1 2 101% 45 Toronto C07 3 $1,210,990 $403,663 $404,000 2 9 97% 70 Toronto C08 2 $766,000 $383,000 $383,000 2 8 98% 13 Toronto C09 - - - - - - - - Toronto C10 1 $315,700 $315,700 $315,700 2 3 97% 55 Toronto C11 2 $291,250 $145,625 $145,625 - 3 97% 29 Toronto C12 2 $1,910,000 $955,000 $955,000 1 4 96% 68 Toronto C13 4 $1,232,500 $308,125 $281,250 1 2 96% 41 Toronto C14 1 $406,000 $406,000 $406,000 9 20 100% 8 Toronto C15 14 $5,267,240 $376,231 $358,000 9 13 98% 29 Toronto East 37 $9,367,440 $253,174 $262,000 51 121 97% 34 Toronto E01 - - - - 4 13 - - Toronto E02 - - - - 3 5 - - Toronto E03 - - - - - 1 - - Toronto E04 8 $2,356,000 $294,500 $292,500 8 14 98% 32 Toronto E05 11 $3,369,550 $306,323 $300,000 8 16 97% 42 Toronto E06 - - - - - - - - Toronto E07 1 $317,500 $317,500 $317,500 5 11 98% 4 Toronto E08 3 $556,000 $185,333 $165,000 2 11 97% 49 Toronto E09 8 $1,555,390 $194,424 $214,750 6 16 97% 32 Toronto E10 3 $559,000 $186,333 $205,500 5 10 97% 18 Toronto E11 3 $654,000 $218,000 $224,000 10 24 98% 30 Page 3 July 2010 Market Watch, December 2012 12