May 2012 Press Release: Toronto Housing Market
•
0 j'aime•149 vues

Here are the Housing Market Charts for May 2012...

Recommandé
Contenu connexe
En vedette
En vedette (10)
Plus de Richard Silver, Certified International REALTOR®
Plus de Richard Silver, Certified International REALTOR® (20)
Dernier
Dernier (20)
May 2012 Press Release: Toronto Housing Market
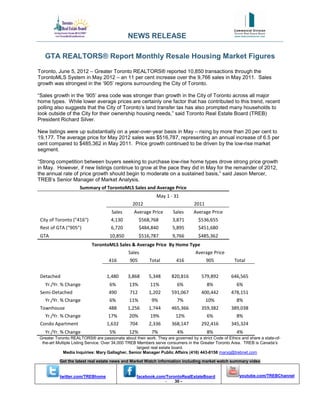
- 1. NEWS RELEASE GTA REALTORS® Report Monthly Resale Housing Market Figures Toronto, June 5, 2012 – Greater Toronto REALTORS® reported 10,850 transactions through the TorontoMLS System in May 2012 – an 11 per cent increase over the 9,766 sales in May 2011. Sales growth was strongest in the ‘905’ regions surrounding the City of Toronto. “Sales growth in the ‘905’ area code was stronger than growth in the City of Toronto across all major home types. While lower average prices are certainly one factor that has contributed to this trend, recent polling also suggests that the City of Toronto’s land transfer tax has also prompted many households to look outside of the City for their ownership housing needs,” said Toronto Real Estate Board (TREB) President Richard Silver. New listings were up substantially on a year-over-year basis in May – rising by more than 20 per cent to 19,177. The average price for May 2012 sales was $516,787, representing an annual increase of 6.5 per cent compared to $485,362 in May 2011. Price growth continued to be driven by the low-rise market segment. “Strong competition between buyers seeking to purchase low-rise home types drove strong price growth in May. However, if new listings continue to grow at the pace they did in May for the remainder of 2012, the annual rate of price growth should begin to moderate on a sustained basis,” said Jason Mercer, TREB’s Senior Manager of Market Analysis. Summary of TorontoMLS Sales and Average Price May 1 - 31 2012 2011 Sales Average Price Sales Average Price City of Toronto ("416") 4,130 $568,768 3,871 $536,655 Rest of GTA ("905") 6,720 $484,840 5,895 $451,680 GTA 10,850 $516,787 9,766 $485,362 TorontoMLS Sales & Average Price By Home Type Sales Average Price 416 905 Total 416 905 Total Detached 1,480 3,868 5,348 820,816 579,892 646,565 Yr./Yr. % Change 6% 13% 11% 6% 8% 6% Semi-Detached 490 712 1,202 591,067 400,442 478,151 Yr./Yr. % Change 6% 11% 9% 7% 10% 8% Townhouse 488 1,256 1,744 465,366 359,382 389,038 Yr./Yr. % Change 17% 20% 19% 12% 6% 8% Condo Apartment 1,632 704 2,336 368,147 292,416 345,324 Yr./Yr. % Change 5% 12% 7% 4% 8% 4% Greater Toronto REALTORS® are passionate about their work. They are governed by a strict Code of Ethics and share a state-of- the-art Multiple Listing Service. Over 34,000 TREB Members serve consumers in the Greater Toronto Area. TREB is Canada’s largest real estate board. Media Inquiries: Mary Gallagher, Senior Manager Public Affairs (416) 443-8158 maryg@trebnet.com Get the latest real estate news and Market Watch information including market watch summary video twitter.com/TREBhome facebook.com/TorontoRealEstateBoard youtube.com/TREBChannel - 30 -