Bonfire Social Media Analysis - Retail Clothing
•Télécharger en tant que PPTX, PDF•
1 j'aime•454 vues

Bonfire studied Facebook pages from three medium sized clothing brands; Threadless, Crocs and Kangol. Each one was given a ranking based upon community engagement and brand interactions.

Recommandé
Contenu connexe
Plus de Bonfire Marketing Company
Plus de Bonfire Marketing Company (20)
Dernier
Dernier (20)
Bonfire Social Media Analysis - Retail Clothing
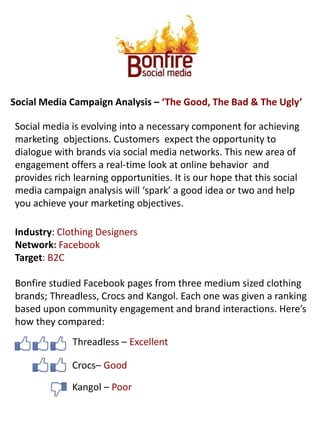
- 1. Social Media Campaign Analysis – ‘The Good, The Bad & The Ugly’ Social media is evolving into a necessary component for achieving marketing objections. Customers expect the opportunity to dialogue with brands via social media networks. This new area of engagement offers a real-time look at online behavior and provides rich learning opportunities. It is our hope that this social media campaign analysis will ‘spark’ a good idea or two and help you achieve your marketing objectives. Industry: Clothing Designers Network: Facebook Target: B2C Bonfire studied Facebook pages from three medium sized clothing brands; Threadless, Crocs and Kangol. Each one was given a ranking based upon community engagement and brand interactions. Here’s how they compared: Threadless – Excellent Crocs– Good Kangol – Poor
- 2. Facebook Page Review: Threadless Threadless– Excellent “Likers”: 150,855 Primary Uses: Updates Livestream Video Crowd sourcing old designs for reprints Marketing new product Customization: 3 tabs Moderation: 3-4 times a day The key to Threadless’s success on Facebook is they generate organic demand through genuine messaging and develop simple tabs to convert shoppers into customers. Threadless efforts produce positive ROI and measurable social media marketing correlations Shopping Tab Redirects to main website
- 3. Facebook Page Review: Threadless Crowd Sourced Tab Latent demand for old product
- 4. Facebook Page Review: Threadless Ustream App Broadcasted weekly shows
- 5. Facebook Page Review: Crocs Crocs– Good “Likers”: 110,358 Primary Uses: Updates Specials Demographic capture Community building Customization: 3 tabs with “hidden to non-Liker codes” Moderation: 1-2 times a day Crocs makes creative use of “hide codes” to increase their “Liker” count. There is a simple call to action for visitors to convert to fans and a basic reinforcement incentive once they have connected to strengthen the relationship. For improvement, Crocs should showcase product on a custom tab with comment box integration to increase interaction. Welcome Tab (where you land if you are not a Liker) Map Tab (Attempt at spreading their footprint) {no pun intended}
- 6. Facebook Page Review: Crocs Incentive Tab (where you land if you are not a Liker) Incentive Tab (where you land after becoming a Liker)
- 7. Facebook Page Review: Kangol Rainbow Sandals – Poor “Likers”: 2,918 Primary Uses: N/A Customization: None Moderation: None It looks like Kangol is either asleep at the wheel or they do not own this page. Either way, there is no activity from the moderator in any form. We assume they have no interest in marketing with Facebook. No Activity Community Contributions
- 8. What is your Facebook Page worth? Each Facebook member has an average of 130 “Friends” “Likes” show up in 3 primary places: Your page, the user’s profile and each of the 130 user’s friend’s wall. Likes also show on your business website if you have them installed. 1 ‘Like’ = an average of 134 impressions X 134 = 4,805,910 impressions
- 9. Facebook Stats 500 Million Active Members Half of all active members log in every day 5 billion pieces of content shared every day Facebook sends more traffic to news sites than Google News (Hitwise, March 2010) 41% think Facebook is a good way to get information about companies and products Almost 65 Million Facebook users “Like” things daily People that make 100k+ per year spend an average of 9 hours per week on Facebook Each Facebook “Liker” is estimated to have a $137 annual value.(email address = $42 annual value)
- 10. Bonfire Social Media Can Help Social Media Strategy Social Media Development Social Media Management Social Media Measurement Social Media Consulting & Training Search Engine Optimization Paid Search CPC Social Search CPC Ryan Lewis | Bonfire Social Media | 503.332.5604 | rlewis@bonfiresmm.com