SlideShare une entreprise Scribd logo
1  sur  10
Télécharger pour lire hors ligne
1
Charlottesville Area 1st
Quarter 2014 Highlights:
 Closed sales were unchanged compared to Q1-2013, with 492 homes sold in Q1-2014.
 The median sales price of $244,250 in Q1-2014 was up 7.4% from Q1-2013, the fourth consecutive quarter
with year-over-year price gains.
 Half of homes sold in the 1st
Quarter were on the market 76 days or less, 18 days shorter than the median
days on market (DOM) of 94 days in the same quarter last year.
 NEW MARKET MEASUREMENT! The 86 land/acreage sales in Q1-2014 mark a 26.5% rise from the 68 sales in
that market segment in Q1-2013.
©2014 RealEstate Business Intelligence, LLC. All Rights Reserved
Data Source: CAAR MLS. Statistics calculated April 4, 2014
The voice of real estate in Central Virginia
2014 1st
Quarter
Market Report
2011 Year End Market Report Market
ReportReport
CAAR Member Copy – Expanded Edition
2
1st
Quarter 2014 Sales Activity
The 492 home sales in Q1-2014 were exactly the same as the Q1-2013 tally. This is best explained by observing the
month to month closed sales. January 2014 showed 152 sales, for a 6.3% increase over the 143 sales during the same
time last year. The dip in February, 117 sales versus 129 last February (-9.3%) rebounded in March, when the 189 closed
sales represented a 9.2% increase from the 173 that posted in March 2013.
“The first quarter is historically our slowest quarter as it indicates the results of our winter market, and we all know what
a tough winter it was,” says CAAR 2014 President John Ince. “Our 2014 first quarter stats show a decline in activity from
Q4-2013 as expected, but the overall improvement by the end of March seems to indicate continued consumer
confidence in a healthy local real estate market.”
Though the number of Q1 sales remained unchanged between 2014 and 2013, the average sales price increased 20.1%,
resulting in a 20.1% in sold dollar volume (+$27.4M) to $163,570,746. This is the highest sold dollar volume posted in the
1st
Quarter since 2008. It should be highlighted that these increases are not related to appreciation, but more telling of
movement in the higher price points. The most sales in the region (195) occurred in the 3 bedroom detached segment,
where the average sold price equaled $252,775, followed by 163 sales in the 4+ bedroom detached segment which
posted a significantly higher average in $506,201.
Albemarle, the region’s most populous county, reported 203 closed sales, with only one fewer sale in Q1-2014 versus the
same period last year. Charlottesville (+23.4%) showed the biggest year-over-year sales increase, with 15 more sales than
Q1-2013. Fluvanna (+12.8%) was the other jurisdiction with a sales increase – 10 more sales than last year. Greene
(-6.4%) and Louisa (-10.9%) recorded lower sales counts, though the year-over-year changes were relatively small (-3
sales and -5 sales, respectively). Nelson (-30.2%) experienced the largest annual decrease, with 16 fewer sales.
©2014 RealEstate Business Intelligence, LLC. All Rights Reserved
Data Source: CAAR MLS. Statistics calculated April 4, 2014
Home Prices
The $244,250 median sales price in Greater Charlottesville in the 1st
Quarter of 2014 was 7.4% higher than 2013,
representing the fourth consecutive quarter with an annual gain. The Q1-2014 median sales price was the highest 1st
Quarter level since 2010, but well below the peak 1st
Quarter level of $296,862 back in 2006. The median sales price in
3
March was $250,000, representing a 9.6% increase compared to March 2013. Normal seasonal patterns suggest that
prices will rise from March to April as the spring market kicks into gear.
©2014 RealEstate Business Intelligence, LLC. All Rights Reserved
Data Source: CAAR MLS. Statistics calculated April 4, 2014
Four of the six jurisdictions had double-digit year-over-year gains in median sales price in the 1st
Quarter. Charlottesville
($280,000) and Louisa ($171,060) led the region in price gains, up 17% and 16% respectively. Nelson ($220,000) and
Albemarle ($318,000) each posted gains near 11.5%. Fluvanna ($181,200) had an 8.2% gain compared to Q1-2013. Only
Greene ($202,450) had a lower median sales price compared to last year, with a 19% annual decrease.
©2014 RealEstate Business Intelligence, LLC. All Rights Reserved
Data Source: CAAR MLS. Statistics calculated April 4, 2014
4
5
6
Days on Market (DOM) and Pricing
The median DOM for homes sold in the 1st
Quarter was 76 days, meaning that half of the sold listings were on market for
2.5 months or less. This equates to 18 fewer days than during the same period in 2013, when half the homes sold were
on market for more than 3 months (94 days).
©2014 RealEstate Business Intelligence, LLC. All Rights Reserved
Data Source: CAAR MLS. Statistics calculated April 4, 2014
Homes sold fastest, based on median DOM levels, in Charlottesville (50 days) and Louisa (54 days). Albemarle’s 73-day
median was 3 days fewer than that of the region. Greene (88 days), Nelson (92 days) and Fluvanna (122 days) each had a
higher median DOM than the region, though Nelson’s level was a 105-day improvement compared to Q1-2013, when half
the homes sold were on market for 197 days or more. Louisa’s level marked the next best improvement (-34 days).
Fluvanna’s mark represented a 13-day increase over its Q1-2013 level, the largest jump of any jurisdiction. Greene (+10
days) and Charlottesville (+2 days) also had higher median DOM levels than in the same quarter last year.
©2014 RealEstate Business Intelligence, LLC. All Rights Reserved
Data Source: CAAR MLS. Statistics calculated April 4, 2014
The average percent of original list price sellers received at sale was higher in the 1st
Quarter than Q1-2013, with the
average sales-to-original-list-price ratio up to 92.6% from 91%. This was the highest 1st
Quarter level since 2008 and was 2
points higher than the five-year 1st
Quarter average (90.6%). As the spring market brings more potential buyers to the
market, the average sales-to-original-list price ratio has increased more than 2.5 points from Q1 to Q2 in each of the last
four years. Spring sellers with homes accurately priced based on market value tend to see a larger portion of original list
price and a shorter time on market.
7
Charlottesville (94.1%), Albemarle (93.8%) and Louisa (93.1%) had a higher average sales-to-original list ratio than the
regional level. Sellers in Nelson received the lowest amount of the original asking price (87.9%), largely due to a surplus in
supply relative to demand and an average DOM of more than 174 days giving buyers the firm advantage at negotiation.
Inventory
While closed sales were unchanged from the same quarter last year, the 787 new pending sales in Greater Charlottesville
resulted in a decline of 8.1% from Q1-2013. Fluvanna (+12%) was the only county in the region with a year-over-year
increase in new pendings for the quarter. Louisa (-36.5%) had the largest year-over-year decrease in contract activity for
the quarter. While the pace of new pendings was down for the quarter for the region as a whole, it should be noted that
the 336 new pending sales in March were 5.3% more than the March 2013 total, indicating closed sales should be higher
in April 2014 than in April of last year.
New listing activity followed a similar pattern to new purchase activity over the course of the 1st
Quarter, with significant
year-over-year decreases in January (-20.5%) and
February (-25.6%) followed by an increase in March
(+13.7%) compared to last year. “This is more evidence
that the snow and cold weather contributed to slowing,
but it’s picking up now that the region has finally thawed
out,” adds CAAR 2014 President-Elect Anita Dunbar. There
were 1,281 new listings added throughout the 1st
Quarter,
10.4% fewer than were added in Q1-2013. This was the
first quarter with less listing activity than the previous
year since the 3rd
Quarter of 2012.
While there were significant annual decreases in both
buyers and seller entering the market in the 1st
Quarter,
the inventory picture heading into the spring market is
remarkably similar to this time last year. There were 2,071
active listings at quarter’s end, only 4 more than at the
end of Q1-2013. Using the average monthly sales pace over the last 12 months, that works out to 9.7 months supply of
inventory. The City of Charlottesville has a balanced housing market, with a region-low 5.8 months of supply (4-6 months
is generally considered “balanced”). With 331 active listings entering April and a 12-month average rate of 17 sales,
Nelson has the most supply relative to demand with just under 20 months of supply.
Attached vs. Detached Homes
The median sales price for attached homes (condos and townhomes) in Greater Charlottesville in the 1st
Quarter was up
19.2% from Q1 2013 to $218,750 while the median price for detached homes rose 5.0% to $256,750. Neither segment
saw much movement in terms of closed sales, with only 2 fewer attached homes sold than Q1 2013 and 2 more detached
homes sold. Attached homes tended to sell more quickly, with an average DOM of 106 days and a median DOM of 74
days. Detached homes sold in 131 days on average and had a median DOM of 78 days. Sellers of condos and townhomes
received 95.3 percent of original list price on average while detached home sellers only received 91.9% percent.
8
©2014 RealEstate Business Intelligence, LLC. All Rights Reserved
Data Source: CAAR MLS. Statistics calculated April 4, 2014
NEW: Land Sales
There were 86 land/acreage sales recorded in the 1st
Quarter, 26.5% above the 68 sales in Q1-2013. The largest plot
segment (those with more than 15 acres for sale) saw the largest gain in sold price per acre, jumping 91.3% to $11,871
from $6,206 in Q1-2013. Plots with less than 5 acres sold for $119,388 per acre, a 4.4% annual increase. Overall,
land/acreage sellers received 83.5% of original list price and their listings were on market 339 days on average. Both
indicators represented an improvement compare to Q1-2013. The average sales-to-original-list-price ratio of 83.5% was
up 7 points compared to the 76.5% level of Q1-2013.
RBI Key Housing Trend Metrics
[Greater Charlottesville Area]
All Residential Q1-14 % Q-O-Q Q4-13 % Y-O-Y Q1-13 % Y-O-2Y Q1-12 % Y-O-3Y Q1-11
Average Sales Price (Closed) $332,461 -7.9% $360,997 20.1% $276,795 18.6% $280,244 9.7% $302,993
Median Sales Price (Closed) $244,250 -10.2% $272,000 7.4% $227,500 6.2% $230,000 3.3% $236,450
Units Sold (Closed) 492 -18.1% 601 0.0% 492 6.3% 463 16.0% 424
Average DOM (Closed) 126 16.7% 108 -25.9% 170 -24.6% 167 -28.0% 175
Listing Discount (Average) 7.4% 6.5% 9.1% 10.3% 10.8%
Ratio Avg SP/Avg OLP 92.6% 93.5% 91.0% 89.7% 89.2%
Avg SP/Sq Ft 137 -6.2% 146 6.2% 129 8.7% 126 -3.5% 142
Detached Q1-14 % Q-O-Q Q4-13 % Y-O-Y Q1-13 % Y-O-2Y Q1-12 % Y-O-3Y Q1-11
Average Sales Price (Closed) $353,854 -9.5% $391,095 18.6% $298,318 16.9% $302,614 6.1% $333,497
Median Sales Price (Closed) $256,750 -11.8% $291,000 5.0% $244,500 3.9% $247,000 -3.1% $265,000
Units Sold (Closed) 390 -17.9% 475 0.5% 388 10.8% 352 23.0% 317
Average DOM (Closed) 131 19.1% 110 -20.6% 165 -21.6% 167 -22.0% 168
Listing Discount (Average) 8.1% 6.8% 9.4% 11.1% 11.2%
Ratio Avg SP/Avg OLP 91.9% 93.2% 90.6% 88.9% 88.8%
Avg SP/Sq Ft 133 -7.6% 144 4.7% 127 9.9% 121 -7.6% 144
Attached Q1-14 % Q-O-Q Q4-13 % Y-O-Y Q1-13 % Y-O-2Y Q1-12 % Y-O-3Y Q1-11
Average Sales Price (Closed) $250,665 1.3% $247,532 27.6% $196,498 19.8% $209,304 17.9% $212,621
Median Sales Price (Closed) $218,750 3.6% $211,125 19.2% $183,520 13.3% $193,000 15.7% $189,000
Units Sold (Closed) 102 -19.0% 126 -1.9% 104 -8.1% 111 -4.7% 107
Average DOM (Closed) 106 1.9% 104 -44.2% 190 -36.1% 166 -46.7% 199
Listing Discount (Average) 4.8% 5.4% 7.8% 7.5% 9.9%
Ratio Avg SP/Avg OLP 95.3% 94.6% 92.2% 92.5% 90.2%
Avg SP/Sq Ft 150 -2.0% 153 9.5% 137 6.4% 141 8.7% 138
9
©2014 RealEstate Business Intelligence, LLC. All Rights Reserved
Data Source: CAAR MLS. Statistics calculated April 4, 2014
Q1-14 % Q-O-Q Q4-13 % Y-O-Y Q1-13 % Y-O-2Y Q1-12 % Y-O-3Y Q1-11
Average Sales Price (Closed) $212,532 38.7% $153,284 49.4% $142,254 78.8% $118,845 14.7% $185,239
Median Sales Price (Closed) $90,000 5.9% $85,000 9.2% $82,450 30.9% $68,750 11.1% $81,000
Units Sold (Closed) 86 17.8% 73 26.5% 68 30.3% 66 43.3% 60
Average DOM (Closed) 339 -26.8% 463 -30.2% 486 17.7% 288 16.5% 291
Listing Discount (Average) 16.5% 21.5% 23.5% 21.5% 15.3%
Ratio Avg SP/Avg OLP 83.5% 78.5% 76.5% 78.5% 84.7%
Avg Sold Price/Acre (All) $78,095 -37.8% $125,493 2.7% $76,030 34.5% $58,055 -4.7% $81,916
Avg SP/AC: < 5 Acres (Solds this Qtr = 49) $119,388 -34.3% $181,609 4.4% $114,359 24.2% $96,123 -11.2% $134,454
Avg SP/AC: 5-15 Acres (Solds this Qtr = 12) $41,930 225.8% $12,870 29.6% $32,353 195.8% $14,177 197.8% $14,082
Avg SP/AC: > 15 Acres (Solds this Qtr = 24) $11,871 44.8% $8,196 91.3% $6,206 132.4% $5,108 55.8% $7,619
RBI Key Housing Trend Metrics - Greater Charlottesville Area
Land/Acreage Sales
10
©2014 RealEstate Business Intelligence, LLC. All Rights Reserved
Data Source: CAAR MLS. Statistics calculated April 4, 2014
©2014 RealEstate Business Intelligence, LLC. All Rights Reserved
Data Source: CAAR MLS. Statistics calculated April 4, 2014
If you plan to sell a home in 2014, be sure to have a REALTOR® prepare a comparative market analysis (CMA) so that you
can price it to sell. And, if you are looking to buy, a REALTOR® can help you understand the current market and evaluate
your options.
This 2014 1st
Quarter Market Report is produced by the Charlottesville Area Association of REALTORS®
using data from
the CAAR MLS. For more information on this report or the real estate market, pick up a copy of the CAAR Real Estate
Weekly, visit www.caar.com, or contact your REALTOR®.

Contenu connexe

Plus de Rob Alley

Construction 20120814
Construction 20120814Construction 20120814
Construction 20120814Rob Alley
 
Construction 20120810
Construction 20120810Construction 20120810
Construction 20120810Rob Alley
 
Winning with foreclosures
Winning with foreclosuresWinning with foreclosures
Winning with foreclosuresRob Alley
 
Short sale, foreclosure, reo
Short sale, foreclosure, reoShort sale, foreclosure, reo
Short sale, foreclosure, reoRob Alley
 
Distressed properties
Distressed propertiesDistressed properties
Distressed propertiesRob Alley
 
Reg Z Changes Ppt
Reg Z Changes PptReg Z Changes Ppt
Reg Z Changes PptRob Alley
 

Plus de Rob Alley (6)

Construction 20120814
Construction 20120814Construction 20120814
Construction 20120814
 
Construction 20120810
Construction 20120810Construction 20120810
Construction 20120810
 
Winning with foreclosures
Winning with foreclosuresWinning with foreclosures
Winning with foreclosures
 
Short sale, foreclosure, reo
Short sale, foreclosure, reoShort sale, foreclosure, reo
Short sale, foreclosure, reo
 
Distressed properties
Distressed propertiesDistressed properties
Distressed properties
 
Reg Z Changes Ppt
Reg Z Changes PptReg Z Changes Ppt
Reg Z Changes Ppt
 

Dernier

Call Girls In Vasant Vihar Delhi 💯Call Us 🔝8264348440🔝
Call Girls In Vasant Vihar Delhi 💯Call Us 🔝8264348440🔝Call Girls In Vasant Vihar Delhi 💯Call Us 🔝8264348440🔝
Call Girls In Vasant Vihar Delhi 💯Call Us 🔝8264348440🔝soniya singh
 
2k Shot Call girls Karol Bagh Delhi 9205541914
2k Shot Call girls Karol Bagh Delhi 92055419142k Shot Call girls Karol Bagh Delhi 9205541914
2k Shot Call girls Karol Bagh Delhi 9205541914Delhi Call girls
 
How to Build Multifamily and Laneway Suites in Toronto!! (feat. Expert Archi...
How to Build Multifamily and Laneway Suites  in Toronto!! (feat. Expert Archi...How to Build Multifamily and Laneway Suites  in Toronto!! (feat. Expert Archi...
How to Build Multifamily and Laneway Suites in Toronto!! (feat. Expert Archi...Volition Properties
 
Magarpatta Nova Elegance Mundhwa Pune E-Brochure.pdf
Magarpatta Nova Elegance Mundhwa Pune  E-Brochure.pdfMagarpatta Nova Elegance Mundhwa Pune  E-Brochure.pdf
Magarpatta Nova Elegance Mundhwa Pune E-Brochure.pdfManishSaxena95
 
FULL ENJOY - 8264348440 Call Girls in DLf Phase 4 | Gurgaon
FULL ENJOY - 8264348440 Call Girls in DLf Phase 4 | GurgaonFULL ENJOY - 8264348440 Call Girls in DLf Phase 4 | Gurgaon
FULL ENJOY - 8264348440 Call Girls in DLf Phase 4 | Gurgaonsoniya singh
 
Call Girls In Hari Nagar Dadb Block {8447779280}Hari Nagar {West Delhi Escort...
Call Girls In Hari Nagar Dadb Block {8447779280}Hari Nagar {West Delhi Escort...Call Girls In Hari Nagar Dadb Block {8447779280}Hari Nagar {West Delhi Escort...
Call Girls In Hari Nagar Dadb Block {8447779280}Hari Nagar {West Delhi Escort...asmaqueen5
 
:/Call Girls In Saidulajab Delhi ➥9990211544 High profile Riya Escorts In 24/...
:/Call Girls In Saidulajab Delhi ➥9990211544 High profile Riya Escorts In 24/...:/Call Girls In Saidulajab Delhi ➥9990211544 High profile Riya Escorts In 24/...
:/Call Girls In Saidulajab Delhi ➥9990211544 High profile Riya Escorts In 24/...lizamodels9
 
Call Girls in shastri nagar Delhi 8264348440 ✅ call girls ❤️
Call Girls in shastri nagar Delhi 8264348440 ✅ call girls ❤️Call Girls in shastri nagar Delhi 8264348440 ✅ call girls ❤️
Call Girls in shastri nagar Delhi 8264348440 ✅ call girls ❤️soniya singh
 
Listing Turkey Sylvana Istanbul - Bahcesehir
Listing Turkey Sylvana Istanbul - BahcesehirListing Turkey Sylvana Istanbul - Bahcesehir
Listing Turkey Sylvana Istanbul - BahcesehirListing Turkey
 
Kolte Patil Kharadi Pune E Brochure.pdf
Kolte Patil Kharadi Pune E  Brochure.pdfKolte Patil Kharadi Pune E  Brochure.pdf
Kolte Patil Kharadi Pune E Brochure.pdfabbu831446
 
Telibagh & Call Girls Lucknow - 450+ Call Girl Cash Payment 🎂 8923113531 🎪 Ne...
Telibagh & Call Girls Lucknow - 450+ Call Girl Cash Payment 🎂 8923113531 🎪 Ne...Telibagh & Call Girls Lucknow - 450+ Call Girl Cash Payment 🎂 8923113531 🎪 Ne...
Telibagh & Call Girls Lucknow - 450+ Call Girl Cash Payment 🎂 8923113531 🎪 Ne...gurkirankumar98700
 
Omaxe Dwarka In Delhi E Brochure Pdf
Omaxe Dwarka In Delhi E Brochure     PdfOmaxe Dwarka In Delhi E Brochure     Pdf
Omaxe Dwarka In Delhi E Brochure Pdfashiyadav24
 
Puravankara Mundhwa Pune E-Brochure.pdf
Puravankara Mundhwa Pune  E-Brochure.pdfPuravankara Mundhwa Pune  E-Brochure.pdf
Puravankara Mundhwa Pune E-Brochure.pdfManishSaxena95
 
9990771857 Call Girls in Dwarka Sector 1 Delhi (Call Girls) Delhi
9990771857 Call Girls in Dwarka Sector 1 Delhi (Call Girls) Delhi9990771857 Call Girls in Dwarka Sector 1 Delhi (Call Girls) Delhi
9990771857 Call Girls in Dwarka Sector 1 Delhi (Call Girls) Delhidelhimodel235
 
M3M 129 E Brochure Noida Expressway, Sector 129, Noida
M3M 129 E Brochure Noida Expressway, Sector 129, NoidaM3M 129 E Brochure Noida Expressway, Sector 129, Noida
M3M 129 E Brochure Noida Expressway, Sector 129, Noidasarak0han45400
 
Maha Mauka Squarefeet Brochure |Maha Mauka Squarefeet PDF Brochure|
Maha Mauka Squarefeet Brochure |Maha Mauka Squarefeet PDF Brochure|Maha Mauka Squarefeet Brochure |Maha Mauka Squarefeet PDF Brochure|
Maha Mauka Squarefeet Brochure |Maha Mauka Squarefeet PDF Brochure|AkshayJoshi575980
 
TENANT SCREENING REPORT SERVICES​ How Tenant Screening Reports Work
TENANT SCREENING REPORT SERVICES​ How Tenant Screening Reports WorkTENANT SCREENING REPORT SERVICES​ How Tenant Screening Reports Work
TENANT SCREENING REPORT SERVICES​ How Tenant Screening Reports WorkTurbo Tenant
 
3D Architectural Rendering Company by Panoram CGI
3D Architectural Rendering Company by Panoram CGI3D Architectural Rendering Company by Panoram CGI
3D Architectural Rendering Company by Panoram CGIPanoram CGI
 
Call Girls in Noida Sector 13 Noida 💯Call Us 🔝 9582086666 🔝 South Delhi Escor...
Call Girls in Noida Sector 13 Noida 💯Call Us 🔝 9582086666 🔝 South Delhi Escor...Call Girls in Noida Sector 13 Noida 💯Call Us 🔝 9582086666 🔝 South Delhi Escor...
Call Girls in Noida Sector 13 Noida 💯Call Us 🔝 9582086666 🔝 South Delhi Escor...delhimodel235
 
Call Girls in Noida Sector 12 Noida 💯Call Us 🔝 9582086666 🔝 South Delhi Escor...
Call Girls in Noida Sector 12 Noida 💯Call Us 🔝 9582086666 🔝 South Delhi Escor...Call Girls in Noida Sector 12 Noida 💯Call Us 🔝 9582086666 🔝 South Delhi Escor...
Call Girls in Noida Sector 12 Noida 💯Call Us 🔝 9582086666 🔝 South Delhi Escor...delhimodel235
 

Dernier (20)

Call Girls In Vasant Vihar Delhi 💯Call Us 🔝8264348440🔝
Call Girls In Vasant Vihar Delhi 💯Call Us 🔝8264348440🔝Call Girls In Vasant Vihar Delhi 💯Call Us 🔝8264348440🔝
Call Girls In Vasant Vihar Delhi 💯Call Us 🔝8264348440🔝
 
2k Shot Call girls Karol Bagh Delhi 9205541914
2k Shot Call girls Karol Bagh Delhi 92055419142k Shot Call girls Karol Bagh Delhi 9205541914
2k Shot Call girls Karol Bagh Delhi 9205541914
 
How to Build Multifamily and Laneway Suites in Toronto!! (feat. Expert Archi...
How to Build Multifamily and Laneway Suites  in Toronto!! (feat. Expert Archi...How to Build Multifamily and Laneway Suites  in Toronto!! (feat. Expert Archi...
How to Build Multifamily and Laneway Suites in Toronto!! (feat. Expert Archi...
 
Magarpatta Nova Elegance Mundhwa Pune E-Brochure.pdf
Magarpatta Nova Elegance Mundhwa Pune  E-Brochure.pdfMagarpatta Nova Elegance Mundhwa Pune  E-Brochure.pdf
Magarpatta Nova Elegance Mundhwa Pune E-Brochure.pdf
 
FULL ENJOY - 8264348440 Call Girls in DLf Phase 4 | Gurgaon
FULL ENJOY - 8264348440 Call Girls in DLf Phase 4 | GurgaonFULL ENJOY - 8264348440 Call Girls in DLf Phase 4 | Gurgaon
FULL ENJOY - 8264348440 Call Girls in DLf Phase 4 | Gurgaon
 
Call Girls In Hari Nagar Dadb Block {8447779280}Hari Nagar {West Delhi Escort...
Call Girls In Hari Nagar Dadb Block {8447779280}Hari Nagar {West Delhi Escort...Call Girls In Hari Nagar Dadb Block {8447779280}Hari Nagar {West Delhi Escort...
Call Girls In Hari Nagar Dadb Block {8447779280}Hari Nagar {West Delhi Escort...
 
:/Call Girls In Saidulajab Delhi ➥9990211544 High profile Riya Escorts In 24/...
:/Call Girls In Saidulajab Delhi ➥9990211544 High profile Riya Escorts In 24/...:/Call Girls In Saidulajab Delhi ➥9990211544 High profile Riya Escorts In 24/...
:/Call Girls In Saidulajab Delhi ➥9990211544 High profile Riya Escorts In 24/...
 
Call Girls in shastri nagar Delhi 8264348440 ✅ call girls ❤️
Call Girls in shastri nagar Delhi 8264348440 ✅ call girls ❤️Call Girls in shastri nagar Delhi 8264348440 ✅ call girls ❤️
Call Girls in shastri nagar Delhi 8264348440 ✅ call girls ❤️
 
Listing Turkey Sylvana Istanbul - Bahcesehir
Listing Turkey Sylvana Istanbul - BahcesehirListing Turkey Sylvana Istanbul - Bahcesehir
Listing Turkey Sylvana Istanbul - Bahcesehir
 
Kolte Patil Kharadi Pune E Brochure.pdf
Kolte Patil Kharadi Pune E  Brochure.pdfKolte Patil Kharadi Pune E  Brochure.pdf
Kolte Patil Kharadi Pune E Brochure.pdf
 
Telibagh & Call Girls Lucknow - 450+ Call Girl Cash Payment 🎂 8923113531 🎪 Ne...
Telibagh & Call Girls Lucknow - 450+ Call Girl Cash Payment 🎂 8923113531 🎪 Ne...Telibagh & Call Girls Lucknow - 450+ Call Girl Cash Payment 🎂 8923113531 🎪 Ne...
Telibagh & Call Girls Lucknow - 450+ Call Girl Cash Payment 🎂 8923113531 🎪 Ne...
 
Omaxe Dwarka In Delhi E Brochure Pdf
Omaxe Dwarka In Delhi E Brochure     PdfOmaxe Dwarka In Delhi E Brochure     Pdf
Omaxe Dwarka In Delhi E Brochure Pdf
 
Puravankara Mundhwa Pune E-Brochure.pdf
Puravankara Mundhwa Pune  E-Brochure.pdfPuravankara Mundhwa Pune  E-Brochure.pdf
Puravankara Mundhwa Pune E-Brochure.pdf
 
9990771857 Call Girls in Dwarka Sector 1 Delhi (Call Girls) Delhi
9990771857 Call Girls in Dwarka Sector 1 Delhi (Call Girls) Delhi9990771857 Call Girls in Dwarka Sector 1 Delhi (Call Girls) Delhi
9990771857 Call Girls in Dwarka Sector 1 Delhi (Call Girls) Delhi
 
M3M 129 E Brochure Noida Expressway, Sector 129, Noida
M3M 129 E Brochure Noida Expressway, Sector 129, NoidaM3M 129 E Brochure Noida Expressway, Sector 129, Noida
M3M 129 E Brochure Noida Expressway, Sector 129, Noida
 
Maha Mauka Squarefeet Brochure |Maha Mauka Squarefeet PDF Brochure|
Maha Mauka Squarefeet Brochure |Maha Mauka Squarefeet PDF Brochure|Maha Mauka Squarefeet Brochure |Maha Mauka Squarefeet PDF Brochure|
Maha Mauka Squarefeet Brochure |Maha Mauka Squarefeet PDF Brochure|
 
TENANT SCREENING REPORT SERVICES​ How Tenant Screening Reports Work
TENANT SCREENING REPORT SERVICES​ How Tenant Screening Reports WorkTENANT SCREENING REPORT SERVICES​ How Tenant Screening Reports Work
TENANT SCREENING REPORT SERVICES​ How Tenant Screening Reports Work
 
3D Architectural Rendering Company by Panoram CGI
3D Architectural Rendering Company by Panoram CGI3D Architectural Rendering Company by Panoram CGI
3D Architectural Rendering Company by Panoram CGI
 
Call Girls in Noida Sector 13 Noida 💯Call Us 🔝 9582086666 🔝 South Delhi Escor...
Call Girls in Noida Sector 13 Noida 💯Call Us 🔝 9582086666 🔝 South Delhi Escor...Call Girls in Noida Sector 13 Noida 💯Call Us 🔝 9582086666 🔝 South Delhi Escor...
Call Girls in Noida Sector 13 Noida 💯Call Us 🔝 9582086666 🔝 South Delhi Escor...
 
Call Girls in Noida Sector 12 Noida 💯Call Us 🔝 9582086666 🔝 South Delhi Escor...
Call Girls in Noida Sector 12 Noida 💯Call Us 🔝 9582086666 🔝 South Delhi Escor...Call Girls in Noida Sector 12 Noida 💯Call Us 🔝 9582086666 🔝 South Delhi Escor...
Call Girls in Noida Sector 12 Noida 💯Call Us 🔝 9582086666 🔝 South Delhi Escor...
 

Charlottesville Real Estate 2014 1st Quarter Market Report

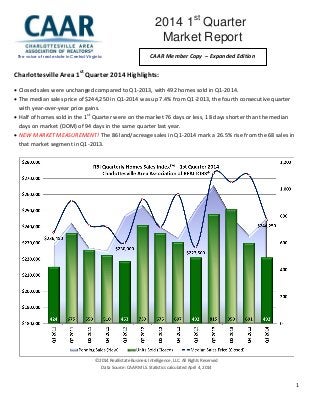
  • 1. 1 Charlottesville Area 1st Quarter 2014 Highlights:  Closed sales were unchanged compared to Q1-2013, with 492 homes sold in Q1-2014.  The median sales price of $244,250 in Q1-2014 was up 7.4% from Q1-2013, the fourth consecutive quarter with year-over-year price gains.  Half of homes sold in the 1st Quarter were on the market 76 days or less, 18 days shorter than the median days on market (DOM) of 94 days in the same quarter last year.  NEW MARKET MEASUREMENT! The 86 land/acreage sales in Q1-2014 mark a 26.5% rise from the 68 sales in that market segment in Q1-2013. ©2014 RealEstate Business Intelligence, LLC. All Rights Reserved Data Source: CAAR MLS. Statistics calculated April 4, 2014 The voice of real estate in Central Virginia 2014 1st Quarter Market Report 2011 Year End Market Report Market ReportReport CAAR Member Copy – Expanded Edition
  • 2. 2 1st Quarter 2014 Sales Activity The 492 home sales in Q1-2014 were exactly the same as the Q1-2013 tally. This is best explained by observing the month to month closed sales. January 2014 showed 152 sales, for a 6.3% increase over the 143 sales during the same time last year. The dip in February, 117 sales versus 129 last February (-9.3%) rebounded in March, when the 189 closed sales represented a 9.2% increase from the 173 that posted in March 2013. “The first quarter is historically our slowest quarter as it indicates the results of our winter market, and we all know what a tough winter it was,” says CAAR 2014 President John Ince. “Our 2014 first quarter stats show a decline in activity from Q4-2013 as expected, but the overall improvement by the end of March seems to indicate continued consumer confidence in a healthy local real estate market.” Though the number of Q1 sales remained unchanged between 2014 and 2013, the average sales price increased 20.1%, resulting in a 20.1% in sold dollar volume (+$27.4M) to $163,570,746. This is the highest sold dollar volume posted in the 1st Quarter since 2008. It should be highlighted that these increases are not related to appreciation, but more telling of movement in the higher price points. The most sales in the region (195) occurred in the 3 bedroom detached segment, where the average sold price equaled $252,775, followed by 163 sales in the 4+ bedroom detached segment which posted a significantly higher average in $506,201. Albemarle, the region’s most populous county, reported 203 closed sales, with only one fewer sale in Q1-2014 versus the same period last year. Charlottesville (+23.4%) showed the biggest year-over-year sales increase, with 15 more sales than Q1-2013. Fluvanna (+12.8%) was the other jurisdiction with a sales increase – 10 more sales than last year. Greene (-6.4%) and Louisa (-10.9%) recorded lower sales counts, though the year-over-year changes were relatively small (-3 sales and -5 sales, respectively). Nelson (-30.2%) experienced the largest annual decrease, with 16 fewer sales. ©2014 RealEstate Business Intelligence, LLC. All Rights Reserved Data Source: CAAR MLS. Statistics calculated April 4, 2014 Home Prices The $244,250 median sales price in Greater Charlottesville in the 1st Quarter of 2014 was 7.4% higher than 2013, representing the fourth consecutive quarter with an annual gain. The Q1-2014 median sales price was the highest 1st Quarter level since 2010, but well below the peak 1st Quarter level of $296,862 back in 2006. The median sales price in
  • 3. 3 March was $250,000, representing a 9.6% increase compared to March 2013. Normal seasonal patterns suggest that prices will rise from March to April as the spring market kicks into gear. ©2014 RealEstate Business Intelligence, LLC. All Rights Reserved Data Source: CAAR MLS. Statistics calculated April 4, 2014 Four of the six jurisdictions had double-digit year-over-year gains in median sales price in the 1st Quarter. Charlottesville ($280,000) and Louisa ($171,060) led the region in price gains, up 17% and 16% respectively. Nelson ($220,000) and Albemarle ($318,000) each posted gains near 11.5%. Fluvanna ($181,200) had an 8.2% gain compared to Q1-2013. Only Greene ($202,450) had a lower median sales price compared to last year, with a 19% annual decrease. ©2014 RealEstate Business Intelligence, LLC. All Rights Reserved Data Source: CAAR MLS. Statistics calculated April 4, 2014
  • 4. 4
  • 5. 5
  • 6. 6 Days on Market (DOM) and Pricing The median DOM for homes sold in the 1st Quarter was 76 days, meaning that half of the sold listings were on market for 2.5 months or less. This equates to 18 fewer days than during the same period in 2013, when half the homes sold were on market for more than 3 months (94 days). ©2014 RealEstate Business Intelligence, LLC. All Rights Reserved Data Source: CAAR MLS. Statistics calculated April 4, 2014 Homes sold fastest, based on median DOM levels, in Charlottesville (50 days) and Louisa (54 days). Albemarle’s 73-day median was 3 days fewer than that of the region. Greene (88 days), Nelson (92 days) and Fluvanna (122 days) each had a higher median DOM than the region, though Nelson’s level was a 105-day improvement compared to Q1-2013, when half the homes sold were on market for 197 days or more. Louisa’s level marked the next best improvement (-34 days). Fluvanna’s mark represented a 13-day increase over its Q1-2013 level, the largest jump of any jurisdiction. Greene (+10 days) and Charlottesville (+2 days) also had higher median DOM levels than in the same quarter last year. ©2014 RealEstate Business Intelligence, LLC. All Rights Reserved Data Source: CAAR MLS. Statistics calculated April 4, 2014 The average percent of original list price sellers received at sale was higher in the 1st Quarter than Q1-2013, with the average sales-to-original-list-price ratio up to 92.6% from 91%. This was the highest 1st Quarter level since 2008 and was 2 points higher than the five-year 1st Quarter average (90.6%). As the spring market brings more potential buyers to the market, the average sales-to-original-list price ratio has increased more than 2.5 points from Q1 to Q2 in each of the last four years. Spring sellers with homes accurately priced based on market value tend to see a larger portion of original list price and a shorter time on market.
  • 7. 7 Charlottesville (94.1%), Albemarle (93.8%) and Louisa (93.1%) had a higher average sales-to-original list ratio than the regional level. Sellers in Nelson received the lowest amount of the original asking price (87.9%), largely due to a surplus in supply relative to demand and an average DOM of more than 174 days giving buyers the firm advantage at negotiation. Inventory While closed sales were unchanged from the same quarter last year, the 787 new pending sales in Greater Charlottesville resulted in a decline of 8.1% from Q1-2013. Fluvanna (+12%) was the only county in the region with a year-over-year increase in new pendings for the quarter. Louisa (-36.5%) had the largest year-over-year decrease in contract activity for the quarter. While the pace of new pendings was down for the quarter for the region as a whole, it should be noted that the 336 new pending sales in March were 5.3% more than the March 2013 total, indicating closed sales should be higher in April 2014 than in April of last year. New listing activity followed a similar pattern to new purchase activity over the course of the 1st Quarter, with significant year-over-year decreases in January (-20.5%) and February (-25.6%) followed by an increase in March (+13.7%) compared to last year. “This is more evidence that the snow and cold weather contributed to slowing, but it’s picking up now that the region has finally thawed out,” adds CAAR 2014 President-Elect Anita Dunbar. There were 1,281 new listings added throughout the 1st Quarter, 10.4% fewer than were added in Q1-2013. This was the first quarter with less listing activity than the previous year since the 3rd Quarter of 2012. While there were significant annual decreases in both buyers and seller entering the market in the 1st Quarter, the inventory picture heading into the spring market is remarkably similar to this time last year. There were 2,071 active listings at quarter’s end, only 4 more than at the end of Q1-2013. Using the average monthly sales pace over the last 12 months, that works out to 9.7 months supply of inventory. The City of Charlottesville has a balanced housing market, with a region-low 5.8 months of supply (4-6 months is generally considered “balanced”). With 331 active listings entering April and a 12-month average rate of 17 sales, Nelson has the most supply relative to demand with just under 20 months of supply. Attached vs. Detached Homes The median sales price for attached homes (condos and townhomes) in Greater Charlottesville in the 1st Quarter was up 19.2% from Q1 2013 to $218,750 while the median price for detached homes rose 5.0% to $256,750. Neither segment saw much movement in terms of closed sales, with only 2 fewer attached homes sold than Q1 2013 and 2 more detached homes sold. Attached homes tended to sell more quickly, with an average DOM of 106 days and a median DOM of 74 days. Detached homes sold in 131 days on average and had a median DOM of 78 days. Sellers of condos and townhomes received 95.3 percent of original list price on average while detached home sellers only received 91.9% percent.
  • 8. 8 ©2014 RealEstate Business Intelligence, LLC. All Rights Reserved Data Source: CAAR MLS. Statistics calculated April 4, 2014 NEW: Land Sales There were 86 land/acreage sales recorded in the 1st Quarter, 26.5% above the 68 sales in Q1-2013. The largest plot segment (those with more than 15 acres for sale) saw the largest gain in sold price per acre, jumping 91.3% to $11,871 from $6,206 in Q1-2013. Plots with less than 5 acres sold for $119,388 per acre, a 4.4% annual increase. Overall, land/acreage sellers received 83.5% of original list price and their listings were on market 339 days on average. Both indicators represented an improvement compare to Q1-2013. The average sales-to-original-list-price ratio of 83.5% was up 7 points compared to the 76.5% level of Q1-2013. RBI Key Housing Trend Metrics [Greater Charlottesville Area] All Residential Q1-14 % Q-O-Q Q4-13 % Y-O-Y Q1-13 % Y-O-2Y Q1-12 % Y-O-3Y Q1-11 Average Sales Price (Closed) $332,461 -7.9% $360,997 20.1% $276,795 18.6% $280,244 9.7% $302,993 Median Sales Price (Closed) $244,250 -10.2% $272,000 7.4% $227,500 6.2% $230,000 3.3% $236,450 Units Sold (Closed) 492 -18.1% 601 0.0% 492 6.3% 463 16.0% 424 Average DOM (Closed) 126 16.7% 108 -25.9% 170 -24.6% 167 -28.0% 175 Listing Discount (Average) 7.4% 6.5% 9.1% 10.3% 10.8% Ratio Avg SP/Avg OLP 92.6% 93.5% 91.0% 89.7% 89.2% Avg SP/Sq Ft 137 -6.2% 146 6.2% 129 8.7% 126 -3.5% 142 Detached Q1-14 % Q-O-Q Q4-13 % Y-O-Y Q1-13 % Y-O-2Y Q1-12 % Y-O-3Y Q1-11 Average Sales Price (Closed) $353,854 -9.5% $391,095 18.6% $298,318 16.9% $302,614 6.1% $333,497 Median Sales Price (Closed) $256,750 -11.8% $291,000 5.0% $244,500 3.9% $247,000 -3.1% $265,000 Units Sold (Closed) 390 -17.9% 475 0.5% 388 10.8% 352 23.0% 317 Average DOM (Closed) 131 19.1% 110 -20.6% 165 -21.6% 167 -22.0% 168 Listing Discount (Average) 8.1% 6.8% 9.4% 11.1% 11.2% Ratio Avg SP/Avg OLP 91.9% 93.2% 90.6% 88.9% 88.8% Avg SP/Sq Ft 133 -7.6% 144 4.7% 127 9.9% 121 -7.6% 144 Attached Q1-14 % Q-O-Q Q4-13 % Y-O-Y Q1-13 % Y-O-2Y Q1-12 % Y-O-3Y Q1-11 Average Sales Price (Closed) $250,665 1.3% $247,532 27.6% $196,498 19.8% $209,304 17.9% $212,621 Median Sales Price (Closed) $218,750 3.6% $211,125 19.2% $183,520 13.3% $193,000 15.7% $189,000 Units Sold (Closed) 102 -19.0% 126 -1.9% 104 -8.1% 111 -4.7% 107 Average DOM (Closed) 106 1.9% 104 -44.2% 190 -36.1% 166 -46.7% 199 Listing Discount (Average) 4.8% 5.4% 7.8% 7.5% 9.9% Ratio Avg SP/Avg OLP 95.3% 94.6% 92.2% 92.5% 90.2% Avg SP/Sq Ft 150 -2.0% 153 9.5% 137 6.4% 141 8.7% 138
  • 9. 9 ©2014 RealEstate Business Intelligence, LLC. All Rights Reserved Data Source: CAAR MLS. Statistics calculated April 4, 2014 Q1-14 % Q-O-Q Q4-13 % Y-O-Y Q1-13 % Y-O-2Y Q1-12 % Y-O-3Y Q1-11 Average Sales Price (Closed) $212,532 38.7% $153,284 49.4% $142,254 78.8% $118,845 14.7% $185,239 Median Sales Price (Closed) $90,000 5.9% $85,000 9.2% $82,450 30.9% $68,750 11.1% $81,000 Units Sold (Closed) 86 17.8% 73 26.5% 68 30.3% 66 43.3% 60 Average DOM (Closed) 339 -26.8% 463 -30.2% 486 17.7% 288 16.5% 291 Listing Discount (Average) 16.5% 21.5% 23.5% 21.5% 15.3% Ratio Avg SP/Avg OLP 83.5% 78.5% 76.5% 78.5% 84.7% Avg Sold Price/Acre (All) $78,095 -37.8% $125,493 2.7% $76,030 34.5% $58,055 -4.7% $81,916 Avg SP/AC: < 5 Acres (Solds this Qtr = 49) $119,388 -34.3% $181,609 4.4% $114,359 24.2% $96,123 -11.2% $134,454 Avg SP/AC: 5-15 Acres (Solds this Qtr = 12) $41,930 225.8% $12,870 29.6% $32,353 195.8% $14,177 197.8% $14,082 Avg SP/AC: > 15 Acres (Solds this Qtr = 24) $11,871 44.8% $8,196 91.3% $6,206 132.4% $5,108 55.8% $7,619 RBI Key Housing Trend Metrics - Greater Charlottesville Area Land/Acreage Sales
  • 10. 10 ©2014 RealEstate Business Intelligence, LLC. All Rights Reserved Data Source: CAAR MLS. Statistics calculated April 4, 2014 ©2014 RealEstate Business Intelligence, LLC. All Rights Reserved Data Source: CAAR MLS. Statistics calculated April 4, 2014 If you plan to sell a home in 2014, be sure to have a REALTOR® prepare a comparative market analysis (CMA) so that you can price it to sell. And, if you are looking to buy, a REALTOR® can help you understand the current market and evaluate your options. This 2014 1st Quarter Market Report is produced by the Charlottesville Area Association of REALTORS® using data from the CAAR MLS. For more information on this report or the real estate market, pick up a copy of the CAAR Real Estate Weekly, visit www.caar.com, or contact your REALTOR®.