1. SUP – Semantic User Profiling
Emanuela Boroș, Alexandru-Lucian Gînscă
UAIC: Faculty of Computer Science, “Alexandru Ioan Cuza” University, Romania
{emanuela.boros, lucian.ginsca}@info.uaic.ro
Abstract. We present in this rapport a model for a user’s profile based on
multiple social network accounts and influence services. In the modeling
process we make use of well established vocabularies, but we also create our
own model especially for data regarding influence. We built a web application
with the purpose of offering an accessible interface for accessing the
knowledgebase, but also allowing the user to have his social graph semantically
modeled.
1 Introduction
Using the information given by the current social networks (Twitter and Facebook),
SUP (Semantic User Profiling) is a Web platform able to manage user profiles. A user
profile is modeled semantically, and exposed on the related standards. It also provides
means for estimating a user's reputation based on multiple criteria, using social
scoring services such as Klout and PeerIndex. The user has the satisfaction of viewing
his social graph that also can be queried using a SPARQL service. The core principles
behind this application are constructed around the visually attractive method of seeing
a user’s semantic profile. The next concerns more the functional properties of the
application. SUP extends a standard CRUD architecture into sophisticated web
application, the presentation and data model logic is properly separated (clients can
provide the user interface and servers can handle storage and application modeling
logic), the storage is handled nicely by Virtuoso triple store, end-to-end consistency in
data (JSON/JavaScript), smooth communication and interaction from client to server
and back, preserved clean encapsulated interfaces and lightweight RESTful web
services. The final result is a web application with effective user experience that
brings together the cumulative advances of modern JavaScript and web architecture
design patterns, JSON, RDF, AJAX, REST style, and thin server architecture.
2 Global Architecture
The primary purpose of this data-driven application is being able to visualize it in the
most pleasuring way it can be. A query is being passed to the application and it
2. returns a bunch of matching responses, in the order of relevance, mapped in a
standardized way. This process needs a light updater for the web page which means
asynchronous functionality, a creative way for visualizing the updates, an end-to-end
consistency in data and a lightweight CRUD style data provider. In order to obtain
this, the architecture of SUP (Semantic User Profile) has been designed following a
three-tier approach such as a light model-view-controller. The architecture combines
the different technologies coming from Javascript/JQuery/Ajax and Java worlds. The
presentation layer is Javascript-driven with Ajax for pushing information while the
business and data layers are realized through Java EE technologies. Following this
thought, the application takes the best of both worlds: the dynamic, personalized user
experience we expect of immersive Web applications and the simple, scalable
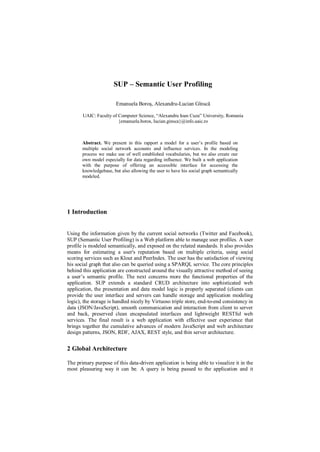
architecture we expect from RESTful applications. Here below we provide further
details about the three specific tiers.
Figure 1: SUP global architecture
3. Presentation Layer
This layer has been developed as a single web page. The parent page has the primary
purpose of satisfying the common user of the application that is looking for a creative
way of visualizing personal data and the child page regards the specialized users that
are looking for a representational state of their Sparql queries. The communication
between the two higher tiers is carried on through Ajax, with the client submitting
requests to the logic tier and receiving back JSON data representing the content of the
response, which is then parsed and used to activate proper interaction in the user
interface. The presentation implies data received from server represented in two ways:
one for the graph form of data visualization and the other one for the raw result for the
Sparql queries, which comes in xml format.
The main keywords for this tier are: Html, Css, Javascript, Ajax, Protovis,
Twitter@Anywhere, Facebook Javascript SDK.
First of all, there is an important need for maintaining a user’s profile data. More data
pushes from the server implies this simple way of distributing processing to the
clients. This fact transforms the application into a proper scalable web application.
The fact that Ajax lets the interaction with the server without a full refresh puts the
option of a stateful client back on the table. This has profound implications for the
architectural possibilities for dynamic immersive Web applications. The RESTful
services (Visualization and Sparql web services) are the data providers for the Ajax
updates. The primary type of response that we use is JSON, for its special quality of
being human readable and easy to process.
The business and functional components of the application require minimal
information from the main social networks that are used as data providers. These are
completed using Twitter@Anywhere1 and Facebook Javascript SDK2. Twitter
@Anywhere is an easy-to-deploy solution for bringing the Twitter communication
platform to a web page. It is used to build the integration with "Connect to Twitter."
The Facebook JavaScript SDK provides simple client-side functionality for accessing
Facebook's API calls. The social plugins are used in order to obtain an access token
for the communication with Facebook.
The creation and population of the graphs that are needed for visualizing the data for
every semantic profile is done with the use of Protovis. The common forms of
visualization are the social graph and the timeline. This are provided with JSON
results after the RESTful services are also provided with query-specific results (this
discussion will be continued in the next section).
1
https://dev.twitter.com/docs/anywhere/welcome
2
https://developers.facebook.com/docs/reference/javascript/
4. Business Logic Layer
The business logic of the application is implemented through a collection of Java
RESTful Web Services which are deployed on Tomcat 6 server. The services are used
for sending further Sparql queries and receiving from the Virtuoso triple store specific
responses. These are processed and made prettier for the user interface to get them.
This tier has the great property of using REST web services which are lightweight (no
complex markups) with human readable results and easy to build - no toolkits
required. We take advantage of using them for a CRUD way of getting our need data
for creating semantic profiles.
Data Layer
The data tier is mainly represented by a component for accessing and managing the
RDF/OWL model. This component queries and manages RDF triples RDF triples
with the OpenLink Software's Virtuoso3 which is a database server that can also store
(and, as part of its original specialty, serve as an efficient interface to databases of)
relational data and XML. The primary data which consists of details of users’ profiles
from different social networks and different scores of their influence in online
medium is gathered using implementations of common used social medias and social
scoring applications: Twitter, Facebook, Klout and PeerIndex.
For Klout and PeerIndex, we created our personal API’s implementations. They are
the main providers for influence scoring computing. For Twitter, we used Twitter4J4
which is a library for easily integration of the Twitter service with built-in OAuth
support and zero dependency and for Facebook, we chose RestFB5 which is a simple
and flexible Facebook Graph API and Old REST API client written in Java.
The reasoning over specific data is explained in the Data Acquisition and Influence
model sections.
3 General Model and Vocabularies
Vocabularies. Besides the rdf, rdfs, owl and our own vocabularies developed with the
purpose of modeling influence information, we mainly use the foaf and sioc
vocabularies.
3
http://docs.openlinksw.com/
4
http://twitter4j.org/en/index.html
5
http://restfb.com/
5. Table 1: Used terms sample
SIOC FOAF FOAF
sioc:user foaf:Agent foaf:birthdate
sioc:follows foaf:onlineAcount foaf:firstName
sioc:userAcount foaf:knows foaf:lastName
sioc:avatar foaf:nick foaf:homepage
sioc:creatorOf foaf:img
sioc:post foaf:mbox
In figure 2, we can see a part of the model, containing information about three users
and their friends. The visualization was done with Gravity using the RDF generated
by the Jena API.
Figure 2: Model sample with Gravity
In Figure 3, there is a visualisation of the same snippet of the model, this time with
Welkin. A node was highlighted for more information.
6. Figure 3: Model sample with Welkin
4 Data acquisition
Data acquisition regards the knowledge model of SUP. The raw data is obtained from
the main social networks APIs implementations. The data is directly imported from
the web, mainly Twitter and Facebook. For Twitter and Facebook data acquisition, we
created wrappers for the libraries used to apply to our data needs. Both of them need
the application to be registered in order to acquire consumer keys, and consumer
secrets in advance.
The Twitter API6 consists of three parts: two REST APIs and a Streaming API. The
Twitter REST API is the core API set, it allows developers to access core Twitter
data, it contains most of the methods and functions that would be used to utilize
Twitter data in an application, and it supports three formats (or endpoints) for each
method: XML, Atom, and JSON formats. This includes update timelines, status data,
and user information. The Search API methods give developers methods to interact
with Twitter Search and trends data. The main concern for us is the effects on rate
limiting and output format which can become easily an important issue of using this
API. We use a Java library recognized by Twitter for a simple implementation of the
REST Twitter API, Twitter4J. The data extracted with the library is mainly consisted
by user personal information, details about friends and followers and latest tweets.
Basically, the methods that Twitter offer resources have this pattern:
Resource URL: https://api.twitter.com/1/users/show.json
6
https://dev.twitter.com/docs
7. GET followers/ids Returns an array of numeric IDs for every user following the
specified user. This method is powerful when used in conjunction with users/lookup.
GET friends/ids Returns an array of numeric IDs for every user the specified user is
following. This method is powerful when used in conjunction with users/lookup.
GET users/show Returns extended information of a given user, specified by ID or
screen name as per the required id parameter. The author's most recent status will be
returned inline. Users follow their interests on Twitter through both one-way and
mutual following relationships.
The responses we are aiming for have the JSON structure:
{
"profile_image_url":
"http://a3.twimg.com/profile_images/689684365/api_normal.png",
"location": "San Francisco, CA",
"follow_request_sent": false,
"id_str": "6253282",
"profile_link_color": "0000ff",
"is_translator": false,
"contributors_enabled": true,
"url": "http://dev.twitter.com",
"favourites_count": 15,
"id ": 6253282
}
Facebook Graph API7 presents a simple, consistent view of the Facebook social
graph, uniformly representing objects in the graph (e.g., people, photos, events, and
pages) and the connections between them (e.g., friend relationships, shared content,
and photo tags). For Facebook data acquisition, we use RestFB java library. RestFB
already maps objects to Json so the data is received in this format:
{
"id": "220439",
"name": "Facebook User",
"first_name": "Facebook",
"last_name": "User",
"link": "https://www.facebook.com/facebook.user",
"username": "facebook.user",
"gender": "male",
"locale": "en_US"
}
For proper usage of this library, we created a wrapper with already built-in Facebook
Graph specific queries. This way, we minimized the effort of repeatedly creating
different queries. Finally, Facebook offers us personal data, extended details for
friends and personal feed.
7
https://developers.facebook.com/docs/reference/api/
8. The process of data acquisition combined with social scores is explained in the figure
below.
Figure 4: Data acquisition workflow
5 Influence model
We are interested in discovering features related to a user’s influence on a certain
social network, the influence of his friend and creating a model using RDFS and
OWL for these influence components. We use two services that are known for their
work in social network influence analysis, Klout8 and PeerIndex9.
Klout. We included in our model, besides the Klout score, other influence related
concepts that Klout offers. Next, we present the four influence scores that Klout
provides. Most of the descriptions were taken from the Klout’s website and serve the
purpose of giving a better understanding of the different notions regarding influence
thar are being introduced in the model.
8
http://klout.com/
9
http://www.peerindex.com/
9. Klout Score: The Klout Score is the measurement of the user’s overall online
influence. The score ranges from 1 to 100 with higher scores representing a wider and
stronger sphere of influence.
Amplification Probability: Klout describes the Amplification Probability as: "the
likelihood that your content will be acted upon. The ability to create content that
compels others to respond and high-velocity content that spreads into networks
beyond your own is a key component of influence."
Network: The network effect that an author has and it is a measure of the influence of
the people the author is reaching. Klout describes it as "the influence level of your
engaged audience."
True Reach: The True Reach score from Klout measures how many people an author
influences.
In Figure 5, a snippet from the RDF/XML file describing the Klout score is shown.
Figure 5: Klout score in RDF
Next, we will present some of the 17 klout classes. In our model, the klout class
concept is defined using the owl:oneOf construct and enumerating the instances.
Broadcaster: The user broadcasts appreciated content that spreads fast. He is an
essential information source in his industry. He has a large and diverse audience.
Celebrity: The user reached a maximum point of audience. People share his content
in great numbers. He is probably famous in real life and has numerous fans.
Curator: The user highlights the most interesting people and finds the best content on
the web and share it to a wide audience. He is a critical information source.
Feeder: The user’s audience relies on him for a steady flow of information about his
industry or topic.
Observer: He doesn’t share very much, but follows the social web. He prefers to
observe more than sharing.
Klout also offers lists of maximum five influencers and one of maximum five
influences. We caught this aspect in the isInfluencedBy and influences relations, as
seen in Figure 6.
10. Figure 6: Klout influence relations in RDF
PeerIndex. Although PeerIndex relies on fewer data sources than Klout, we desired
to have an alternative to the klout score. Next, we will present descriptions of the four
influence scores, as given by PeerIndex.
PeerIndex score: A user’s overall PeerIndex score is a relative measure of his online
authority. The PeerIndex Score reflects the impact of his online activities, and the
extent to which he has built up social and reputational capital on the web.
In Figure 7, a snippet from the RDF/XML file describing the PeerIndex score is
shown.
Figure 7: PeerIndex score in RDF
Authority Score: Authority is the measure of trust calculating how much others rely
on the user’s recommendations and opinion in general and on particular topics.
PeerIndex calculates the authority in eight benchmark topics for every profile. These
are used to generate the overall Authority Score as well as produce the PeerIndex
Footprint diagram. The Authority Score is a relative positioning against everyone else
in each benchmark topic. The rank is a normalized measure against all the other
authorities in the topic area.
Audience Score: The Audience Score is a normalized indication of the user’s reach
taking into account the relative size of his audience to the size of the audiences of
11. others. In calculating his Audience Score, PeerIndex does not simply use the number
of people who follow him, but instead generate from the number of people who are
impacted by his actions and are receptive to what he is saying. If the user is a person
who has an "audience" consisting of a large number of spam accounts, bots, or
inactive accounts, his Audience Score will reflect this.
Activity Score: Your Activity Score is the measure of how much the user does that is
related to the topic communities he is part of. By being too active, his topic
community members tend to get fatigued and may stop engaging with him. The
Activity Score takes into account this behavior. Like the other scores, Activity Score
is calculated relative to the user’s communities. If he is part of a community that has a
large amount of activity, his level of activity and engagement will need to be higher to
achieve the same relative score as in a topic that has less activity.
In Figure 8, we see a visualization of the model with Welkin.10
Figure 8: Influence model visualized with Welkin
6 Topic Semantic Similarity
A user has associated different topics drawn from multiple sources which give an
overview image of his mostly discussed concepts or his interests. In our current
implementation, topics are gathered from the Klout and PeerIndex services. While
PeerIndex returns a straight-forward list of topics for a certain user, Klout has a
particular understanding of the concept of ―topic‖. Next, we will present Klout’s
method of finding topics.
10
http://simile.mit.edu/welkin/
12. Klout topics are gathered from the Twitter stream and in some cases they seem to
have nothing to do with what the tweets about. Klout looks for specific keywords/ in
the user’s tweets that received a certain amount of attention, such as numerous replies
to the user’s tweet or retweets of that tweet. If the user replies to someone’s tweet and
the response generated lots of interest, then Klout will look back to the original tweet
for keywords. Once the keywords that draw influence are obtained, Klout uses a
dictionary to identify relevant terms. More details regarding this dictionary and how
the terms are correlated seem not to be available for public disclosure. Klout then
compares the user’s influence on these terms to see if you he is generating significant
influence within their network. If Klout determines if a user has influence on a
specific term, that term will appear on his list of topics. For a better understanding of
this process, we give a small example. If a user has at least 10 tweets about cats each
day, but no one every replies on those, the term ―cat‖ will not appear on his topic list,
but if a user publishes a tweet about ―war‖ and this tweet generates tens of replies and
gets retweeted a lot of times, then it is most likely that the term ―war‖ will be found in
his list of topics.
For computing the semantic similarity between two terms, we use three WordNet
semantic similarity algorithms, Wu and Palmer, Resnik and Lin. Next, we give more
details about these measures and present results computed on 5 Klout topics extracted
from our knowledgebase.
Wu and Palmer measure. The Wu & Palmer measure [3] calculates semantic
similarity by considering the depths of the two synsets in the WordNet taxonomies,
along with the depth of the least common subsumer. The formula is as follows:
s1: the synset of the first term;
s2: the synset of the second term;
lcs(s1, s2): the synset of the least common subsumer.
This means that 0 < <= 1. The score can never be zero because the
depth of the least common subsumer is never zero. The depth of the root of a
taxonomy is one. The score is one if the two input synsets are the same.
Table 2: Wu and Palmer
Terms internet design web education philosophy
internet 1.0 0.631 0.909 0.222 0.21
Design 0.631 1.0 0.75 0.8 0.75
Web 0.909 0.75 1.0 0.461 0.428
education 0.222 0.8 0.8 1.0 0.8
philosophy 0.21 0.75 0.428 0.8 1.0
13. Resnik measure. This measure also relies on the idea of a least common subsumer
(LCS), the most specific concept that is a shared ancestor of the two concepts. [4]
The Resnik [1] measure simply uses the Information Content of the LCS as the
similarity value:
lcs(t1,ts2): the least common subsumer.
freq(t): the freaquecy of term t in a corpus;
maxFreq: the maximum frequency of a term from the same corpus.
The Resnik measure is considered somewhat coarse, since many different pairs of
concepts may share the same LCS. However, it is less likely to suffer from zero
counts (and resulting undefined values) since in general the LCS of two concepts will
not be a very specific concept.
Table 3: Resnik
terms internet design web education philosophy
internet 10.37 0.631 10.37 0.0 0.0
design 2.49 11.76 2.49 3.39 3.39
web 10.37 2.49 11.76 2.87 0.77
education 0.0 3.39 2.87 10.66 3.39
philosophy 0.0 3.39 0.77 3.39 11.76
Lin measure. The Lin measure [2] augments the information content of the LCS with
the sum of the information content of concepts A and B themselves. The lin measure
scales the information content of the LCS by this sum.
14. Table 4: Lin
terms internet design web education philosophy
internet 1.0 0.28 0.32 0.0 0.0
design 0.28 1.0 27 0.46 0.48
web 0.32 0.27 1.0 0.09 0.09
education 0.0 0.46 0.09 1.0 0.46
philosophy 0.0 0.48 0.09 0.46 1.0
Topic set similarity. For computing the semantic similarity between the topics of
interest of two users using one of the three measures described above, we first
generate the stem of each term, using an open source implementation of the Porter
Stemmer. The final similarity score is obtained using a weighted average over the
maximum score obtained by applying a semantic similarity measure on each
combination of a term from the first user’s topics set and one from the second user’s
topic set.
T1: first user’s topics set;
T2: second user’s topics set;
sim(t1, t2): one of the Wu and Palmer, Resnik or Lin similarity measures.
7 Visualization
We mentioned Protovis11 usage in order to create the graphics for visualizing a
semantic profile. Protovis is a great tool that draws images in the Scalable Vector
Graphic format (SVG) which every modern and mobile browser, including IE 9, can
render it. We used two types of graphs: a force-directed graph and a timeline. In the
case of the force-directed graph, an intuitive approach to network layout is to model
the graph as a physical system: nodes are charged particles that repel each other, and
links are dampened springs that pull related nodes together. A physical simulation of
these forces then determines node positions; approximation techniques that avoid
computing all pair wise forces enable the layout of large numbers of nodes. In
addition, interactivity allows the user to direct the layout and jiggle nodes to
disambiguate links. A structure of this type graph has been developed for representing
friendship scoring between a user and his friends.
11
http://mbostock.github.com/protovis/docs/
15. Figure 9: Graph
The timeline represents a common way of showing a user’s activity in time. Screen
shots below.
Figure 10: Timeline
16. Figure 11: Sparql Endpoint
8 Use Cases
We distinguish two main types of use cases. One involving an inexperienced user that
just wants to find information about his social graphs or about his friends’ graphs and
another one, where an user with Sparql knowledge can write his own queries and
visualize the results in table form, or select one of the predefined queries that generate
interactive graphs and modify the queries.
9 Conclusion
Semantic modeling deserves necessary involvement from out team and it is important
to continue investigating new means for influence computation more accurately. A
larger collection of triples would be needed, along with a more complex semantic
model. Future work includes completing SUP with a semantic similarity
computation between users’ topics. The module has been implemented using
WordNet based semantic similarity algorithms but not yet included in the
main workflow. In conclusion, we will focus on improving the semantic model and
furthermore exploring new ways of proper visualizing data.
17. References
1. Philip Resnik. 1995. Using information content to evaluate semantic similarity. In
Proceedings of the 14th International Joint Confer
2. D. Lin. 1998. An information-theoretic definition of similarity. In Proceedings of the
International Conference on Machine Learning, Madison, August.
3. Wu and M. Palmer. 1994. Verb semantics and lexical selection. In 32nd Annual Meeting of
the Association for Computational Linguistics, pages 133–138, Las Cruces, New Mexico
4. Pedersen, Ted, Siddharth Patwardhan, and Jason Michelizzi. 2004. Wordnet::similarity —
measuring the relatedness of concepts. In Proceedings of the Nineteenth National
Conference on Artificial Intelligence (AAAI-04). AAAI Press, Cambridge, MA, pages
1024–1025