A Critique of the Proposed National Education Policy Reform
Scientific Investigations
1. LESSON 4 - SCIENTIFIC
INVESTIGATIONS
Hypothesis
When physicists observe a particular physical
phenomenon they will as questions as to how
A general statement about the relationship
or why it happens . A hypothesis will be put
between a manipulated variable and a
forth and experiments or scientific
responding variable.
investigations will be carried out to prove or
disprove the hypothesis. If the experiments
The hypothesis should be written as :
bear out the hypothesis, the hypothesis may
The greater the………, the greater the…….
come to regarded as theory or law of nature. If
Or
the don’t the hypothesis will be rejected or
The bigger the…………., the smaller the…..
modified.
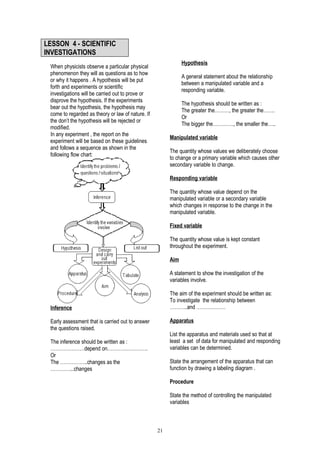
In any experiment , the report on the
Manipulated variable
experiment will be based on these guidelines
and follows a sequence as shown in the
The quantity whose values we deliberately choose
following flow chart:
to change or a primary variable which causes other
secondary variable to change.
Responding variable
The quantity whose value depend on the
manipulated variable or a secondary variable
which changes in response to the change in the
manipulated variable.
Fixed variable
The quantity whose value is kept constant
throughout the experiment.
Aim
A statement to show the investigation of the
variables involve.
The aim of the experiment should be written as:
To investigate the relationship between
………..and ………………
Inference
Apparatus
Early assessment that is carried out to answer
the questions raised.
List the apparatus and materials used so that at
least a set of data for manipulated and responding
The inference should be written as :
variables can be determined.
…………………depend on…………………….
Or
State the arrangement of the apparatus that can
The ……………..changes as the
function by drawing a labeling diagram .
…………...changes
Procedure
State the method of controlling the manipulated
variables
21
2. State the method of measuring the responding
variables
Repeat the experiments at least four times. If the data too small or too big use the standard
form number.
Tabulating the data
For example
Record the data in the following table Temperature θ /oC 10 20 30 40 50
Density, ρ / kg m-3 9.7 8.5 7.3 6.6 5.1
Manipulated variable Responding variable x 104
How to plot the graph ?
The title of the graph must be shown.
The axes of the graph must be labeled with the unit
used.
For example:
Analyzing the data
Plot a graph of ( Responding variable) against
(Manipulated variable)
How to tabulate the data ?
The scale chosen must be easy to use.
The table must be neatly drawn and the data
Scales such 1:1 , 1:2 , 1:5 ,1:10 ,1:100 are
arranged in either and rows.
proffered in plotting a graph.
The names and symbols of the manipulated and
Odd scales such as 1:3 , 1:4 , 1: 6 , 1:7 , 1: 30
responding variables must be written together with
should be avoided in plotting a graph.
the units.
For example,
Make sure the area covered by the plotted points
must not be less than 50% of the area of the graph
Velocity, v / s
paper.
Time , t / s
For example:
Volume , V / m3 Pressure , P / Pa
The data shown in the table must be consistent in
The scale on the axes must be uniform and clearly
the number of decimal places in accordance with
marked with value.
the respective measuring instruments.
For example:
For example,
Length, l / cm Time , t /s
0 12.8
2 25.6
4 39.4
6 52.2
8 75.0
22
3. or y α x
All the points are marked with a symbol such as a
cross or circle and the centre of the cross must or y = kx k = constant
accurately positioned. or y = mx m = gradient
or y1 = y2
x1 x2
The best straight line or the best curve graph must
be drawn.
The best straight line or the best curve graph is the
line that passes through most of the points plotted
such that it is balanced by the number of points
above and below the line. The line also must
smooth.
y increases linearly with x
or y = mx + c
m = gradient
c = intercept on axis-y
y decreases linearly with x
or y = -mx + c
m = gradient
c = intercept on axis-y
It is not advisable to plot graph by joining point to
point because the graph obtained is not smooth.
y is inversely proportional to x
or y α 1
x
or y = k
x
k = constant
or y1 x1 = y2 x2
How to analyze the data ?
(a) Determine the relationship between two
variables.
Example :
y is directly proportional to x. (b) Determine the gradient of the graph
23
4. Example
Draw a sufficiently large triangle to calculate
the gradient of the graph.
State value of the gradient with correct unit.
The gradient of the graph is
m = y2 - y1
x2 - x1
= QR
QR
(c) Determine the certain values from the graph.
Certain important values can be obtained from
the graph plotted by drawing a horizontal line
or by extrapolating the graph.
(d) State the precautions should be taken
For example:
The circuit connections must be taken
Off the switch when taking the reading of the
meters.
Make sure the amplitude of oscillation is small.
24
5. TUTORIAL 4 4 Which of the following graphs show that y
increases linearly with x?
1 Which of the following is the best way to
tabulate the data ?
A Voltage,V 0 5 10 15 20
Current,I 0 1.7 2.5 3.4 4.2
B Time,t /s 2 4 6 8 10
2000 5000 8000 11000 14000
Density,ρ /
kgm-3 5 Hooke’s law states that applied force F is
directly proportional to the extension x of
spring if its elastic limit is not exceeded. Which
C Period, T 10.5 15.3 19.8 27.9 36.0
of the following graphs shows the Hooke’s
/s
Law?
Distance, d 2.5 3.3 4.6 5.8 6.9
/m
D Object 5.1 8.7 11.6 16.5 18.6
distance
,u / cm
Image 2.3 5 6.9 9 11.6
distance,
v / cm
2 Which of the following scales is the most
suitable to plot a graph?
6 The acceleration, a of an object is inversely
proportional to the mass, m of the object
A B
1 cm : 3 unit 1 cm : 5 unit
under constant force.
C D
1 cm : 6 unit 1 cm : 8.8 unit
Which of the following graphs describes the
relationship between a and m .
3 Which of the following is the best graph ?
25
6. 7 12
An experiment is carried out to find the The resistance R and temperature T for an
electric conductor is given as R = r + aT with
relationship between mass and acceleration of
a trolley on a wooden runway. r as the resistance at 0oC and a as a
The experiment is repeated by adding the constant.
number of trolleys. A graph of R against T is shown .
The responding variable in this experiment is
A the length of the wooden runway.
B acceleration
C mass
What is the resistance ,R of the conductor at a
8 In a simple pendulum experiment, the length
temperature 60oC ?
of the pendulum and time for 20 oscillations
are recorded.
A B
35 47
The length of the pendulum is a
C D
86 93
E 180
A manipulated variable
B responding variable
13
C fixed variable
9 Based on the graph above, what is the
gradient of the graph?
The equation of the graph above is
A B
- 1.5 - 0.7
A B
P = 10Q + 5 P = 2Q + 10
C D
0.7 1.0
C D
P = -2Q + 10 P = 5Q – 10
E 1.5
14 The following figure shows a graph U versus
V.
10 What is the unit of the gradient of the graph
above?
A B
m m2 s
C D
ms2 ms- 2
Which of the following shows the correct
11 A student plot a graph for a physical quantity , relationship between U and V?
Q on axis-y against a physical quantity ,R on
axis –x A U=mV +m
The relationship between Q and R is given by n
as Q - aR = b , where a and b are constants.
The gradient of the graph is B U=-mV +m
n
Aa B R C U=mV + n
b Q n
C D
b a D U=-nV +m
m
26
7. 15 The pressure ,P of the gas is directly 9
proportional to the absolute temperature, T of
the gas.
When P = 100 ,T = 50. What is the value of P
19
when T = 400. A student carries out an experiment to find
out the relationship between the change in
A B
0.8A 125 length , y , of a spring and mass, m , of the
C D
200 800 load on the spring. The arrangement of the
E 2000 apparatus for the experiment is shown in
Figure 1 . The length of the spring when a
16 Boyle’ s law state that the pressure of the gas load is placed on the piston is l .
is inversely proportional to the volume of the
gas.
The pressure of a bubble under sea surface is
120 cm Hg Pa and its volume is 15.8 cm3.
When the bubble rises to the surface of the
sea the pressure of the bubble is 76 cm Hg.
What is the volume of the bubble at the
surface of the sea?
A B
10.0 cm3 25.0 cm3
C D
124.8 cm3 309.1 cm3
E 577.2 cm3
17 An object is released from a height , h and
the time taken to reach the ground is t.2
h/m 20 x
t/s 2 4
If h is directly proportional to t 2 , what is the
value of x in the table above.
At the beginning of the experiment there is no
A B
10 m 40 m load. The length of the spring is lo . The actual
C D
80 m 160 m length of lo is shown in Figure 2.
E 240 m The experiment is repeated by using load with
mass , m , equal to 0.5 kg , 1.0 kg , 1.5 kg ,
18 Newton’s universal law of gravitation states 2.0 kg and 2.5 kg. The actual lengths of the
that the gravitational force of attraction, F spring when the different masses are used are
between two point masses is inversely shown in Figure 3, Figure 4 , Figure 5 ,
proportional to the square of the distance ,R Figure 6 and Figure 7.
between them.
If the distance between them is 3R, what is
the gravitational force of attraction ?
A 9F B 3F
CF DF
3
EF
27
9. Tabulate your results for m ,l and y in the
space below.
(a) Based on the aim and the procedure of
the experiment state the:
(i) manipulated variable
________________________________
(ii) responding variable
_________________________________
(iii) constant variable
________________________________ (c) On the graph paper , plot a graph of y
against m.
(b) Measure the length of the spring in
Figure 2. (d) Based on your graph, state the
lo = ___________________ relationship between y and m .
Measure the lengths l of the spring in _________________________________
Figure 3 , Figure 4 , Figure 5 , Figure 6
_________________________________
and Figure 7 when different load are
used.
In each case, calculate the change in
length, y , of the spring where;
y = ( lo – l )
29
11. Graph T2 against l
T2 / s2
5
4
3
2
1
l / cm
0 20 40 60 80 100
31
l/cm
12. ………………………………………………
20 A student carries out an experiment to
investigate the relationship between the
length of a simple oscillating pendulum ,l ,
with its period, T.
The experiment is repeated using different
lengths, l, and their corresponding periods,
T, are recorded. A graph of T2 against l , is
then plotted as shown above.
(a) Based on the graph,
(i) State the relationship between T2
with l.
…………………………………………..
…………………………………………..
(ii) Calculate period, T, when the
length
l = 45 cm.
(Show your working)
21 The graph above represents graph W
against V , where W and V are the distances
on a wooden rod.
(a) Based on the graph state the:
(i) manipulated variable
(iii) Calculate the gradient of the
graph.
________________________________
(ii) responding variable
_________________________________
(b) Using the value of the gradient obtained
(b) Calculate the gradient of the graph.
from (a)(iii) and the equation,
calculate the acceleration due to
gravity , g.
(c) Determine the intercept on
(i) axis- W
....................................................
axis-V
(ii)
State one precaution for this experiment.
(c)
.....................................................
………………………………………………
(d) State the equation of the line
32
13. ...............................................................
22 Pak Ali has a pendulum clock as shown in the
diagram below.
Every day it was observed that the clock was
slow about 2 minutes.
Pak Ali raised the position of the bob to
correct the clock.
Based on the observations:
(a) State one suitable inference that can be
made.
(b) State one appropriate hypothesis for an
investigation.
(c) With the use of apparatus such as
pendulum bob , string and other
apparatus, describe an experimental
framework to test your hypothesis.
In your description, state clearly the
following:
(i) Aim of the experiment
(ii) Variables in the experiment
(iii) List of apparatus and materials
(iv) Arrangement of the apparatus
(v) The procedure of the experiment
which include the method of
controlling the manipulated variable
and the method of measuring the
responding variable
(vi) Way you would tabulate the data
(vii) Way you would analysis the data
33