Texas Economic Charts - Nov 2009
•
1 j'aime•469 vues

This document provides Texas Economy Data via the Dallas Fed ending November 2009.

Recommandé
Recommandé
Contenu connexe
En vedette
Plus de Bob Lowery
Plus de Bob Lowery (20)
Dernier
Dernier (20)
Texas Economic Charts - Nov 2009
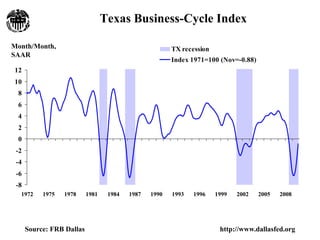
- 1. Texas Business-Cycle Index Month/Month, TX recession SAAR Index 1971=100 (Nov=-0.88) 12 10 8 6 4 2 0 -2 -4 -6 -8 1972 1975 1978 1981 1984 1987 1990 1993 1996 1999 2002 2005 2008 Source: FRB Dallas http://www.dallasfed.org
- 2. Change in Texas Leading Index Net Contributions of Components 3-month change: August - September - October Net Change in Texas Leading Index 0.84 Texas Value of the Dollar 0.62 U.S. Leading Index 0.52 Real Oil Price 0.41 Well Permits 0.02 New Unemployment Claims 0.1 Texas Stock Index 0.13 Help Wanted Index -1.04 Average Weekly Hours 0.09 -2 -1 0 1 2 Percent Source: FRB Dallas http://www.dallasfed.org
- 3. Texas Total Nonfarm Employment Quarterly Growth 1-quarter % change, SAAR Texas (Q3=-2.69) 6 U.S. (Q3=-1.8) 4 2 0 -2 -4 -6 -8 1991 1994 1997 2000 2003 2006 2009 Source: BLS/TWC, seasonal and other adjustments by FRB Dallas http://www.dallasfed.org
- 4. Texas Total Nonfarm Employment Monthly Growth 1-month % change, SAAR Texas (Nov=0.54) 8 U.S. (Nov=-0.1) 6 4 2 0 -2 -4 -6 -8 2001 2002 2003 2004 2005 2006 2007 2008 2009 Source: BLS/TWC, seasonal and other adjustments by FRB Dallas http://www.dallasfed.org
- 5. Texas Industry Employment NAICS Super Sectors Monthly Growth. SA by FRB Dallas December 2008 - November 2009 1-month % change, Natural Resources & Mining (Nov=15.77) Construction (Nov=-7.05) SAAR Trade, Transp & Utilities (Nov=-3.2) Manufacturing (Nov=-7.06) Professional & Business Svc (Nov=0.1) Financial Activities (Nov=5.1) 30 Leisure & Hospitality (Nov=4.82) Information (Nov=-13.82) Educational & Health Services (Nov=4.68) Government (Nov=2.38) 20 10 0 -10 -20 -30 -40 Source: BLS/TWC, seasonal and other adjustments by FRB Dallas http://www.dallasfed.org
- 6. Texas High Tech Manufacturing Employment (Change in Employment) Thousands, SA Change in Employment (Nov=0.2) 4 3 2 1 0 -1 -2 -3 -4 -5 1993 1994 1995 1996 1997 1998 1999 2000 2001 2002 2003 2004 2005 2006 2007 2008 2009 Source: BLS/TWC, seasonal and other adjustments by FRB Dallas http://www.dallasfed.org
- 7. Texas High Tech Manufacturing Employment Index, Jan 1990=100 Semiconductor & Oth. Electronic Components (Nov=108.5) Computers and Peripheral Equipment (Nov=62.5) 230 Communications Equipment (Nov=37.6) 210 190 170 150 130 110 90 70 50 30 1990 1991 1992 1993 1994 1995 1996 1997 1998 1999 2000 2001 2002 2003 2004 2005 2006 2007 2008 2009 Source: BLS/TWC, seasonal and other adjustments by FRB Dallas http://www.dallasfed.org
- 8. Texas High Tech Services Employment Index, Jan 1990=100 Telecommunications (Nov=129.7) ISPs, search portals, and data processing * (Nov=97.7) 600 Computer system design and related services (Nov=521.8) 500 400 300 200 100 0 1990 1991 1992 1993 1994 1995 1996 1997 1998 1999 2000 2001 2002 2003 2004 2005 2006 2007 2008 2009 * The January 2007 drop in ISPs, search portals, and data processing is due to changes in NAICS codes. Source: BLS/TWC, seasonal and other adjustments by FRB Dallas http://www.dallasfed.org
- 9. Texas Major Metro Area Employment Index, Jan2001=100 Texas (Nov=109) Austin (Nov=115.3) 120 Dallas (Nov=103.5) El Paso (Nov=106.2) 118 Ft. Worth (Nov=108.5) Houston (Nov=110) 116 San Antonio (Nov=112) 114 112 110 108 106 104 102 100 98 96 2002 2003 2004 2005 2006 2007 2008 2009 Source: BLS/TWC, seasonal and other adjustments by FRB Dallas http://www.dallasfed.org
- 10. Texas Metro Business-Cycle Indexes November 2009 Austin-Round Rock Brownsville-Harlingen Dallas-Plano-Irving MD 450 450 450 400 400 400 350 350 350 300 300 300 250 250 250 200 200 200 150 150 150 100 100 100 50 50 50 1981 1984 1987 1990 1993 1996 1999 2002 2005 2008 1981 1984 1987 1990 1993 1996 1999 2002 2005 2008 1981 1984 1987 1990 1993 1996 1999 2002 2005 2008 El Paso Forth Worth-Arlington MD Houston-Sugar Land-Baytown 450 450 450 400 400 400 350 350 350 300 300 300 250 250 250 200 200 200 150 150 150 100 100 100 50 50 50 1981 1984 1987 1990 1993 1996 1999 2002 2005 2008 1981 1984 1987 1990 1993 1996 1999 2002 2005 2008 1981 1984 1987 1990 1993 1996 1999 2002 2005 2008 Laredo McAllen-Edinburg-Mission San Antonio 450 450 450 400 400 400 350 350 350 300 300 300 250 250 250 200 200 200 150 150 150 100 100 100 50 50 50 1981 1984 1987 1990 1993 1996 1999 2002 2005 2008 1981 1984 1987 1990 1993 1996 1999 2002 2005 2008 1981 1984 1987 1990 1993 1996 1999 2002 2005 2008 Source: FRB Dallas http://www.dallasfed.org
- 11. Texas Major Metro Area Business-Cycle Indexes Index, Jan1990=100 260 Austin (Nov=224.9) 240 Dallas (Nov=144.4) 220 Ft. Worth (Nov=161.2) Houston (Nov=226.4) 200 San Antonio (Nov=169.8) 180 Texas (Nov=160.9) 160 140 120 100 80 1990 1991 1992 1993 1994 1995 1996 1997 1998 1999 2000 2001 2002 2003 2004 2005 2006 2007 2008 2009 Source: FRB Dallas http://www.dallasfed.org
- 12. Texas Border Metro Area Business-Cycle Indexes Index, Jan1990=100 380 Brownsville (Nov=189.9) El Paso (Nov=139.7) 360 Laredo (Nov=244.4) McAllen (Nov=294.7) 340 Texas (Nov=160.9) 320 300 280 260 240 220 200 180 160 140 120 100 80 1990 1991 1992 1993 1994 1995 1996 1997 1998 1999 2000 2001 2002 2003 2004 2005 2006 2007 2008 2009 Source: FRB Dallas http://www.dallasfed.org
- 13. Texas Border Employment SA by FRB Dallas. Monthly Changes. 1-month % change, December 2008 - November 2009 SAAR 15 10 5 0 -5 -10 -15 -20 Brownsville (Nov=5.98) El Paso (Nov=-2.63) Laredo (Nov=-5.43) McAllen (Nov=3.33) Border (Nov=0.34) Source: BLS/TWC, seasonal and other adjustments by FRB Dallas http://www.dallasfed.org
- 14. Texas and U.S. Unemployment Rate Percent, SA U.S. (Nov=10) 11 Texas (Nov=8) 10 9 8 7 6 5 4 3 1990 1991 1992 1993 1994 1995 1996 1997 1998 1999 2000 2001 2002 2003 2004 2005 2006 2007 2008 2009 Source: BLS http://www.dallasfed.org
- 15. Texas Major Metro Area Unemployment Rates Percent, SA Austin (Nov=7.1) Dallas (Nov=8.2) 9 Houston (Nov=8.4) San Antonio (Nov=6.9) 8 7 6 5 4 3 2 1 1990 1991 1992 1993 1994 1995 1996 1997 1998 1999 2000 2001 2002 2003 2004 2005 2006 2007 2008 2009 Source: BLS, seasonal adjustment by FRB Dallas http://www.dallasfed.org
- 16. Energy Prices and Texas Rig Count Rig count, Nominal price, $ weekly TX rig count (Dec=478) weekly Oil price (Jan=79.14) 1200 Natural gas price (Jan=58.74) Oil price 160 TX rig count 140 1000 120 800 100 600 80 60 400 40 200 Natural gas price* 20 0 0 2003 2004 2005 2006 2007 2008 2009 2010 * Natural gas price is multiplied by 10 Source: Wall Street Journal, Henry Hub, Baker Hughes http://www.dallasfed.org
- 17. Real Texas Construction Contract Values Index Jan 1990=100 SA, 5MMA 500 450 Residential (Nov=197) Nonresidential (Nov=111) 400 Nonbuilding (Nov=205) 350 300 250 200 150 100 50 0 1990 1991 1992 1993 1994 1995 1996 1997 1998 1999 2000 2001 2002 2003 2004 2005 2006 2007 2008 2009 Source: McGraw-Hill Construction F.W. Dodge http://www.dallasfed.org
- 18. Texas Residential Permits and Mortgage Rate 30-yr mortgage rate (Jan 04=5) Mortgage rate, Singe family permits (Nov=5848) Number of permits percent SA, 5MMA Multifamily permits (Nov=942) 12 16,000 Single family permits 14,000 10 12,000 8 10,000 6 30-yr mortgage rate 8,000 6,000 4 4,000 2 2,000 Multifamily permits 0 0 1990 1991 1992 1993 1994 1995 1996 1997 1998 1999 2000 2001 2002 2003 2004 2005 2006 2007 2008 2009 Source: Bureau of the Census http://www.dallasfed.org
- 19. Texas Exports by Region 2009:Q3 Index, 97Q1=100 Real $, SA Texas Total Mexico Canada European Union (27) 650 Asia** Latin America* 600 China 12% 550 4% other 500 19% 8% 450 400 13% Mexico 350 35% 300 9% 250 200 150 100 50 1997 1998 1999 2000 2001 2002 2003 2004 2005 2006 2007 2008 2009 * Latin America excluding Mexico; ** Asia excluding China Source: World Institute for Strategic Economic Research, FRB Dallas http://www.dallasfed.org
- 20. Texas Exports by Industry 2009:Q3 Index, 97Q1=100 Real $, SA TX total Chemicals Computers & Electronics Petroleum and Coal Products 1100 Machinery Agriculture and Food Transportation Equipment 1000 900 5% 9% 16% 800 700 10% 22% 600 other 500 21% 400 17% 300 200 100 0 1997 1998 1999 2000 2001 2002 2003 2004 2005 2006 2007 2008 2009 Source: World Institute for Strategic Economic Research, FRB Dallas http://www.dallasfed.org