
Recommended
More Related Content
Similar to The Distribution of Creative Workers Across Cities, Counties and Regions
Similar to The Distribution of Creative Workers Across Cities, Counties and Regions (13)
More from Canadian Rural Research Network / Réseau canadien de recherche rurale
More from Canadian Rural Research Network / Réseau canadien de recherche rurale (20)
The Distribution of Creative Workers Across Cities, Counties and Regions
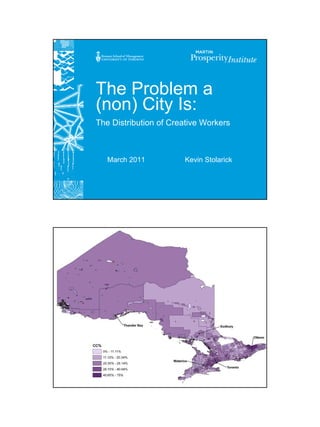
- 1. The Problem a (non) City Is: The Distribution of Creative Workers March 2011 Kevin Stolarick
- 2. US Metro Areas (Total Creative)
- 3. US Metro Areas (under 500,000) US Counties
- 4. US Counties (under 100,000) Ontario CSDs (over 100 creative)
- 5. Ontario CSDs (under 100,000) All Geographies (over 100 workers)
- 6. All Geographies (over 100) All Geographies (over 100) Above Upper?? Upper Bound?? Lower Bound??
- 7. Greatest Positive Residuals Los Alamos County, New Mexico 10,053 63.1% Arlington County, Virginia 134,321 60.0% Falls Church city, Virginia 5,969 59.4% District of Columbia, District of Columbia 321,466 54.3% Alexandria city, Virginia 88,771 53.3% Deep River (3547096) T 00000 1,905 52.8% New York County, New York 938,448 52.2% Fairfax County, Virginia 566,856 51.5% Howard County, Maryland 152,709 51.1% Loudoun County, Virginia 154,255 50.9% Montgomery County, Maryland 528,475 50.9% Fairfax city, Virginia 12,875 48.0% Durham, NC 274,720 46.9% Carter County, Montana 755 46.3% San Jose-Sunnyvale-Santa Clara, CA 888,480 46.1% Washington-Arlington-Alexandria, DC-VA-MD-WV 2,299,330 46.1% San Francisco County, California 474,594 46.1% Washington-Arlington-Alexandria, DC-VA-MD-WV 2,856,750 45.8% Albemarle County, Virginia 47,908 45.4% Ithaca, NY 49,860 45.2% Boulder, CO 155,400 44.8% Douglas County, Colorado 150,468 44.7% Middlesex County, Massachusetts 830,174 44.6% Framingham, MA 156,470 44.5% York County, Virginia 28,201 44.5% Bethesda-Gaithersburg-Frederick, MD 556,420 44.3% Marin County, California 131,550 44.2% Oakville (3524001) T 00000 91,130 44.1%
- 8. (Inverse) Distance Weighted Creative Class • Sum (for all CSDs) – Total CC ÷ distance away (km) • Gravity weighted • Total CC ÷ (distance away (km))2 Regressing Total Creative Class
- 9. Regressing Logged Creative Class Regressing Percent Creative Class
- 10. Regressing Total Creative Class - Gravity Regressing Logged Creative Class - Gravity
- 11. Regressing Percent Creative Class - Gravity Takeaways (for now) • Distributions are different – All (large) versus small (rural) regions • Strong, positive relationship – Region size (logged) and SHARE creative – Bigger regions higher share – Lower bound – steeper than average (faster) • Outside (above) the “schmeer” – (select) Urban Centres – University Towns (some) – Rural concentrations (meds/eds/law)
- 12. Takeaways (for now) • Creative Proximity - distance – Zilch, nada, nothing • Creative Proximity – gravity – Total Creative (not logged; share) • Region/Market Size – Consistent • Density – Not Really • Growth – Negative?